

Key Insights
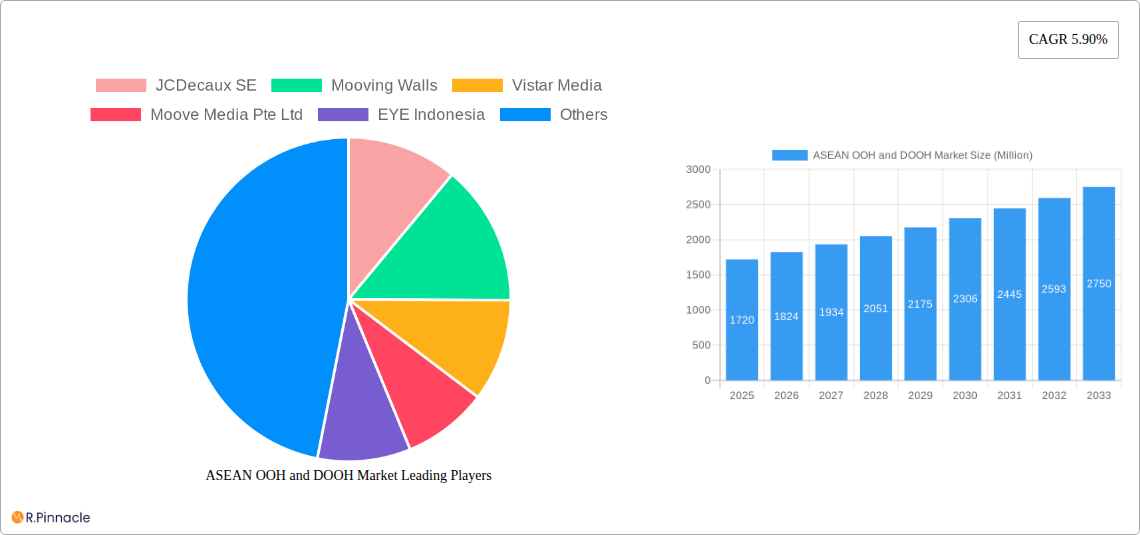
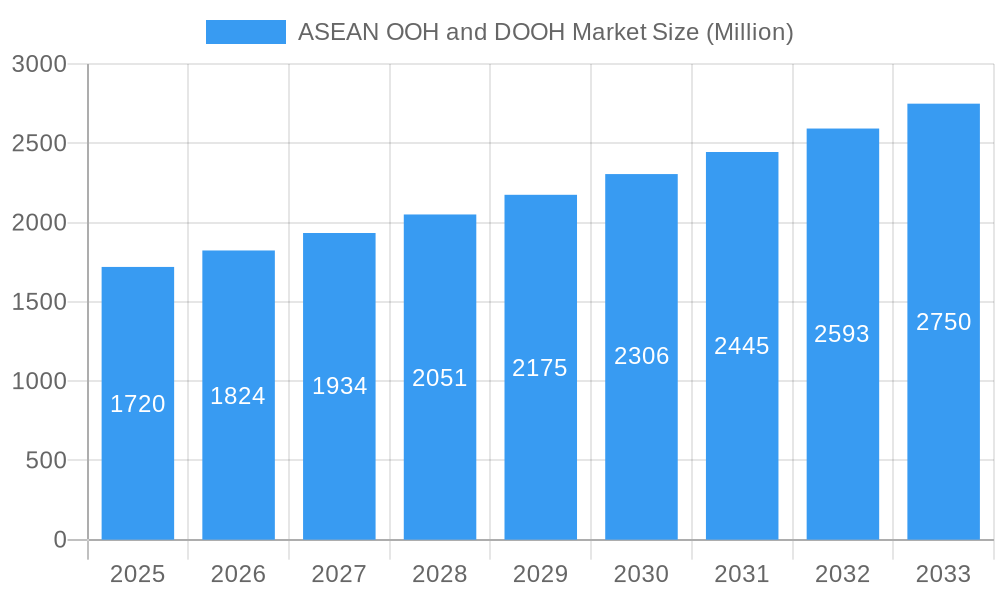
The ASEAN Out-of-Home (OOH) and Digital Out-of-Home (DOOH) advertising market presents a compelling growth opportunity. With a 2025 market size of $1.72 billion and a projected Compound Annual Growth Rate (CAGR) of 5.90% from 2025 to 2033, the market is poised for significant expansion. This robust growth is fueled by several key factors. Increasing urbanization across the ASEAN region leads to higher population density in key metropolitan areas, creating more opportunities for impactful OOH and DOOH advertising placements. The rising adoption of programmatic advertising technologies is streamlining the buying process and improving targeting capabilities, attracting more advertisers to the DOOH segment. Furthermore, innovative advertising formats, such as interactive displays and location-based advertising, are enhancing engagement and driving higher return on investment (ROI) for brands. The increasing use of mobile devices and data analytics also contributes to more effective campaign measurement and optimization within the DOOH space. However, challenges remain, including the need for improved infrastructure in some areas and competition from other digital advertising channels.
ASEAN OOH and DOOH Market Market Size (In Billion)
Despite potential restraints, the long-term outlook for the ASEAN OOH and DOOH market remains positive. The continuous development of smart cities and the expansion of digital infrastructure will further fuel market growth. The ongoing focus on data-driven campaigns and targeted advertising will attract a larger share of advertising budgets to this dynamic sector. Key players in the market, including JCDecaux SE, Mooving Walls, and Vistar Media, are strategically investing in technological advancements and strategic partnerships to strengthen their market positions and capitalize on the emerging opportunities. The diversity of the ASEAN region, with its varied cultural landscapes and consumer preferences, requires a tailored approach to advertising strategies, creating further opportunities for specialized agencies and innovative advertising solutions to thrive. The market's segmentation, although not explicitly defined, likely reflects variations in advertising formats (billboards, transit advertising, digital screens), geographic locations, and target audiences. The projected growth anticipates a sustained increase in advertising spend and a continued shift towards data-driven, targeted advertising solutions.
ASEAN OOH and DOOH Market Company Market Share
This comprehensive report provides an in-depth analysis of the ASEAN Out-of-Home (OOH) and Digital Out-of-Home (DOOH) advertising market, covering the period 2019-2033. The report offers invaluable insights into market dynamics, growth drivers, key players, and future trends, making it an essential resource for industry professionals, investors, and strategic decision-makers. With a focus on actionable intelligence and data-driven analysis, this report helps navigate the complexities of this rapidly evolving market. The report's base year is 2025, with estimations for 2025 and forecasts extending to 2033, leveraging historical data from 2019-2024. The market is valued in Millions.
ASEAN OOH and DOOH Market Structure & Innovation Trends
This section analyzes the ASEAN OOH and DOOH market structure, exploring market concentration, innovation drivers, regulatory landscapes, and competitive dynamics. The analysis considers factors such as product substitutes, end-user demographics, and mergers & acquisitions (M&A) activities.
Market Concentration: The ASEAN OOH and DOOH market exhibits a moderately concentrated structure, with a few major players holding significant market share. JCDecaux SE, Clear Channel Singapore Pte Ltd, and other regional players command a substantial portion of the market, while numerous smaller agencies cater to niche segments. Precise market share figures vary across countries and segments, with an estimated xx% held by the top 5 players in 2025.
Innovation Drivers: Technological advancements are major drivers of innovation, particularly the integration of digital technologies into OOH advertising. The rising adoption of programmatic DOOH, augmented reality (AR) experiences, and data-driven targeting strategies fuels market growth and enhances campaign effectiveness.
Regulatory Frameworks: Varying regulatory frameworks across ASEAN nations impact market dynamics. Regulations regarding advertising content, placement, and permits influence operational costs and campaign planning. Harmonization of regulations could unlock greater efficiency and scalability.
Product Substitutes: Digital advertising channels, such as social media and online video, pose competitive challenges to OOH. However, OOH's unique ability to create impactful brand experiences and reach geographically targeted audiences continues to differentiate it.
End-User Demographics: The end-user base is diverse, encompassing brands across various sectors, including FMCG, retail, tourism, and entertainment. Targeting specific demographics requires understanding consumer preferences and media consumption patterns in different ASEAN countries.
M&A Activities: The ASEAN OOH and DOOH landscape is witnessing consolidation through M&A activities. While precise deal values are commercially sensitive, transactions typically aim to expand market reach, gain access to new technologies, or enhance service offerings. The total value of M&A deals in the sector from 2019-2024 is estimated to be $XX Million.
ASEAN OOH and DOOH Market Dynamics & Trends
This section delves into the market's dynamic environment, encompassing growth drivers, technological disruptions, consumer preferences, and competitive landscape dynamics. We analyze market growth in terms of Compound Annual Growth Rate (CAGR) and market penetration rates.
The ASEAN OOH and DOOH market is characterized by significant growth potential, fueled by rising urbanization, increasing disposable incomes, and expanding tourism. The market exhibits a robust CAGR of xx% during the forecast period (2025-2033), with market penetration expected to reach xx% by 2033. Key factors driving this growth include:
- Rising Urbanization: The increasing concentration of population in urban centers creates a larger addressable audience for OOH advertising.
- Tourism Growth: The flourishing tourism sector in many ASEAN nations presents lucrative opportunities for brands to reach a wide range of international travelers.
- Technological Advancements: Programmatic DOOH and data-driven targeting enhance campaign effectiveness, attracting greater advertiser investment.
- Increased Disposable Incomes: Growing disposable incomes, particularly in emerging ASEAN economies, lead to increased spending on advertising.
- Brand Building: OOH provides unmatched potential to build brand awareness and engagement through high-impact visual displays.
The competitive dynamics are influenced by factors such as pricing strategies, service offerings, and technological capabilities. Market leaders are continuously innovating to maintain their competitive edge.
Dominant Regions & Segments in ASEAN OOH and DOOH Market
This section pinpoints the leading regions and segments within the ASEAN OOH and DOOH market. We analyze market dominance based on factors such as economic development, infrastructure, and advertising spending.
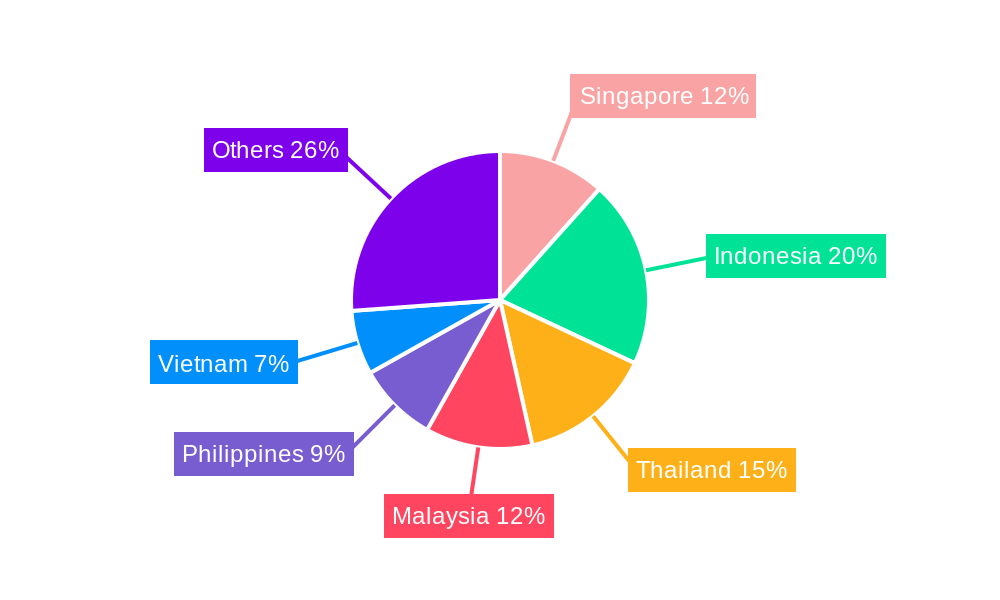
Dominant Regions: The analysis identifies Singapore, Thailand, and Indonesia as the dominant regions, exhibiting the highest market value and growth rates within the ASEAN OOH and DOOH market. These regions are characterized by:
- Strong Economic Growth: These countries' robust economic growth fuels higher advertising expenditure across various sectors.
- Developed Infrastructure: Advanced infrastructure, including extensive transportation networks and well-developed urban areas, facilitates OOH advertising deployment.
- High Advertising Spending: These markets exhibit relatively higher advertising spending as a percentage of GDP, contributing to the high growth of the OOH and DOOH sector.
Detailed Dominance Analysis: While these three regions are leading, other countries within ASEAN are showing significant potential for growth, driven by factors such as increasing urbanization and expanding digital infrastructure. Further analysis indicates these countries exhibit different trends and varying market penetration levels. This analysis differentiates factors contributing to individual market dominance for each country.
ASEAN OOH and DOOH Market Product Innovations
The ASEAN OOH and DOOH market is witnessing continuous product innovation, driven by technological advancements and evolving consumer preferences. New products and applications are enhancing campaign effectiveness and brand engagement. The integration of digital technologies, such as programmatic buying, data analytics, and interactive displays, are transforming the landscape. These innovations are improving targeting capabilities, providing measurable results, and enhancing the overall customer experience. The focus on interactive displays and immersive experiences provides a competitive advantage for companies capitalizing on this evolution.
Report Scope & Segmentation Analysis
This report segments the ASEAN OOH and DOOH market based on several factors including advertising format (billboards, transit, street furniture, etc.), location (urban, rural), and advertising type (static, digital). Each segment presents varying growth rates and market sizes. The report provides detailed information on the size, growth projections, and competitive dynamics of each segment.
Key Drivers of ASEAN OOH and DOOH Market Growth
Several factors propel the growth of the ASEAN OOH and DOOH market. Key drivers include:
- Technological advancements: Programmatic DOOH, data-driven targeting, and interactive displays improve advertising effectiveness and ROI.
- Economic growth: Rising disposable incomes and increased consumer spending drive greater advertising investment.
- Urbanization: The concentration of populations in urban areas provides a large audience for OOH advertising.
- Tourism growth: The increasing number of tourists provides opportunities for brands to reach broader audiences.
- Government support: Supportive government policies and infrastructure development create favorable conditions for the sector's growth.
Challenges in the ASEAN OOH and DOOH Market Sector
Despite promising growth prospects, several challenges hinder the ASEAN OOH and DOOH market. These include:
- Regulatory complexities: Inconsistent regulations across different countries complicate campaign planning and execution.
- Infrastructure limitations: Limited infrastructure in certain regions restricts the deployment of OOH advertising.
- High installation and maintenance costs: The significant capital investment required can be a barrier for smaller businesses.
- Competition from digital channels: The rise of digital advertising channels creates competitive pressure for OOH.
Emerging Opportunities in ASEAN OOH and DOOH Market
Despite the challenges, several emerging opportunities exist in the ASEAN OOH and DOOH market:
- Programmatic DOOH: The increasing adoption of programmatic DOOH opens new possibilities for targeted and efficient advertising.
- Mobile integration: Integrating OOH campaigns with mobile devices to enhance engagement and measure impact.
- Data-driven targeting: Utilizing data analytics to optimize campaign placement and maximize reach.
- Immersive experiences: Creating engaging AR/VR experiences through OOH to enhance brand recall.
- Sustainability: Focusing on sustainable and eco-friendly OOH solutions to meet increasing environmental concerns.
Leading Players in the ASEAN OOH and DOOH Market Market
- JCDecaux SE (https://www.jcdecaux.com/)
- Mooving Walls
- Vistar Media (https://www.vistarmedia.com/)
- Moove Media Pte Ltd
- EYE Indonesia
- Clear Channel Singapore Pte Ltd (https://www.clearchannel.com/)
- Plan B Media Public Company Limited
- Goldsun Media Group
- Unique Media Group
- On Digitals Company Limited
- *List Not Exhaustive
Key Developments in ASEAN OOH and DOOH Market Industry
- March 2024: Adeffi expands OOH services into India, Nepal, Thailand, and Vietnam, signifying increased regional consolidation and potential for standardized OOH strategies.
- March 2024: Singapore Tourism Board's 3D billboard campaign highlights the growing use of innovative DOOH technology for impactful brand promotion, demonstrating a potential trend for immersive and engaging campaigns.
Future Outlook for ASEAN OOH and DOOH Market Market
The ASEAN OOH and DOOH market is poised for continued growth, driven by technological advancements, economic expansion, and evolving consumer preferences. The increasing adoption of programmatic DOOH, data-driven strategies, and interactive displays will further enhance campaign effectiveness and ROI. Strategic investments in infrastructure development and regulatory harmonization will unlock additional growth potential. The market's future is bright, with opportunities for innovation and expansion across various segments.
ASEAN OOH and DOOH Market Segmentation
-
1. Type
- 1.1. Static (Traditional) OOH
-
1.2. Digital OOH (LED Screens)
- 1.2.1. Programmatic OOH
- 1.2.2. Other Digital OOH Tools
-
2. Application
- 2.1. Billboard
-
2.2. Transportation (Transit)
- 2.2.1. Airports
- 2.2.2. Other Transportation Applications (Buses, etc.)
- 2.3. Street Furniture
- 2.4. Other Place-based Media
-
3. End-user Industry
- 3.1. Automotive
- 3.2. Retail and Consumer Goods
- 3.3. Healthcare
- 3.4. BFSI
- 3.5. Other End-user Industries
ASEAN OOH and DOOH Market Segmentation By Geography
-
1. North America
- 1.1. United States
- 1.2. Canada
- 1.3. Mexico
-
2. South America
- 2.1. Brazil
- 2.2. Argentina
- 2.3. Rest of South America
-
3. Europe
- 3.1. United Kingdom
- 3.2. Germany
- 3.3. France
- 3.4. Italy
- 3.5. Spain
- 3.6. Russia
- 3.7. Benelux
- 3.8. Nordics
- 3.9. Rest of Europe
-
4. Middle East & Africa
- 4.1. Turkey
- 4.2. Israel
- 4.3. GCC
- 4.4. North Africa
- 4.5. South Africa
- 4.6. Rest of Middle East & Africa
-
5. Asia Pacific
- 5.1. China
- 5.2. India
- 5.3. Japan
- 5.4. South Korea
- 5.5. ASEAN
- 5.6. Oceania
- 5.7. Rest of Asia Pacific
ASEAN OOH and DOOH Market Regional Market Share
Geographic Coverage of ASEAN OOH and DOOH Market
ASEAN OOH and DOOH Market REPORT HIGHLIGHTS
| Aspects | Details |
|---|---|
| Study Period | 2020-2034 |
| Base Year | 2025 |
| Estimated Year | 2026 |
| Forecast Period | 2026-2034 |
| Historical Period | 2020-2025 |
| Growth Rate | CAGR of 5.90% from 2020-2034 |
| Segmentation |
|
Table of Contents
- 1. Introduction
- 1.1. Research Scope
- 1.2. Market Segmentation
- 1.3. Research Objective
- 1.4. Definitions and Assumptions
- 2. Executive Summary
- 2.1. Market Snapshot
- 3. Market Dynamics
- 3.1. Market Drivers
- 3.2. Market Restrains
- 3.3. Market Trends
- 3.4. Market Opportunities
- 4. Market Factor Analysis
- 4.1. Porters Five Forces
- 4.1.1. Bargaining Power of Suppliers
- 4.1.2. Bargaining Power of Buyers
- 4.1.3. Threat of New Entrants
- 4.1.4. Threat of Substitutes
- 4.1.5. Competitive Rivalry
- 4.2. PESTEL analysis
- 4.3. BCG Analysis
- 4.3.1. Stars (High Growth, High Market Share)
- 4.3.2. Cash Cows (Low Growth, High Market Share)
- 4.3.3. Question Mark (High Growth, Low Market Share)
- 4.3.4. Dogs (Low Growth, Low Market Share)
- 4.4. Ansoff Matrix Analysis
- 4.5. Supply Chain Analysis
- 4.6. Regulatory Landscape
- 4.7. Current Market Potential and Opportunity Assessment (TAM–SAM–SOM Framework)
- 4.8. PRI Analyst Note
- 4.1. Porters Five Forces
- 5. Market Analysis, Insights and Forecast 2021-2033
- 5.1. Market Analysis, Insights and Forecast - by Type
- 5.1.1. Static (Traditional) OOH
- 5.1.2. Digital OOH (LED Screens)
- 5.1.2.1. Programmatic OOH
- 5.1.2.2. Other Digital OOH Tools
- 5.2. Market Analysis, Insights and Forecast - by Application
- 5.2.1. Billboard
- 5.2.2. Transportation (Transit)
- 5.2.2.1. Airports
- 5.2.2.2. Other Transportation Applications (Buses, etc.)
- 5.2.3. Street Furniture
- 5.2.4. Other Place-based Media
- 5.3. Market Analysis, Insights and Forecast - by End-user Industry
- 5.3.1. Automotive
- 5.3.2. Retail and Consumer Goods
- 5.3.3. Healthcare
- 5.3.4. BFSI
- 5.3.5. Other End-user Industries
- 5.4. Market Analysis, Insights and Forecast - by Region
- 5.4.1. North America
- 5.4.2. South America
- 5.4.3. Europe
- 5.4.4. Middle East & Africa
- 5.4.5. Asia Pacific
- 5.1. Market Analysis, Insights and Forecast - by Type
- 6. Global ASEAN OOH and DOOH Market Analysis, Insights and Forecast, 2021-2033
- 6.1. Market Analysis, Insights and Forecast - by Type
- 6.1.1. Static (Traditional) OOH
- 6.1.2. Digital OOH (LED Screens)
- 6.1.2.1. Programmatic OOH
- 6.1.2.2. Other Digital OOH Tools
- 6.2. Market Analysis, Insights and Forecast - by Application
- 6.2.1. Billboard
- 6.2.2. Transportation (Transit)
- 6.2.2.1. Airports
- 6.2.2.2. Other Transportation Applications (Buses, etc.)
- 6.2.3. Street Furniture
- 6.2.4. Other Place-based Media
- 6.3. Market Analysis, Insights and Forecast - by End-user Industry
- 6.3.1. Automotive
- 6.3.2. Retail and Consumer Goods
- 6.3.3. Healthcare
- 6.3.4. BFSI
- 6.3.5. Other End-user Industries
- 6.1. Market Analysis, Insights and Forecast - by Type
- 7. North America ASEAN OOH and DOOH Market Analysis, Insights and Forecast, 2020-2032
- 7.1. Market Analysis, Insights and Forecast - by Type
- 7.1.1. Static (Traditional) OOH
- 7.1.2. Digital OOH (LED Screens)
- 7.1.2.1. Programmatic OOH
- 7.1.2.2. Other Digital OOH Tools
- 7.2. Market Analysis, Insights and Forecast - by Application
- 7.2.1. Billboard
- 7.2.2. Transportation (Transit)
- 7.2.2.1. Airports
- 7.2.2.2. Other Transportation Applications (Buses, etc.)
- 7.2.3. Street Furniture
- 7.2.4. Other Place-based Media
- 7.3. Market Analysis, Insights and Forecast - by End-user Industry
- 7.3.1. Automotive
- 7.3.2. Retail and Consumer Goods
- 7.3.3. Healthcare
- 7.3.4. BFSI
- 7.3.5. Other End-user Industries
- 7.1. Market Analysis, Insights and Forecast - by Type
- 8. South America ASEAN OOH and DOOH Market Analysis, Insights and Forecast, 2020-2032
- 8.1. Market Analysis, Insights and Forecast - by Type
- 8.1.1. Static (Traditional) OOH
- 8.1.2. Digital OOH (LED Screens)
- 8.1.2.1. Programmatic OOH
- 8.1.2.2. Other Digital OOH Tools
- 8.2. Market Analysis, Insights and Forecast - by Application
- 8.2.1. Billboard
- 8.2.2. Transportation (Transit)
- 8.2.2.1. Airports
- 8.2.2.2. Other Transportation Applications (Buses, etc.)
- 8.2.3. Street Furniture
- 8.2.4. Other Place-based Media
- 8.3. Market Analysis, Insights and Forecast - by End-user Industry
- 8.3.1. Automotive
- 8.3.2. Retail and Consumer Goods
- 8.3.3. Healthcare
- 8.3.4. BFSI
- 8.3.5. Other End-user Industries
- 8.1. Market Analysis, Insights and Forecast - by Type
- 9. Europe ASEAN OOH and DOOH Market Analysis, Insights and Forecast, 2020-2032
- 9.1. Market Analysis, Insights and Forecast - by Type
- 9.1.1. Static (Traditional) OOH
- 9.1.2. Digital OOH (LED Screens)
- 9.1.2.1. Programmatic OOH
- 9.1.2.2. Other Digital OOH Tools
- 9.2. Market Analysis, Insights and Forecast - by Application
- 9.2.1. Billboard
- 9.2.2. Transportation (Transit)
- 9.2.2.1. Airports
- 9.2.2.2. Other Transportation Applications (Buses, etc.)
- 9.2.3. Street Furniture
- 9.2.4. Other Place-based Media
- 9.3. Market Analysis, Insights and Forecast - by End-user Industry
- 9.3.1. Automotive
- 9.3.2. Retail and Consumer Goods
- 9.3.3. Healthcare
- 9.3.4. BFSI
- 9.3.5. Other End-user Industries
- 9.1. Market Analysis, Insights and Forecast - by Type
- 10. Middle East & Africa ASEAN OOH and DOOH Market Analysis, Insights and Forecast, 2020-2032
- 10.1. Market Analysis, Insights and Forecast - by Type
- 10.1.1. Static (Traditional) OOH
- 10.1.2. Digital OOH (LED Screens)
- 10.1.2.1. Programmatic OOH
- 10.1.2.2. Other Digital OOH Tools
- 10.2. Market Analysis, Insights and Forecast - by Application
- 10.2.1. Billboard
- 10.2.2. Transportation (Transit)
- 10.2.2.1. Airports
- 10.2.2.2. Other Transportation Applications (Buses, etc.)
- 10.2.3. Street Furniture
- 10.2.4. Other Place-based Media
- 10.3. Market Analysis, Insights and Forecast - by End-user Industry
- 10.3.1. Automotive
- 10.3.2. Retail and Consumer Goods
- 10.3.3. Healthcare
- 10.3.4. BFSI
- 10.3.5. Other End-user Industries
- 10.1. Market Analysis, Insights and Forecast - by Type
- 11. Asia Pacific ASEAN OOH and DOOH Market Analysis, Insights and Forecast, 2020-2032
- 11.1. Market Analysis, Insights and Forecast - by Type
- 11.1.1. Static (Traditional) OOH
- 11.1.2. Digital OOH (LED Screens)
- 11.1.2.1. Programmatic OOH
- 11.1.2.2. Other Digital OOH Tools
- 11.2. Market Analysis, Insights and Forecast - by Application
- 11.2.1. Billboard
- 11.2.2. Transportation (Transit)
- 11.2.2.1. Airports
- 11.2.2.2. Other Transportation Applications (Buses, etc.)
- 11.2.3. Street Furniture
- 11.2.4. Other Place-based Media
- 11.3. Market Analysis, Insights and Forecast - by End-user Industry
- 11.3.1. Automotive
- 11.3.2. Retail and Consumer Goods
- 11.3.3. Healthcare
- 11.3.4. BFSI
- 11.3.5. Other End-user Industries
- 11.1. Market Analysis, Insights and Forecast - by Type
- 12. Competitive Analysis
- 12.1. Company Profiles
- 12.1.1 JCDecaux SE
- 12.1.1.1. Company Overview
- 12.1.1.2. Products
- 12.1.1.3. Company Financials
- 12.1.1.4. SWOT Analysis
- 12.1.2 Mooving Walls
- 12.1.2.1. Company Overview
- 12.1.2.2. Products
- 12.1.2.3. Company Financials
- 12.1.2.4. SWOT Analysis
- 12.1.3 Vistar Media
- 12.1.3.1. Company Overview
- 12.1.3.2. Products
- 12.1.3.3. Company Financials
- 12.1.3.4. SWOT Analysis
- 12.1.4 Moove Media Pte Ltd
- 12.1.4.1. Company Overview
- 12.1.4.2. Products
- 12.1.4.3. Company Financials
- 12.1.4.4. SWOT Analysis
- 12.1.5 EYE Indonesia
- 12.1.5.1. Company Overview
- 12.1.5.2. Products
- 12.1.5.3. Company Financials
- 12.1.5.4. SWOT Analysis
- 12.1.6 Clear Channel Singapore Pte Ltd
- 12.1.6.1. Company Overview
- 12.1.6.2. Products
- 12.1.6.3. Company Financials
- 12.1.6.4. SWOT Analysis
- 12.1.7 Plan B Media Public Company Limited
- 12.1.7.1. Company Overview
- 12.1.7.2. Products
- 12.1.7.3. Company Financials
- 12.1.7.4. SWOT Analysis
- 12.1.8 Goldsun Media Group
- 12.1.8.1. Company Overview
- 12.1.8.2. Products
- 12.1.8.3. Company Financials
- 12.1.8.4. SWOT Analysis
- 12.1.9 Unique Media Group
- 12.1.9.1. Company Overview
- 12.1.9.2. Products
- 12.1.9.3. Company Financials
- 12.1.9.4. SWOT Analysis
- 12.1.10 On Digitals Company Limited*List Not Exhaustive
- 12.1.10.1. Company Overview
- 12.1.10.2. Products
- 12.1.10.3. Company Financials
- 12.1.10.4. SWOT Analysis
- 12.1.1 JCDecaux SE
- 12.2. Market Entropy
- 12.2.1 Company's Key Areas Served
- 12.2.2 Recent Developments
- 12.3. Company Market Share Analysis 2025
- 12.3.1 Top 5 Companies Market Share Analysis
- 12.3.2 Top 3 Companies Market Share Analysis
- 12.4. List of Potential Customers
- 13. Research Methodology
List of Figures
- Figure 1: Global ASEAN OOH and DOOH Market Revenue Breakdown (Million, %) by Region 2025 & 2033
- Figure 2: Global ASEAN OOH and DOOH Market Volume Breakdown (Billion, %) by Region 2025 & 2033
- Figure 3: North America ASEAN OOH and DOOH Market Revenue (Million), by Type 2025 & 2033
- Figure 4: North America ASEAN OOH and DOOH Market Volume (Billion), by Type 2025 & 2033
- Figure 5: North America ASEAN OOH and DOOH Market Revenue Share (%), by Type 2025 & 2033
- Figure 6: North America ASEAN OOH and DOOH Market Volume Share (%), by Type 2025 & 2033
- Figure 7: North America ASEAN OOH and DOOH Market Revenue (Million), by Application 2025 & 2033
- Figure 8: North America ASEAN OOH and DOOH Market Volume (Billion), by Application 2025 & 2033
- Figure 9: North America ASEAN OOH and DOOH Market Revenue Share (%), by Application 2025 & 2033
- Figure 10: North America ASEAN OOH and DOOH Market Volume Share (%), by Application 2025 & 2033
- Figure 11: North America ASEAN OOH and DOOH Market Revenue (Million), by End-user Industry 2025 & 2033
- Figure 12: North America ASEAN OOH and DOOH Market Volume (Billion), by End-user Industry 2025 & 2033
- Figure 13: North America ASEAN OOH and DOOH Market Revenue Share (%), by End-user Industry 2025 & 2033
- Figure 14: North America ASEAN OOH and DOOH Market Volume Share (%), by End-user Industry 2025 & 2033
- Figure 15: North America ASEAN OOH and DOOH Market Revenue (Million), by Country 2025 & 2033
- Figure 16: North America ASEAN OOH and DOOH Market Volume (Billion), by Country 2025 & 2033
- Figure 17: North America ASEAN OOH and DOOH Market Revenue Share (%), by Country 2025 & 2033
- Figure 18: North America ASEAN OOH and DOOH Market Volume Share (%), by Country 2025 & 2033
- Figure 19: South America ASEAN OOH and DOOH Market Revenue (Million), by Type 2025 & 2033
- Figure 20: South America ASEAN OOH and DOOH Market Volume (Billion), by Type 2025 & 2033
- Figure 21: South America ASEAN OOH and DOOH Market Revenue Share (%), by Type 2025 & 2033
- Figure 22: South America ASEAN OOH and DOOH Market Volume Share (%), by Type 2025 & 2033
- Figure 23: South America ASEAN OOH and DOOH Market Revenue (Million), by Application 2025 & 2033
- Figure 24: South America ASEAN OOH and DOOH Market Volume (Billion), by Application 2025 & 2033
- Figure 25: South America ASEAN OOH and DOOH Market Revenue Share (%), by Application 2025 & 2033
- Figure 26: South America ASEAN OOH and DOOH Market Volume Share (%), by Application 2025 & 2033
- Figure 27: South America ASEAN OOH and DOOH Market Revenue (Million), by End-user Industry 2025 & 2033
- Figure 28: South America ASEAN OOH and DOOH Market Volume (Billion), by End-user Industry 2025 & 2033
- Figure 29: South America ASEAN OOH and DOOH Market Revenue Share (%), by End-user Industry 2025 & 2033
- Figure 30: South America ASEAN OOH and DOOH Market Volume Share (%), by End-user Industry 2025 & 2033
- Figure 31: South America ASEAN OOH and DOOH Market Revenue (Million), by Country 2025 & 2033
- Figure 32: South America ASEAN OOH and DOOH Market Volume (Billion), by Country 2025 & 2033
- Figure 33: South America ASEAN OOH and DOOH Market Revenue Share (%), by Country 2025 & 2033
- Figure 34: South America ASEAN OOH and DOOH Market Volume Share (%), by Country 2025 & 2033
- Figure 35: Europe ASEAN OOH and DOOH Market Revenue (Million), by Type 2025 & 2033
- Figure 36: Europe ASEAN OOH and DOOH Market Volume (Billion), by Type 2025 & 2033
- Figure 37: Europe ASEAN OOH and DOOH Market Revenue Share (%), by Type 2025 & 2033
- Figure 38: Europe ASEAN OOH and DOOH Market Volume Share (%), by Type 2025 & 2033
- Figure 39: Europe ASEAN OOH and DOOH Market Revenue (Million), by Application 2025 & 2033
- Figure 40: Europe ASEAN OOH and DOOH Market Volume (Billion), by Application 2025 & 2033
- Figure 41: Europe ASEAN OOH and DOOH Market Revenue Share (%), by Application 2025 & 2033
- Figure 42: Europe ASEAN OOH and DOOH Market Volume Share (%), by Application 2025 & 2033
- Figure 43: Europe ASEAN OOH and DOOH Market Revenue (Million), by End-user Industry 2025 & 2033
- Figure 44: Europe ASEAN OOH and DOOH Market Volume (Billion), by End-user Industry 2025 & 2033
- Figure 45: Europe ASEAN OOH and DOOH Market Revenue Share (%), by End-user Industry 2025 & 2033
- Figure 46: Europe ASEAN OOH and DOOH Market Volume Share (%), by End-user Industry 2025 & 2033
- Figure 47: Europe ASEAN OOH and DOOH Market Revenue (Million), by Country 2025 & 2033
- Figure 48: Europe ASEAN OOH and DOOH Market Volume (Billion), by Country 2025 & 2033
- Figure 49: Europe ASEAN OOH and DOOH Market Revenue Share (%), by Country 2025 & 2033
- Figure 50: Europe ASEAN OOH and DOOH Market Volume Share (%), by Country 2025 & 2033
- Figure 51: Middle East & Africa ASEAN OOH and DOOH Market Revenue (Million), by Type 2025 & 2033
- Figure 52: Middle East & Africa ASEAN OOH and DOOH Market Volume (Billion), by Type 2025 & 2033
- Figure 53: Middle East & Africa ASEAN OOH and DOOH Market Revenue Share (%), by Type 2025 & 2033
- Figure 54: Middle East & Africa ASEAN OOH and DOOH Market Volume Share (%), by Type 2025 & 2033
- Figure 55: Middle East & Africa ASEAN OOH and DOOH Market Revenue (Million), by Application 2025 & 2033
- Figure 56: Middle East & Africa ASEAN OOH and DOOH Market Volume (Billion), by Application 2025 & 2033
- Figure 57: Middle East & Africa ASEAN OOH and DOOH Market Revenue Share (%), by Application 2025 & 2033
- Figure 58: Middle East & Africa ASEAN OOH and DOOH Market Volume Share (%), by Application 2025 & 2033
- Figure 59: Middle East & Africa ASEAN OOH and DOOH Market Revenue (Million), by End-user Industry 2025 & 2033
- Figure 60: Middle East & Africa ASEAN OOH and DOOH Market Volume (Billion), by End-user Industry 2025 & 2033
- Figure 61: Middle East & Africa ASEAN OOH and DOOH Market Revenue Share (%), by End-user Industry 2025 & 2033
- Figure 62: Middle East & Africa ASEAN OOH and DOOH Market Volume Share (%), by End-user Industry 2025 & 2033
- Figure 63: Middle East & Africa ASEAN OOH and DOOH Market Revenue (Million), by Country 2025 & 2033
- Figure 64: Middle East & Africa ASEAN OOH and DOOH Market Volume (Billion), by Country 2025 & 2033
- Figure 65: Middle East & Africa ASEAN OOH and DOOH Market Revenue Share (%), by Country 2025 & 2033
- Figure 66: Middle East & Africa ASEAN OOH and DOOH Market Volume Share (%), by Country 2025 & 2033
- Figure 67: Asia Pacific ASEAN OOH and DOOH Market Revenue (Million), by Type 2025 & 2033
- Figure 68: Asia Pacific ASEAN OOH and DOOH Market Volume (Billion), by Type 2025 & 2033
- Figure 69: Asia Pacific ASEAN OOH and DOOH Market Revenue Share (%), by Type 2025 & 2033
- Figure 70: Asia Pacific ASEAN OOH and DOOH Market Volume Share (%), by Type 2025 & 2033
- Figure 71: Asia Pacific ASEAN OOH and DOOH Market Revenue (Million), by Application 2025 & 2033
- Figure 72: Asia Pacific ASEAN OOH and DOOH Market Volume (Billion), by Application 2025 & 2033
- Figure 73: Asia Pacific ASEAN OOH and DOOH Market Revenue Share (%), by Application 2025 & 2033
- Figure 74: Asia Pacific ASEAN OOH and DOOH Market Volume Share (%), by Application 2025 & 2033
- Figure 75: Asia Pacific ASEAN OOH and DOOH Market Revenue (Million), by End-user Industry 2025 & 2033
- Figure 76: Asia Pacific ASEAN OOH and DOOH Market Volume (Billion), by End-user Industry 2025 & 2033
- Figure 77: Asia Pacific ASEAN OOH and DOOH Market Revenue Share (%), by End-user Industry 2025 & 2033
- Figure 78: Asia Pacific ASEAN OOH and DOOH Market Volume Share (%), by End-user Industry 2025 & 2033
- Figure 79: Asia Pacific ASEAN OOH and DOOH Market Revenue (Million), by Country 2025 & 2033
- Figure 80: Asia Pacific ASEAN OOH and DOOH Market Volume (Billion), by Country 2025 & 2033
- Figure 81: Asia Pacific ASEAN OOH and DOOH Market Revenue Share (%), by Country 2025 & 2033
- Figure 82: Asia Pacific ASEAN OOH and DOOH Market Volume Share (%), by Country 2025 & 2033
List of Tables
- Table 1: Global ASEAN OOH and DOOH Market Revenue Million Forecast, by Type 2020 & 2033
- Table 2: Global ASEAN OOH and DOOH Market Volume Billion Forecast, by Type 2020 & 2033
- Table 3: Global ASEAN OOH and DOOH Market Revenue Million Forecast, by Application 2020 & 2033
- Table 4: Global ASEAN OOH and DOOH Market Volume Billion Forecast, by Application 2020 & 2033
- Table 5: Global ASEAN OOH and DOOH Market Revenue Million Forecast, by End-user Industry 2020 & 2033
- Table 6: Global ASEAN OOH and DOOH Market Volume Billion Forecast, by End-user Industry 2020 & 2033
- Table 7: Global ASEAN OOH and DOOH Market Revenue Million Forecast, by Region 2020 & 2033
- Table 8: Global ASEAN OOH and DOOH Market Volume Billion Forecast, by Region 2020 & 2033
- Table 9: Global ASEAN OOH and DOOH Market Revenue Million Forecast, by Type 2020 & 2033
- Table 10: Global ASEAN OOH and DOOH Market Volume Billion Forecast, by Type 2020 & 2033
- Table 11: Global ASEAN OOH and DOOH Market Revenue Million Forecast, by Application 2020 & 2033
- Table 12: Global ASEAN OOH and DOOH Market Volume Billion Forecast, by Application 2020 & 2033
- Table 13: Global ASEAN OOH and DOOH Market Revenue Million Forecast, by End-user Industry 2020 & 2033
- Table 14: Global ASEAN OOH and DOOH Market Volume Billion Forecast, by End-user Industry 2020 & 2033
- Table 15: Global ASEAN OOH and DOOH Market Revenue Million Forecast, by Country 2020 & 2033
- Table 16: Global ASEAN OOH and DOOH Market Volume Billion Forecast, by Country 2020 & 2033
- Table 17: United States ASEAN OOH and DOOH Market Revenue (Million) Forecast, by Application 2020 & 2033
- Table 18: United States ASEAN OOH and DOOH Market Volume (Billion) Forecast, by Application 2020 & 2033
- Table 19: Canada ASEAN OOH and DOOH Market Revenue (Million) Forecast, by Application 2020 & 2033
- Table 20: Canada ASEAN OOH and DOOH Market Volume (Billion) Forecast, by Application 2020 & 2033
- Table 21: Mexico ASEAN OOH and DOOH Market Revenue (Million) Forecast, by Application 2020 & 2033
- Table 22: Mexico ASEAN OOH and DOOH Market Volume (Billion) Forecast, by Application 2020 & 2033
- Table 23: Global ASEAN OOH and DOOH Market Revenue Million Forecast, by Type 2020 & 2033
- Table 24: Global ASEAN OOH and DOOH Market Volume Billion Forecast, by Type 2020 & 2033
- Table 25: Global ASEAN OOH and DOOH Market Revenue Million Forecast, by Application 2020 & 2033
- Table 26: Global ASEAN OOH and DOOH Market Volume Billion Forecast, by Application 2020 & 2033
- Table 27: Global ASEAN OOH and DOOH Market Revenue Million Forecast, by End-user Industry 2020 & 2033
- Table 28: Global ASEAN OOH and DOOH Market Volume Billion Forecast, by End-user Industry 2020 & 2033
- Table 29: Global ASEAN OOH and DOOH Market Revenue Million Forecast, by Country 2020 & 2033
- Table 30: Global ASEAN OOH and DOOH Market Volume Billion Forecast, by Country 2020 & 2033
- Table 31: Brazil ASEAN OOH and DOOH Market Revenue (Million) Forecast, by Application 2020 & 2033
- Table 32: Brazil ASEAN OOH and DOOH Market Volume (Billion) Forecast, by Application 2020 & 2033
- Table 33: Argentina ASEAN OOH and DOOH Market Revenue (Million) Forecast, by Application 2020 & 2033
- Table 34: Argentina ASEAN OOH and DOOH Market Volume (Billion) Forecast, by Application 2020 & 2033
- Table 35: Rest of South America ASEAN OOH and DOOH Market Revenue (Million) Forecast, by Application 2020 & 2033
- Table 36: Rest of South America ASEAN OOH and DOOH Market Volume (Billion) Forecast, by Application 2020 & 2033
- Table 37: Global ASEAN OOH and DOOH Market Revenue Million Forecast, by Type 2020 & 2033
- Table 38: Global ASEAN OOH and DOOH Market Volume Billion Forecast, by Type 2020 & 2033
- Table 39: Global ASEAN OOH and DOOH Market Revenue Million Forecast, by Application 2020 & 2033
- Table 40: Global ASEAN OOH and DOOH Market Volume Billion Forecast, by Application 2020 & 2033
- Table 41: Global ASEAN OOH and DOOH Market Revenue Million Forecast, by End-user Industry 2020 & 2033
- Table 42: Global ASEAN OOH and DOOH Market Volume Billion Forecast, by End-user Industry 2020 & 2033
- Table 43: Global ASEAN OOH and DOOH Market Revenue Million Forecast, by Country 2020 & 2033
- Table 44: Global ASEAN OOH and DOOH Market Volume Billion Forecast, by Country 2020 & 2033
- Table 45: United Kingdom ASEAN OOH and DOOH Market Revenue (Million) Forecast, by Application 2020 & 2033
- Table 46: United Kingdom ASEAN OOH and DOOH Market Volume (Billion) Forecast, by Application 2020 & 2033
- Table 47: Germany ASEAN OOH and DOOH Market Revenue (Million) Forecast, by Application 2020 & 2033
- Table 48: Germany ASEAN OOH and DOOH Market Volume (Billion) Forecast, by Application 2020 & 2033
- Table 49: France ASEAN OOH and DOOH Market Revenue (Million) Forecast, by Application 2020 & 2033
- Table 50: France ASEAN OOH and DOOH Market Volume (Billion) Forecast, by Application 2020 & 2033
- Table 51: Italy ASEAN OOH and DOOH Market Revenue (Million) Forecast, by Application 2020 & 2033
- Table 52: Italy ASEAN OOH and DOOH Market Volume (Billion) Forecast, by Application 2020 & 2033
- Table 53: Spain ASEAN OOH and DOOH Market Revenue (Million) Forecast, by Application 2020 & 2033
- Table 54: Spain ASEAN OOH and DOOH Market Volume (Billion) Forecast, by Application 2020 & 2033
- Table 55: Russia ASEAN OOH and DOOH Market Revenue (Million) Forecast, by Application 2020 & 2033
- Table 56: Russia ASEAN OOH and DOOH Market Volume (Billion) Forecast, by Application 2020 & 2033
- Table 57: Benelux ASEAN OOH and DOOH Market Revenue (Million) Forecast, by Application 2020 & 2033
- Table 58: Benelux ASEAN OOH and DOOH Market Volume (Billion) Forecast, by Application 2020 & 2033
- Table 59: Nordics ASEAN OOH and DOOH Market Revenue (Million) Forecast, by Application 2020 & 2033
- Table 60: Nordics ASEAN OOH and DOOH Market Volume (Billion) Forecast, by Application 2020 & 2033
- Table 61: Rest of Europe ASEAN OOH and DOOH Market Revenue (Million) Forecast, by Application 2020 & 2033
- Table 62: Rest of Europe ASEAN OOH and DOOH Market Volume (Billion) Forecast, by Application 2020 & 2033
- Table 63: Global ASEAN OOH and DOOH Market Revenue Million Forecast, by Type 2020 & 2033
- Table 64: Global ASEAN OOH and DOOH Market Volume Billion Forecast, by Type 2020 & 2033
- Table 65: Global ASEAN OOH and DOOH Market Revenue Million Forecast, by Application 2020 & 2033
- Table 66: Global ASEAN OOH and DOOH Market Volume Billion Forecast, by Application 2020 & 2033
- Table 67: Global ASEAN OOH and DOOH Market Revenue Million Forecast, by End-user Industry 2020 & 2033
- Table 68: Global ASEAN OOH and DOOH Market Volume Billion Forecast, by End-user Industry 2020 & 2033
- Table 69: Global ASEAN OOH and DOOH Market Revenue Million Forecast, by Country 2020 & 2033
- Table 70: Global ASEAN OOH and DOOH Market Volume Billion Forecast, by Country 2020 & 2033
- Table 71: Turkey ASEAN OOH and DOOH Market Revenue (Million) Forecast, by Application 2020 & 2033
- Table 72: Turkey ASEAN OOH and DOOH Market Volume (Billion) Forecast, by Application 2020 & 2033
- Table 73: Israel ASEAN OOH and DOOH Market Revenue (Million) Forecast, by Application 2020 & 2033
- Table 74: Israel ASEAN OOH and DOOH Market Volume (Billion) Forecast, by Application 2020 & 2033
- Table 75: GCC ASEAN OOH and DOOH Market Revenue (Million) Forecast, by Application 2020 & 2033
- Table 76: GCC ASEAN OOH and DOOH Market Volume (Billion) Forecast, by Application 2020 & 2033
- Table 77: North Africa ASEAN OOH and DOOH Market Revenue (Million) Forecast, by Application 2020 & 2033
- Table 78: North Africa ASEAN OOH and DOOH Market Volume (Billion) Forecast, by Application 2020 & 2033
- Table 79: South Africa ASEAN OOH and DOOH Market Revenue (Million) Forecast, by Application 2020 & 2033
- Table 80: South Africa ASEAN OOH and DOOH Market Volume (Billion) Forecast, by Application 2020 & 2033
- Table 81: Rest of Middle East & Africa ASEAN OOH and DOOH Market Revenue (Million) Forecast, by Application 2020 & 2033
- Table 82: Rest of Middle East & Africa ASEAN OOH and DOOH Market Volume (Billion) Forecast, by Application 2020 & 2033
- Table 83: Global ASEAN OOH and DOOH Market Revenue Million Forecast, by Type 2020 & 2033
- Table 84: Global ASEAN OOH and DOOH Market Volume Billion Forecast, by Type 2020 & 2033
- Table 85: Global ASEAN OOH and DOOH Market Revenue Million Forecast, by Application 2020 & 2033
- Table 86: Global ASEAN OOH and DOOH Market Volume Billion Forecast, by Application 2020 & 2033
- Table 87: Global ASEAN OOH and DOOH Market Revenue Million Forecast, by End-user Industry 2020 & 2033
- Table 88: Global ASEAN OOH and DOOH Market Volume Billion Forecast, by End-user Industry 2020 & 2033
- Table 89: Global ASEAN OOH and DOOH Market Revenue Million Forecast, by Country 2020 & 2033
- Table 90: Global ASEAN OOH and DOOH Market Volume Billion Forecast, by Country 2020 & 2033
- Table 91: China ASEAN OOH and DOOH Market Revenue (Million) Forecast, by Application 2020 & 2033
- Table 92: China ASEAN OOH and DOOH Market Volume (Billion) Forecast, by Application 2020 & 2033
- Table 93: India ASEAN OOH and DOOH Market Revenue (Million) Forecast, by Application 2020 & 2033
- Table 94: India ASEAN OOH and DOOH Market Volume (Billion) Forecast, by Application 2020 & 2033
- Table 95: Japan ASEAN OOH and DOOH Market Revenue (Million) Forecast, by Application 2020 & 2033
- Table 96: Japan ASEAN OOH and DOOH Market Volume (Billion) Forecast, by Application 2020 & 2033
- Table 97: South Korea ASEAN OOH and DOOH Market Revenue (Million) Forecast, by Application 2020 & 2033
- Table 98: South Korea ASEAN OOH and DOOH Market Volume (Billion) Forecast, by Application 2020 & 2033
- Table 99: ASEAN ASEAN OOH and DOOH Market Revenue (Million) Forecast, by Application 2020 & 2033
- Table 100: ASEAN ASEAN OOH and DOOH Market Volume (Billion) Forecast, by Application 2020 & 2033
- Table 101: Oceania ASEAN OOH and DOOH Market Revenue (Million) Forecast, by Application 2020 & 2033
- Table 102: Oceania ASEAN OOH and DOOH Market Volume (Billion) Forecast, by Application 2020 & 2033
- Table 103: Rest of Asia Pacific ASEAN OOH and DOOH Market Revenue (Million) Forecast, by Application 2020 & 2033
- Table 104: Rest of Asia Pacific ASEAN OOH and DOOH Market Volume (Billion) Forecast, by Application 2020 & 2033
Frequently Asked Questions
1. What is the projected Compound Annual Growth Rate (CAGR) of the ASEAN OOH and DOOH Market?
The projected CAGR is approximately 5.90%.
2. Which companies are prominent players in the ASEAN OOH and DOOH Market?
Key companies in the market include JCDecaux SE, Mooving Walls, Vistar Media, Moove Media Pte Ltd, EYE Indonesia, Clear Channel Singapore Pte Ltd, Plan B Media Public Company Limited, Goldsun Media Group, Unique Media Group, On Digitals Company Limited*List Not Exhaustive.
3. What are the main segments of the ASEAN OOH and DOOH Market?
The market segments include Type, Application , End-user Industry .
4. Can you provide details about the market size?
The market size is estimated to be USD 1.72 Million as of 2022.
5. What are some drivers contributing to market growth?
Ongoing Shift Toward Digital Advertising Aided by Increased Spending on Smart City Projects; Increase in Air Traffic Owing to Growth in Tourism Industry has Aided Spending on Airport Advertisements in ASEAN.
6. What are the notable trends driving market growth?
Ongoing Shift Toward Digital Advertising Aided by Increased Spending on Smart City Projects.
7. Are there any restraints impacting market growth?
Ongoing Shift Toward Digital Advertising Aided by Increased Spending on Smart City Projects; Increase in Air Traffic Owing to Growth in Tourism Industry has Aided Spending on Airport Advertisements in ASEAN.
8. Can you provide examples of recent developments in the market?
March 2024: Adeffi, an out-of-home (OOH) advertising company based in Bangladesh, announced a major expansion of its services into India, Nepal, Thailand, and Vietnam. This strategic move aims to transform how companies in these five countries approach OOH advertising, offering them a robust platform to promote their brands regionally.
9. What pricing options are available for accessing the report?
Pricing options include single-user, multi-user, and enterprise licenses priced at USD 3800, USD 4500, and USD 5800 respectively.
10. Is the market size provided in terms of value or volume?
The market size is provided in terms of value, measured in Million and volume, measured in Billion.
11. Are there any specific market keywords associated with the report?
Yes, the market keyword associated with the report is "ASEAN OOH and DOOH Market," which aids in identifying and referencing the specific market segment covered.
12. How do I determine which pricing option suits my needs best?
The pricing options vary based on user requirements and access needs. Individual users may opt for single-user licenses, while businesses requiring broader access may choose multi-user or enterprise licenses for cost-effective access to the report.
13. Are there any additional resources or data provided in the ASEAN OOH and DOOH Market report?
While the report offers comprehensive insights, it's advisable to review the specific contents or supplementary materials provided to ascertain if additional resources or data are available.
14. How can I stay updated on further developments or reports in the ASEAN OOH and DOOH Market?
To stay informed about further developments, trends, and reports in the ASEAN OOH and DOOH Market, consider subscribing to industry newsletters, following relevant companies and organizations, or regularly checking reputable industry news sources and publications.
Methodology
Step 1 - Identification of Relevant Samples Size from Population Database


Step 2 - Approaches for Defining Global Market Size (Value, Volume* & Price*)

Note*: In applicable scenarios
Step 3 - Data Sources
Primary Research
- Web Analytics
- Survey Reports
- Research Institute
- Latest Research Reports
- Opinion Leaders
Secondary Research
- Annual Reports
- White Paper
- Latest Press Release
- Industry Association
- Paid Database
- Investor Presentations

Step 4 - Data Triangulation
Involves using different sources of information in order to increase the validity of a study
These sources are likely to be stakeholders in a program - participants, other researchers, program staff, other community members, and so on.
Then we put all data in single framework & apply various statistical tools to find out the dynamic on the market.
During the analysis stage, feedback from the stakeholder groups would be compared to determine areas of agreement as well as areas of divergence