

Key Insights
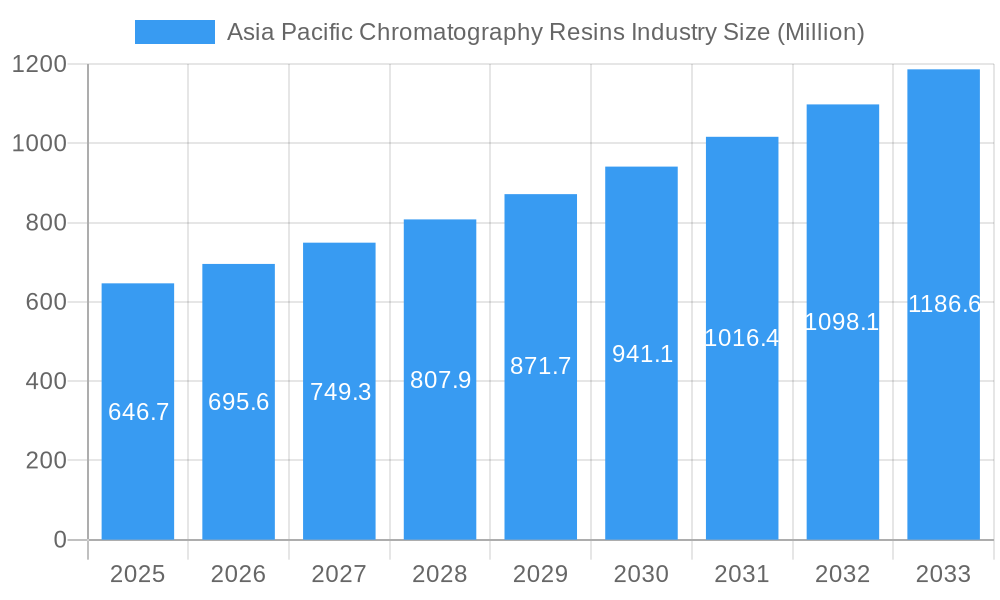
The Asia-Pacific chromatography resins market, valued at $646.7 million in 2025, is projected for robust growth, exceeding a 7% CAGR through 2033. This expansion is fueled by several key factors. The burgeoning pharmaceutical industry in the region, particularly in China, India, and Japan, significantly drives demand for high-quality chromatography resins used in drug production and purification. Furthermore, the increasing prevalence of chronic diseases and rising healthcare expenditure are contributing to the growth of biopharmaceutical manufacturing, thereby boosting resin consumption. Growth in the food and beverage industry, particularly in countries with stringent quality and safety regulations, also fuels demand for advanced separation and purification technologies utilizing chromatography resins. Technological advancements, such as the development of more efficient and selective resins, further enhance market appeal. While challenges exist, such as the high cost of certain resins and potential regulatory hurdles in some markets, the overall market outlook remains positive, underpinned by the strong growth trajectory of the region's key end-user industries.
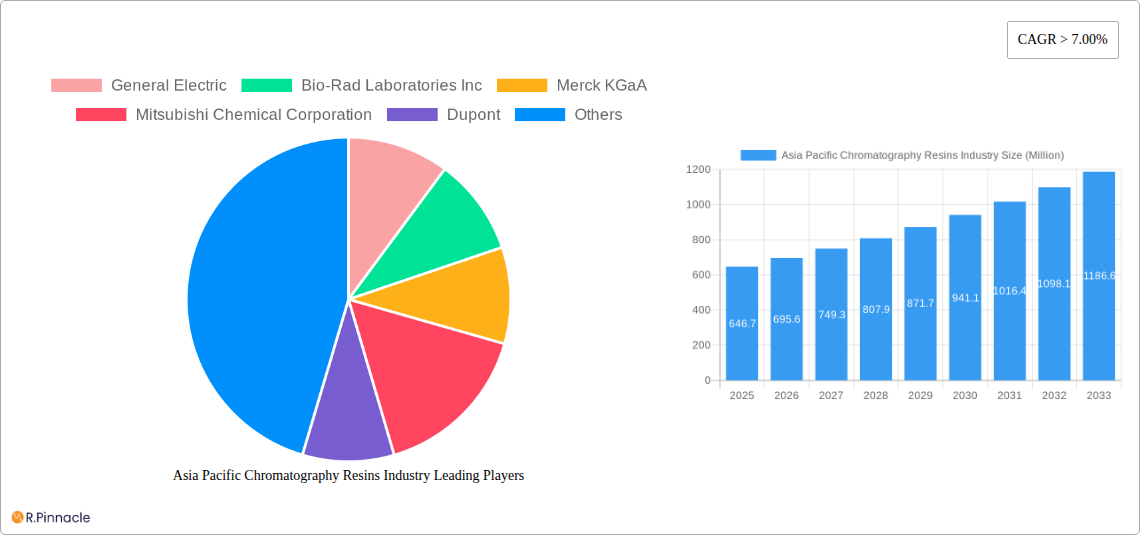
Asia Pacific Chromatography Resins Industry Market Size (In Million)
The segmental analysis reveals that drug production accounts for a substantial share of the overall market, followed by the food and beverage sector. Within the origin segment, synthetic-based dextran resins hold a notable market share due to their superior performance characteristics and versatility. Among technologies, ion exchange chromatography resins dominate due to their widespread applications in various industries. However, other advanced technologies, such as affinity and size exclusion chromatography, are witnessing significant adoption rates driven by the increasing demand for high-purity products. Leading players such as General Electric, Bio-Rad Laboratories, Merck KGaA, and others, are actively engaged in developing innovative products and expanding their market presence to capitalize on the growth opportunities within the Asia-Pacific region. The market's future depends on continuous innovation, cost optimization, and regulatory alignment within the respective markets.
Asia Pacific Chromatography Resins Industry Company Market Share
This comprehensive report provides an in-depth analysis of the Asia Pacific chromatography resins market, offering actionable insights for industry professionals. The study period covers 2019-2033, with a focus on the forecast period (2025-2033), base year (2025), and estimated year (2025). This report is invaluable for strategic planning, investment decisions, and understanding the competitive landscape.
Asia Pacific Chromatography Resins Industry Market Structure & Innovation Trends
The Asia Pacific chromatography resins market is moderately concentrated, with key players such as General Electric, Bio-Rad Laboratories Inc, Merck KGaA, Mitsubishi Chemical Corporation, DuPont, Pall Corporation, Tosoh Bioscience LLC, Purolite, Agilent Technologies, Avantor Inc, and Thermo Fisher Scientific holding significant market share. However, the presence of numerous smaller players indicates a dynamic competitive landscape. Market share data for 2024 estimates that the top 5 players hold approximately 60% of the market, valued at approximately $XX Million.
Innovation is driven by the increasing demand for high-performance resins across various applications, including pharmaceuticals, biotechnology, and environmental monitoring. Regulatory frameworks, particularly those concerning drug purity and environmental protection, heavily influence resin development. Product substitutes, such as alternative separation techniques, exert some competitive pressure. The market exhibits significant M&A activity, with deal values exceeding $XX Million in the past five years, predominantly driven by companies seeking to expand their product portfolios and geographical reach. End-user demographics, particularly the growth of the pharmaceutical and biotechnology sectors in Asia Pacific, are key growth drivers.
- Market Concentration: Moderately concentrated, top 5 players holding approximately 60% market share (2024 estimate).
- Innovation Drivers: Demand for high-performance resins, regulatory pressures, and technological advancements.
- M&A Activity: Significant, with deal values exceeding $XX Million in the last 5 years.
Asia Pacific Chromatography Resins Industry Market Dynamics & Trends
The Asia Pacific chromatography resins market is experiencing robust growth, driven by several key factors. The rising prevalence of chronic diseases is fueling the demand for advanced pharmaceutical products, which heavily rely on chromatography resins for purification and separation. Simultaneously, the stringent regulatory environment necessitates the adoption of high-quality resins to ensure product safety and efficacy. Technological advancements, such as the development of novel resin materials and improved separation techniques, are further contributing to market expansion. The increasing adoption of chromatography resins in diverse industries, including food and beverage and environmental monitoring, is also a significant growth driver. The CAGR for the forecast period (2025-2033) is projected to be approximately xx%. Market penetration in emerging economies within the region remains relatively low, offering significant untapped potential for growth. Competitive dynamics are characterized by intense rivalry among established players and the emergence of new entrants.
Dominant Regions & Segments in Asia Pacific Chromatography Resins Industry
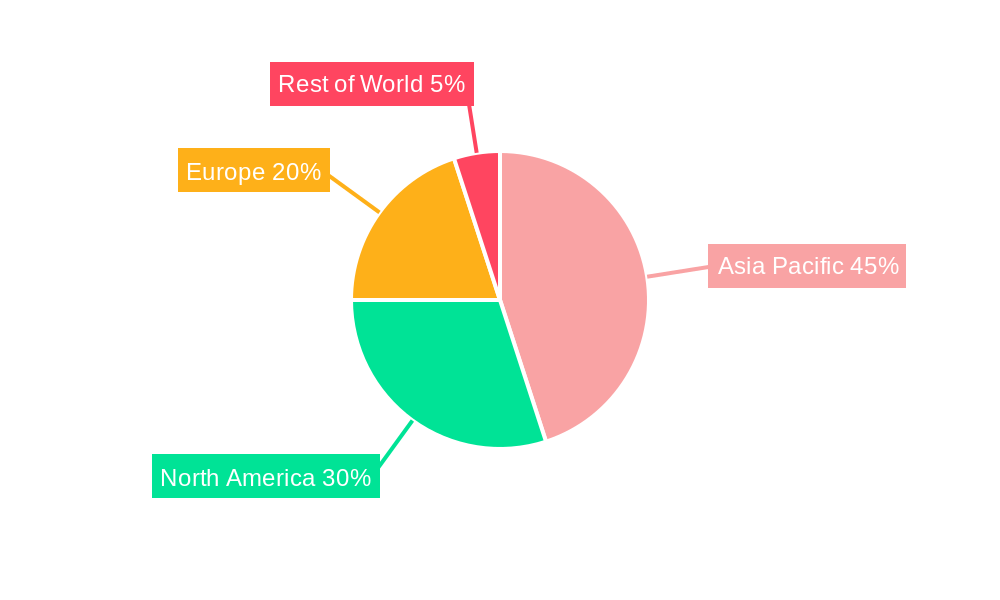
China and India are the dominant regions within the Asia Pacific chromatography resins market, driven by substantial growth in their pharmaceutical and biotechnology sectors, coupled with increasing government investment in infrastructure and healthcare. Japan, while exhibiting slower growth compared to China and India, still maintains a significant market share due to its advanced technological capabilities and established manufacturing base.
- Key Drivers in China and India:
- Rapid expansion of pharmaceutical and biotechnology industries.
- Increasing government investments in healthcare and R&D.
- Growing awareness of environmental monitoring and water purification.
- Dominant Segments:
- By Technology: Ion exchange chromatography resins hold the largest market share, followed by affinity chromatography resins.
- By End-User: The pharmaceutical industry is the dominant end-user segment.
- By Origin: Synthetic-based resins are more prevalent than natural-based resins due to their superior performance and consistency.
Asia Pacific Chromatography Resins Industry Product Innovations
Recent innovations focus on improving resin selectivity, efficiency, and scalability. New materials, such as monoliths and hybrid resins, offer enhanced performance and reduced processing times. The development of resins with improved biocompatibility is critical for pharmaceutical applications. These innovations enhance the overall efficiency and reduce the cost of downstream processing, thereby increasing market attractiveness.
Report Scope & Segmentation Analysis
This report segments the Asia Pacific chromatography resins market based on technology (ion exchange, affinity, size exclusion, hydrophobic interaction, others), origin (natural-based, synthetic-based (dextran)), end-user industry (pharmaceuticals, drug production, water & environmental agencies, food & beverages, others). Growth projections, market sizes, and competitive dynamics are analyzed for each segment. For example, the pharmaceutical segment is projected to exhibit the highest growth rate during the forecast period, while ion exchange resins are expected to maintain their dominance in terms of market share.
Key Drivers of Asia Pacific Chromatography Resins Industry Growth
The Asia Pacific chromatography resins market is propelled by several key factors:
- Technological Advancements: Development of novel resin materials and improved separation techniques.
- Growing Pharmaceutical Industry: Rising demand for advanced pharmaceutical products.
- Stringent Regulations: Emphasis on product purity and safety.
- Expanding Biotechnology Sector: Increasing use of chromatography resins in biopharmaceutical production.
Challenges in the Asia Pacific Chromatography Resins Industry Sector
Significant challenges include:
- Regulatory Hurdles: Compliance with stringent regulations can increase production costs.
- Supply Chain Disruptions: Geopolitical factors and raw material availability can impact production.
- Intense Competition: The market is characterized by intense rivalry among established and emerging players. This leads to price pressures and necessitates continuous innovation.
Emerging Opportunities in Asia Pacific Chromatography Resins Industry
The market presents substantial opportunities:
- Expansion in Emerging Economies: Significant untapped potential in rapidly developing Asian countries.
- Development of Novel Resins: Opportunities for creating superior resins with enhanced performance characteristics.
- Growing Demand in Diverse Industries: Increased adoption in food & beverage, environmental monitoring, and other sectors.
Leading Players in the Asia Pacific Chromatography Resins Industry Market
Key Developments in Asia Pacific Chromatography Resins Industry Industry
- 2023 Q3: Launch of a new high-performance affinity chromatography resin by Company X.
- 2022 Q4: Merger between Company Y and Company Z, leading to expanded market reach.
- 2021 Q2: Introduction of a novel size exclusion chromatography resin with enhanced selectivity. (Further developments can be added here)
Future Outlook for Asia Pacific Chromatography Resins Industry Market
The Asia Pacific chromatography resins market is poised for significant growth over the next decade, driven by technological advancements, expanding end-user industries, and increasing regulatory pressures. Strategic investments in R&D and expansion into emerging markets will be crucial for success. The market's future is bright, with substantial opportunities for established and emerging players alike.
Asia Pacific Chromatography Resins Industry Segmentation
-
1. Origin
-
1.1. Natural-based
- 1.1.1. Agarose
- 1.1.2. Dextran
-
1.2. Synthetic-based
- 1.2.1. Silica Gel
- 1.2.2. Aluminum Oxide
- 1.2.3. Polystyrene
- 1.2.4. Other Synthetic-based Resins
-
1.1. Natural-based
-
2. Technology
- 2.1. Ion Exchange Chromatography Resins
- 2.2. Affinity Chromatography Resins
- 2.3. Size Exclusion Chromatography Resins
- 2.4. Hydrophobic Interaction Chromatography Resins
- 2.5. Other Technologies
-
3. End-user Industry
-
3.1. Pharmaceuticals
- 3.1.1. Biotechnology
- 3.1.2. Drug Discovery
- 3.1.3. Drug Production
- 3.2. Water and Environmental Agencies
- 3.3. Food and Beverages
- 3.4. Other End-user Industries
-
3.1. Pharmaceuticals
-
4. Geography
- 4.1. China
- 4.2. India
- 4.3. Japan
- 4.4. Rest of Asia-Pacific
Asia Pacific Chromatography Resins Industry Segmentation By Geography
- 1. China
- 2. India
- 3. Japan
- 4. Rest of Asia Pacific
Asia Pacific Chromatography Resins Industry Regional Market Share
Geographic Coverage of Asia Pacific Chromatography Resins Industry
Asia Pacific Chromatography Resins Industry REPORT HIGHLIGHTS
| Aspects | Details |
|---|---|
| Study Period | 2020-2034 |
| Base Year | 2025 |
| Estimated Year | 2026 |
| Forecast Period | 2026-2034 |
| Historical Period | 2020-2025 |
| Growth Rate | CAGR of > 7.00% from 2020-2034 |
| Segmentation |
|
Table of Contents
- 1. Introduction
- 1.1. Research Scope
- 1.2. Market Segmentation
- 1.3. Research Objective
- 1.4. Definitions and Assumptions
- 2. Executive Summary
- 2.1. Market Snapshot
- 3. Market Dynamics
- 3.1. Market Drivers
- 3.2. Market Restrains
- 3.3. Market Trends
- 3.4. Market Opportunities
- 4. Market Factor Analysis
- 4.1. Porters Five Forces
- 4.1.1. Bargaining Power of Suppliers
- 4.1.2. Bargaining Power of Buyers
- 4.1.3. Threat of New Entrants
- 4.1.4. Threat of Substitutes
- 4.1.5. Competitive Rivalry
- 4.2. PESTEL analysis
- 4.3. BCG Analysis
- 4.3.1. Stars (High Growth, High Market Share)
- 4.3.2. Cash Cows (Low Growth, High Market Share)
- 4.3.3. Question Mark (High Growth, Low Market Share)
- 4.3.4. Dogs (Low Growth, Low Market Share)
- 4.4. Ansoff Matrix Analysis
- 4.5. Supply Chain Analysis
- 4.6. Regulatory Landscape
- 4.7. Current Market Potential and Opportunity Assessment (TAM–SAM–SOM Framework)
- 4.8. PRI Analyst Note
- 4.1. Porters Five Forces
- 5. Market Analysis, Insights and Forecast 2021-2033
- 5.1. Market Analysis, Insights and Forecast - by Origin
- 5.1.1. Natural-based
- 5.1.1.1. Agarose
- 5.1.1.2. Dextran
- 5.1.2. Synthetic-based
- 5.1.2.1. Silica Gel
- 5.1.2.2. Aluminum Oxide
- 5.1.2.3. Polystyrene
- 5.1.2.4. Other Synthetic-based Resins
- 5.1.1. Natural-based
- 5.2. Market Analysis, Insights and Forecast - by Technology
- 5.2.1. Ion Exchange Chromatography Resins
- 5.2.2. Affinity Chromatography Resins
- 5.2.3. Size Exclusion Chromatography Resins
- 5.2.4. Hydrophobic Interaction Chromatography Resins
- 5.2.5. Other Technologies
- 5.3. Market Analysis, Insights and Forecast - by End-user Industry
- 5.3.1. Pharmaceuticals
- 5.3.1.1. Biotechnology
- 5.3.1.2. Drug Discovery
- 5.3.1.3. Drug Production
- 5.3.2. Water and Environmental Agencies
- 5.3.3. Food and Beverages
- 5.3.4. Other End-user Industries
- 5.3.1. Pharmaceuticals
- 5.4. Market Analysis, Insights and Forecast - by Geography
- 5.4.1. China
- 5.4.2. India
- 5.4.3. Japan
- 5.4.4. Rest of Asia-Pacific
- 5.5. Market Analysis, Insights and Forecast - by Region
- 5.5.1. China
- 5.5.2. India
- 5.5.3. Japan
- 5.5.4. Rest of Asia Pacific
- 5.1. Market Analysis, Insights and Forecast - by Origin
- 6. Asia Pacific Chromatography Resins Industry Analysis, Insights and Forecast, 2021-2033
- 6.1. Market Analysis, Insights and Forecast - by Origin
- 6.1.1. Natural-based
- 6.1.1.1. Agarose
- 6.1.1.2. Dextran
- 6.1.2. Synthetic-based
- 6.1.2.1. Silica Gel
- 6.1.2.2. Aluminum Oxide
- 6.1.2.3. Polystyrene
- 6.1.2.4. Other Synthetic-based Resins
- 6.1.1. Natural-based
- 6.2. Market Analysis, Insights and Forecast - by Technology
- 6.2.1. Ion Exchange Chromatography Resins
- 6.2.2. Affinity Chromatography Resins
- 6.2.3. Size Exclusion Chromatography Resins
- 6.2.4. Hydrophobic Interaction Chromatography Resins
- 6.2.5. Other Technologies
- 6.3. Market Analysis, Insights and Forecast - by End-user Industry
- 6.3.1. Pharmaceuticals
- 6.3.1.1. Biotechnology
- 6.3.1.2. Drug Discovery
- 6.3.1.3. Drug Production
- 6.3.2. Water and Environmental Agencies
- 6.3.3. Food and Beverages
- 6.3.4. Other End-user Industries
- 6.3.1. Pharmaceuticals
- 6.4. Market Analysis, Insights and Forecast - by Geography
- 6.4.1. China
- 6.4.2. India
- 6.4.3. Japan
- 6.4.4. Rest of Asia-Pacific
- 6.1. Market Analysis, Insights and Forecast - by Origin
- 7. China Asia Pacific Chromatography Resins Industry Analysis, Insights and Forecast, 2020-2032
- 7.1. Market Analysis, Insights and Forecast - by Origin
- 7.1.1. Natural-based
- 7.1.1.1. Agarose
- 7.1.1.2. Dextran
- 7.1.2. Synthetic-based
- 7.1.2.1. Silica Gel
- 7.1.2.2. Aluminum Oxide
- 7.1.2.3. Polystyrene
- 7.1.2.4. Other Synthetic-based Resins
- 7.1.1. Natural-based
- 7.2. Market Analysis, Insights and Forecast - by Technology
- 7.2.1. Ion Exchange Chromatography Resins
- 7.2.2. Affinity Chromatography Resins
- 7.2.3. Size Exclusion Chromatography Resins
- 7.2.4. Hydrophobic Interaction Chromatography Resins
- 7.2.5. Other Technologies
- 7.3. Market Analysis, Insights and Forecast - by End-user Industry
- 7.3.1. Pharmaceuticals
- 7.3.1.1. Biotechnology
- 7.3.1.2. Drug Discovery
- 7.3.1.3. Drug Production
- 7.3.2. Water and Environmental Agencies
- 7.3.3. Food and Beverages
- 7.3.4. Other End-user Industries
- 7.3.1. Pharmaceuticals
- 7.4. Market Analysis, Insights and Forecast - by Geography
- 7.4.1. China
- 7.4.2. India
- 7.4.3. Japan
- 7.4.4. Rest of Asia-Pacific
- 7.1. Market Analysis, Insights and Forecast - by Origin
- 8. India Asia Pacific Chromatography Resins Industry Analysis, Insights and Forecast, 2020-2032
- 8.1. Market Analysis, Insights and Forecast - by Origin
- 8.1.1. Natural-based
- 8.1.1.1. Agarose
- 8.1.1.2. Dextran
- 8.1.2. Synthetic-based
- 8.1.2.1. Silica Gel
- 8.1.2.2. Aluminum Oxide
- 8.1.2.3. Polystyrene
- 8.1.2.4. Other Synthetic-based Resins
- 8.1.1. Natural-based
- 8.2. Market Analysis, Insights and Forecast - by Technology
- 8.2.1. Ion Exchange Chromatography Resins
- 8.2.2. Affinity Chromatography Resins
- 8.2.3. Size Exclusion Chromatography Resins
- 8.2.4. Hydrophobic Interaction Chromatography Resins
- 8.2.5. Other Technologies
- 8.3. Market Analysis, Insights and Forecast - by End-user Industry
- 8.3.1. Pharmaceuticals
- 8.3.1.1. Biotechnology
- 8.3.1.2. Drug Discovery
- 8.3.1.3. Drug Production
- 8.3.2. Water and Environmental Agencies
- 8.3.3. Food and Beverages
- 8.3.4. Other End-user Industries
- 8.3.1. Pharmaceuticals
- 8.4. Market Analysis, Insights and Forecast - by Geography
- 8.4.1. China
- 8.4.2. India
- 8.4.3. Japan
- 8.4.4. Rest of Asia-Pacific
- 8.1. Market Analysis, Insights and Forecast - by Origin
- 9. Japan Asia Pacific Chromatography Resins Industry Analysis, Insights and Forecast, 2020-2032
- 9.1. Market Analysis, Insights and Forecast - by Origin
- 9.1.1. Natural-based
- 9.1.1.1. Agarose
- 9.1.1.2. Dextran
- 9.1.2. Synthetic-based
- 9.1.2.1. Silica Gel
- 9.1.2.2. Aluminum Oxide
- 9.1.2.3. Polystyrene
- 9.1.2.4. Other Synthetic-based Resins
- 9.1.1. Natural-based
- 9.2. Market Analysis, Insights and Forecast - by Technology
- 9.2.1. Ion Exchange Chromatography Resins
- 9.2.2. Affinity Chromatography Resins
- 9.2.3. Size Exclusion Chromatography Resins
- 9.2.4. Hydrophobic Interaction Chromatography Resins
- 9.2.5. Other Technologies
- 9.3. Market Analysis, Insights and Forecast - by End-user Industry
- 9.3.1. Pharmaceuticals
- 9.3.1.1. Biotechnology
- 9.3.1.2. Drug Discovery
- 9.3.1.3. Drug Production
- 9.3.2. Water and Environmental Agencies
- 9.3.3. Food and Beverages
- 9.3.4. Other End-user Industries
- 9.3.1. Pharmaceuticals
- 9.4. Market Analysis, Insights and Forecast - by Geography
- 9.4.1. China
- 9.4.2. India
- 9.4.3. Japan
- 9.4.4. Rest of Asia-Pacific
- 9.1. Market Analysis, Insights and Forecast - by Origin
- 10. Rest of Asia Pacific Asia Pacific Chromatography Resins Industry Analysis, Insights and Forecast, 2020-2032
- 10.1. Market Analysis, Insights and Forecast - by Origin
- 10.1.1. Natural-based
- 10.1.1.1. Agarose
- 10.1.1.2. Dextran
- 10.1.2. Synthetic-based
- 10.1.2.1. Silica Gel
- 10.1.2.2. Aluminum Oxide
- 10.1.2.3. Polystyrene
- 10.1.2.4. Other Synthetic-based Resins
- 10.1.1. Natural-based
- 10.2. Market Analysis, Insights and Forecast - by Technology
- 10.2.1. Ion Exchange Chromatography Resins
- 10.2.2. Affinity Chromatography Resins
- 10.2.3. Size Exclusion Chromatography Resins
- 10.2.4. Hydrophobic Interaction Chromatography Resins
- 10.2.5. Other Technologies
- 10.3. Market Analysis, Insights and Forecast - by End-user Industry
- 10.3.1. Pharmaceuticals
- 10.3.1.1. Biotechnology
- 10.3.1.2. Drug Discovery
- 10.3.1.3. Drug Production
- 10.3.2. Water and Environmental Agencies
- 10.3.3. Food and Beverages
- 10.3.4. Other End-user Industries
- 10.3.1. Pharmaceuticals
- 10.4. Market Analysis, Insights and Forecast - by Geography
- 10.4.1. China
- 10.4.2. India
- 10.4.3. Japan
- 10.4.4. Rest of Asia-Pacific
- 10.1. Market Analysis, Insights and Forecast - by Origin
- 11. Competitive Analysis
- 11.1. Company Profiles
- 11.1.1 General Electric
- 11.1.1.1. Company Overview
- 11.1.1.2. Products
- 11.1.1.3. Company Financials
- 11.1.1.4. SWOT Analysis
- 11.1.2 Bio-Rad Laboratories Inc
- 11.1.2.1. Company Overview
- 11.1.2.2. Products
- 11.1.2.3. Company Financials
- 11.1.2.4. SWOT Analysis
- 11.1.3 Merck KGaA
- 11.1.3.1. Company Overview
- 11.1.3.2. Products
- 11.1.3.3. Company Financials
- 11.1.3.4. SWOT Analysis
- 11.1.4 Mitsubishi Chemical Corporation
- 11.1.4.1. Company Overview
- 11.1.4.2. Products
- 11.1.4.3. Company Financials
- 11.1.4.4. SWOT Analysis
- 11.1.5 Dupont
- 11.1.5.1. Company Overview
- 11.1.5.2. Products
- 11.1.5.3. Company Financials
- 11.1.5.4. SWOT Analysis
- 11.1.6 Pall Corporation
- 11.1.6.1. Company Overview
- 11.1.6.2. Products
- 11.1.6.3. Company Financials
- 11.1.6.4. SWOT Analysis
- 11.1.7 Tosoh Bioscience LLC*List Not Exhaustive
- 11.1.7.1. Company Overview
- 11.1.7.2. Products
- 11.1.7.3. Company Financials
- 11.1.7.4. SWOT Analysis
- 11.1.8 Purolite
- 11.1.8.1. Company Overview
- 11.1.8.2. Products
- 11.1.8.3. Company Financials
- 11.1.8.4. SWOT Analysis
- 11.1.9 Agilient Technologies
- 11.1.9.1. Company Overview
- 11.1.9.2. Products
- 11.1.9.3. Company Financials
- 11.1.9.4. SWOT Analysis
- 11.1.10 Avantor Inc
- 11.1.10.1. Company Overview
- 11.1.10.2. Products
- 11.1.10.3. Company Financials
- 11.1.10.4. SWOT Analysis
- 11.1.11 Thermo Fisher Scientific
- 11.1.11.1. Company Overview
- 11.1.11.2. Products
- 11.1.11.3. Company Financials
- 11.1.11.4. SWOT Analysis
- 11.1.1 General Electric
- 11.2. Market Entropy
- 11.2.1 Company's Key Areas Served
- 11.2.2 Recent Developments
- 11.3. Company Market Share Analysis 2025
- 11.3.1 Top 5 Companies Market Share Analysis
- 11.3.2 Top 3 Companies Market Share Analysis
- 11.4. List of Potential Customers
- 12. Research Methodology
List of Figures
- Figure 1: Asia Pacific Chromatography Resins Industry Revenue Breakdown (Million, %) by Product 2025 & 2033
- Figure 2: Asia Pacific Chromatography Resins Industry Share (%) by Company 2025
List of Tables
- Table 1: Asia Pacific Chromatography Resins Industry Revenue Million Forecast, by Origin 2020 & 2033
- Table 2: Asia Pacific Chromatography Resins Industry Volume K Tons Forecast, by Origin 2020 & 2033
- Table 3: Asia Pacific Chromatography Resins Industry Revenue Million Forecast, by Technology 2020 & 2033
- Table 4: Asia Pacific Chromatography Resins Industry Volume K Tons Forecast, by Technology 2020 & 2033
- Table 5: Asia Pacific Chromatography Resins Industry Revenue Million Forecast, by End-user Industry 2020 & 2033
- Table 6: Asia Pacific Chromatography Resins Industry Volume K Tons Forecast, by End-user Industry 2020 & 2033
- Table 7: Asia Pacific Chromatography Resins Industry Revenue Million Forecast, by Geography 2020 & 2033
- Table 8: Asia Pacific Chromatography Resins Industry Volume K Tons Forecast, by Geography 2020 & 2033
- Table 9: Asia Pacific Chromatography Resins Industry Revenue Million Forecast, by Region 2020 & 2033
- Table 10: Asia Pacific Chromatography Resins Industry Volume K Tons Forecast, by Region 2020 & 2033
- Table 11: Asia Pacific Chromatography Resins Industry Revenue Million Forecast, by Origin 2020 & 2033
- Table 12: Asia Pacific Chromatography Resins Industry Volume K Tons Forecast, by Origin 2020 & 2033
- Table 13: Asia Pacific Chromatography Resins Industry Revenue Million Forecast, by Technology 2020 & 2033
- Table 14: Asia Pacific Chromatography Resins Industry Volume K Tons Forecast, by Technology 2020 & 2033
- Table 15: Asia Pacific Chromatography Resins Industry Revenue Million Forecast, by End-user Industry 2020 & 2033
- Table 16: Asia Pacific Chromatography Resins Industry Volume K Tons Forecast, by End-user Industry 2020 & 2033
- Table 17: Asia Pacific Chromatography Resins Industry Revenue Million Forecast, by Geography 2020 & 2033
- Table 18: Asia Pacific Chromatography Resins Industry Volume K Tons Forecast, by Geography 2020 & 2033
- Table 19: Asia Pacific Chromatography Resins Industry Revenue Million Forecast, by Country 2020 & 2033
- Table 20: Asia Pacific Chromatography Resins Industry Volume K Tons Forecast, by Country 2020 & 2033
- Table 21: Asia Pacific Chromatography Resins Industry Revenue Million Forecast, by Origin 2020 & 2033
- Table 22: Asia Pacific Chromatography Resins Industry Volume K Tons Forecast, by Origin 2020 & 2033
- Table 23: Asia Pacific Chromatography Resins Industry Revenue Million Forecast, by Technology 2020 & 2033
- Table 24: Asia Pacific Chromatography Resins Industry Volume K Tons Forecast, by Technology 2020 & 2033
- Table 25: Asia Pacific Chromatography Resins Industry Revenue Million Forecast, by End-user Industry 2020 & 2033
- Table 26: Asia Pacific Chromatography Resins Industry Volume K Tons Forecast, by End-user Industry 2020 & 2033
- Table 27: Asia Pacific Chromatography Resins Industry Revenue Million Forecast, by Geography 2020 & 2033
- Table 28: Asia Pacific Chromatography Resins Industry Volume K Tons Forecast, by Geography 2020 & 2033
- Table 29: Asia Pacific Chromatography Resins Industry Revenue Million Forecast, by Country 2020 & 2033
- Table 30: Asia Pacific Chromatography Resins Industry Volume K Tons Forecast, by Country 2020 & 2033
- Table 31: Asia Pacific Chromatography Resins Industry Revenue Million Forecast, by Origin 2020 & 2033
- Table 32: Asia Pacific Chromatography Resins Industry Volume K Tons Forecast, by Origin 2020 & 2033
- Table 33: Asia Pacific Chromatography Resins Industry Revenue Million Forecast, by Technology 2020 & 2033
- Table 34: Asia Pacific Chromatography Resins Industry Volume K Tons Forecast, by Technology 2020 & 2033
- Table 35: Asia Pacific Chromatography Resins Industry Revenue Million Forecast, by End-user Industry 2020 & 2033
- Table 36: Asia Pacific Chromatography Resins Industry Volume K Tons Forecast, by End-user Industry 2020 & 2033
- Table 37: Asia Pacific Chromatography Resins Industry Revenue Million Forecast, by Geography 2020 & 2033
- Table 38: Asia Pacific Chromatography Resins Industry Volume K Tons Forecast, by Geography 2020 & 2033
- Table 39: Asia Pacific Chromatography Resins Industry Revenue Million Forecast, by Country 2020 & 2033
- Table 40: Asia Pacific Chromatography Resins Industry Volume K Tons Forecast, by Country 2020 & 2033
- Table 41: Asia Pacific Chromatography Resins Industry Revenue Million Forecast, by Origin 2020 & 2033
- Table 42: Asia Pacific Chromatography Resins Industry Volume K Tons Forecast, by Origin 2020 & 2033
- Table 43: Asia Pacific Chromatography Resins Industry Revenue Million Forecast, by Technology 2020 & 2033
- Table 44: Asia Pacific Chromatography Resins Industry Volume K Tons Forecast, by Technology 2020 & 2033
- Table 45: Asia Pacific Chromatography Resins Industry Revenue Million Forecast, by End-user Industry 2020 & 2033
- Table 46: Asia Pacific Chromatography Resins Industry Volume K Tons Forecast, by End-user Industry 2020 & 2033
- Table 47: Asia Pacific Chromatography Resins Industry Revenue Million Forecast, by Geography 2020 & 2033
- Table 48: Asia Pacific Chromatography Resins Industry Volume K Tons Forecast, by Geography 2020 & 2033
- Table 49: Asia Pacific Chromatography Resins Industry Revenue Million Forecast, by Country 2020 & 2033
- Table 50: Asia Pacific Chromatography Resins Industry Volume K Tons Forecast, by Country 2020 & 2033
Frequently Asked Questions
1. What is the projected Compound Annual Growth Rate (CAGR) of the Asia Pacific Chromatography Resins Industry?
The projected CAGR is approximately > 7.00%.
2. Which companies are prominent players in the Asia Pacific Chromatography Resins Industry?
Key companies in the market include General Electric, Bio-Rad Laboratories Inc, Merck KGaA, Mitsubishi Chemical Corporation, Dupont, Pall Corporation, Tosoh Bioscience LLC*List Not Exhaustive, Purolite, Agilient Technologies, Avantor Inc, Thermo Fisher Scientific.
3. What are the main segments of the Asia Pacific Chromatography Resins Industry?
The market segments include Origin, Technology, End-user Industry, Geography.
4. Can you provide details about the market size?
The market size is estimated to be USD 646.7 Million as of 2022.
5. What are some drivers contributing to market growth?
; Rising Demand from the Pharmaceutical Sector; Technological Advancements in Chromatography Resins; Increasing Importance of Chromatography Tests in Drug Approvals.
6. What are the notable trends driving market growth?
Increasing Demand from Pharmaceutical Sector.
7. Are there any restraints impacting market growth?
; High Costs vs. Productivity of Chromatography Systems.
8. Can you provide examples of recent developments in the market?
N/A
9. What pricing options are available for accessing the report?
Pricing options include single-user, multi-user, and enterprise licenses priced at USD 4750, USD 5250, and USD 8750 respectively.
10. Is the market size provided in terms of value or volume?
The market size is provided in terms of value, measured in Million and volume, measured in K Tons.
11. Are there any specific market keywords associated with the report?
Yes, the market keyword associated with the report is "Asia Pacific Chromatography Resins Industry," which aids in identifying and referencing the specific market segment covered.
12. How do I determine which pricing option suits my needs best?
The pricing options vary based on user requirements and access needs. Individual users may opt for single-user licenses, while businesses requiring broader access may choose multi-user or enterprise licenses for cost-effective access to the report.
13. Are there any additional resources or data provided in the Asia Pacific Chromatography Resins Industry report?
While the report offers comprehensive insights, it's advisable to review the specific contents or supplementary materials provided to ascertain if additional resources or data are available.
14. How can I stay updated on further developments or reports in the Asia Pacific Chromatography Resins Industry?
To stay informed about further developments, trends, and reports in the Asia Pacific Chromatography Resins Industry, consider subscribing to industry newsletters, following relevant companies and organizations, or regularly checking reputable industry news sources and publications.
Methodology
Step 1 - Identification of Relevant Samples Size from Population Database


Step 2 - Approaches for Defining Global Market Size (Value, Volume* & Price*)

Note*: In applicable scenarios
Step 3 - Data Sources
Primary Research
- Web Analytics
- Survey Reports
- Research Institute
- Latest Research Reports
- Opinion Leaders
Secondary Research
- Annual Reports
- White Paper
- Latest Press Release
- Industry Association
- Paid Database
- Investor Presentations

Step 4 - Data Triangulation
Involves using different sources of information in order to increase the validity of a study
These sources are likely to be stakeholders in a program - participants, other researchers, program staff, other community members, and so on.
Then we put all data in single framework & apply various statistical tools to find out the dynamic on the market.
During the analysis stage, feedback from the stakeholder groups would be compared to determine areas of agreement as well as areas of divergence