


Key Insights
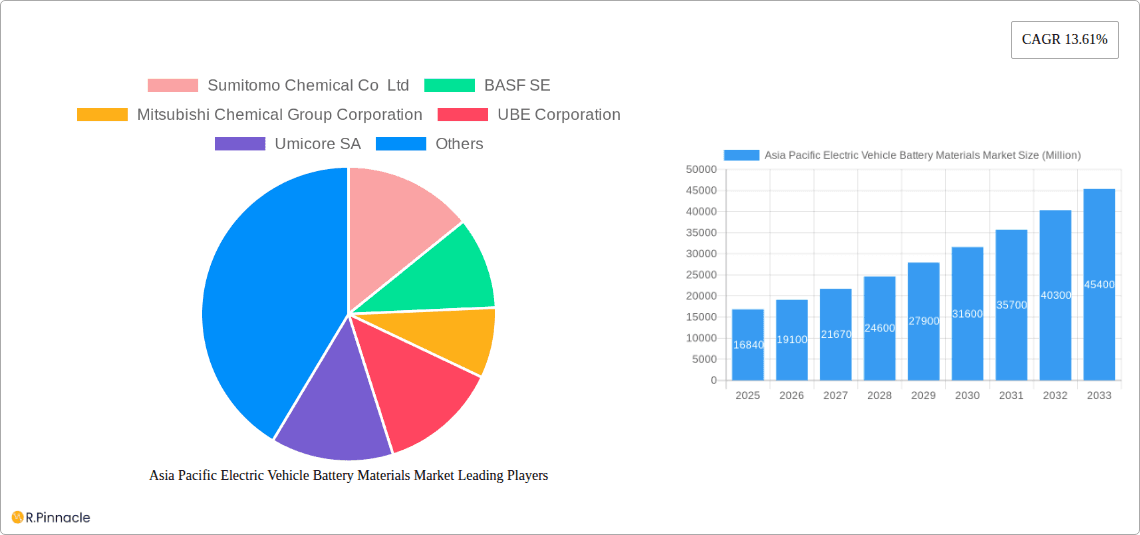
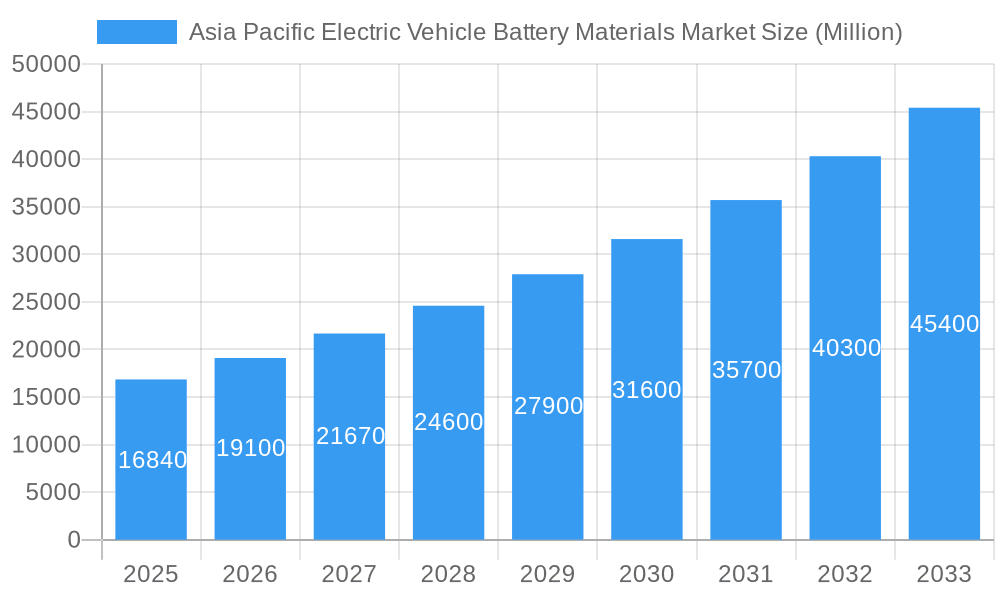
The Asia Pacific Electric Vehicle Battery Materials market is experiencing robust growth, projected to reach \$16.84 billion in 2025 and maintain a Compound Annual Growth Rate (CAGR) of 13.61% from 2025 to 2033. This surge is driven primarily by the burgeoning electric vehicle (EV) adoption across the region, fueled by supportive government policies promoting sustainable transportation and increasing consumer demand for eco-friendly vehicles. Key growth drivers include advancements in battery technology leading to higher energy density and longer lifespan, alongside decreasing battery production costs making EVs more affordable and accessible. Furthermore, significant investments in research and development are fostering innovation within the battery materials sector, leading to the emergence of more efficient and sustainable materials. This competitive landscape features major players such as Sumitomo Chemical, BASF, Mitsubishi Chemical, and LG Chem, all vying for market share through strategic partnerships, capacity expansions, and technological advancements. However, challenges remain, including the supply chain complexities associated with sourcing raw materials, potential price volatility of critical minerals, and environmental concerns related to battery manufacturing and disposal.
Asia Pacific Electric Vehicle Battery Materials Market Market Size (In Billion)

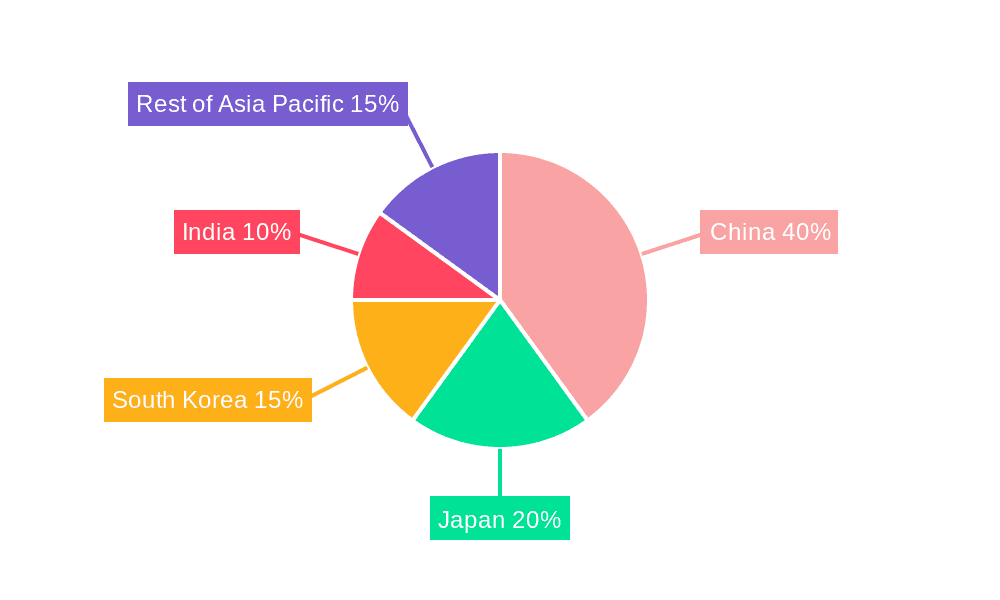
The market segmentation within the Asia Pacific region is likely diverse, with variations in demand across countries based on their respective EV adoption rates and government incentives. China, Japan, South Korea, and India are expected to be major contributors to market growth, given their substantial EV markets and robust manufacturing capabilities. The forecast period (2025-2033) anticipates continued strong growth, driven by the ongoing expansion of the EV industry, the development of next-generation battery technologies, and the increasing focus on sustainable energy solutions. Competition will intensify as existing players and new entrants strive for dominance, leading to further innovation and improved cost-efficiency in the production of electric vehicle battery materials. Companies are likely focusing on vertical integration, securing supply chains, and developing innovative battery chemistries to maintain a competitive edge.
Asia Pacific Electric Vehicle Battery Materials Market Company Market Share
Asia Pacific Electric Vehicle Battery Materials Market Report: 2019-2033
This comprehensive report provides an in-depth analysis of the Asia Pacific Electric Vehicle Battery Materials market, offering crucial insights for industry professionals, investors, and strategic decision-makers. Covering the period 2019-2033, with a focus on 2025, this report illuminates market dynamics, competitive landscapes, and future growth prospects. The study period (2019-2024) is analyzed alongside the forecast period (2025-2033), providing a holistic view of the market's trajectory.
Asia Pacific Electric Vehicle Battery Materials Market Structure & Innovation Trends
This section analyzes the market structure, identifying key trends shaping the industry's evolution. We examine market concentration, revealing the dominance of key players such as Sumitomo Chemical Co Ltd, BASF SE, Mitsubishi Chemical Group Corporation, UBE Corporation, Umicore SA, Contemporary Amperex Technology Co Limited, Nichia Corporation, ENTEK International LLC, LG Chem, and Kureha Corporation, among others. The report delves into innovation drivers, including technological advancements in battery chemistry and manufacturing processes. Regulatory frameworks impacting the market, alongside the role of product substitutes and end-user demographics, are comprehensively assessed. Furthermore, a detailed analysis of M&A activities, including deal values and their impact on market share, completes this section. We explore the market concentration ratio, estimating the combined market share of the top 5 players to be approximately xx%. Several significant M&A deals, valued at a total of approximately xx Million, have reshaped the competitive landscape in recent years.
Asia Pacific Electric Vehicle Battery Materials Market Dynamics & Trends
This section examines the market's growth drivers, technological disruptions, evolving consumer preferences, and competitive dynamics. We analyze the Compound Annual Growth Rate (CAGR) for the forecast period, projecting a CAGR of xx% for the Asia Pacific Electric Vehicle Battery Materials market. Market penetration rates for various battery materials are also examined, revealing significant growth opportunities in specific segments. Technological disruptions, such as advancements in solid-state batteries and improved energy density, are assessed for their impact on market growth. The report also addresses evolving consumer preferences, such as the demand for longer-lasting and safer batteries, and their influence on market dynamics.
Dominant Regions & Segments in Asia Pacific Electric Vehicle Battery Materials Market
This section identifies the leading regions and segments within the Asia Pacific market. Detailed analysis highlights the dominance of specific countries or regions due to factors such as robust government support, favorable economic policies, and well-developed infrastructure for EV manufacturing.
- Key Drivers in Dominant Regions:
- Favorable government incentives and subsidies for EV adoption.
- Growing investment in charging infrastructure and battery recycling facilities.
- Increasing consumer awareness and demand for electric vehicles.
- Expansion of domestic EV manufacturing capacity.
The dominance analysis incorporates factors like market size, growth rate, and competitive intensity. Specific regional market sizes are projected, with [Country X] expected to lead with a market size of approximately xx Million by 2033.
Asia Pacific Electric Vehicle Battery Materials Market Product Innovations
This section summarizes recent product developments and their competitive advantages. The report highlights technological advancements that enhance battery performance, including increased energy density, improved safety features, and extended lifespan. The analysis emphasizes the market fit of new product innovations and their potential to disrupt the market. Examples include advancements in cathode materials, such as nickel-rich NMC, and anode materials, such as silicon-based anodes, which are gaining traction.
Report Scope & Segmentation Analysis
This report segments the Asia Pacific Electric Vehicle Battery Materials market based on material type (e.g., cathode materials, anode materials, electrolytes), battery type (e.g., lithium-ion, solid-state), vehicle type (e.g., passenger cars, commercial vehicles), and end-use application. Each segment's growth projections, market sizes, and competitive dynamics are provided. For example, the lithium-ion battery segment is projected to hold a significant market share, with a value of xx Million by 2033, driven by its current dominance in the EV market. However, the solid-state battery segment is expected to witness significant growth due to its potential for higher energy density and safety.
Key Drivers of Asia Pacific Electric Vehicle Battery Materials Market Growth
Several key factors drive the growth of the Asia Pacific Electric Vehicle Battery Materials market. These include:
- Technological advancements: Continuous improvements in battery technology, leading to higher energy density, longer lifespan, and improved safety.
- Government regulations and incentives: Stringent emission regulations and substantial government subsidies promoting EV adoption.
- Increasing electric vehicle sales: Rapid growth in the sales of electric vehicles across the Asia-Pacific region.
- Expanding charging infrastructure: The development of a robust charging infrastructure supports the wider adoption of EVs.
These factors collectively contribute to substantial market growth.
Challenges in the Asia Pacific Electric Vehicle Battery Materials Market Sector
The Asia Pacific Electric Vehicle Battery Materials market faces several challenges:
- Supply chain disruptions: Geopolitical instability and resource scarcity can disrupt the supply chain, impacting material availability and costs.
- Raw material price volatility: Fluctuations in the prices of crucial raw materials, such as lithium, cobalt, and nickel, affect production costs.
- Environmental concerns: The environmental impact of battery production and disposal necessitates sustainable practices and recycling solutions.
- Stringent safety regulations: Stricter safety standards and regulations increase production costs and complexity. These challenges pose significant barriers to market growth.
Emerging Opportunities in Asia Pacific Electric Vehicle Battery Materials Market
Despite challenges, several promising opportunities exist:
- Development of next-generation batteries: Advancements in solid-state and other next-generation battery technologies offer significant potential.
- Growth in the commercial vehicle segment: Increasing demand for electric commercial vehicles presents a lucrative market segment.
- Focus on battery recycling and sustainability: The growing emphasis on environmental sustainability opens opportunities in battery recycling and reuse.
- Expansion into new markets: Untapped markets in emerging economies offer considerable potential for expansion. These opportunities promise significant market growth.
Leading Players in the Asia Pacific Electric Vehicle Battery Materials Market
- Sumitomo Chemical Co Ltd
- BASF SE
- Mitsubishi Chemical Group Corporation
- UBE Corporation
- Umicore SA
- Contemporary Amperex Technology Co Limited
- Nichia Corporation
- ENTEK International LLC
- LG Chem
- Kureha Corporation
- List Not Exhaustive
Key Developments in Asia Pacific Electric Vehicle Battery Materials Industry
- November 2023: SK On Co. and BASF SE collaborated to develop advanced battery materials for North America and the Asia-Pacific, aiming to enhance long-term competitiveness.
- June 2023: Japanese researchers developed a rechargeable all-solid-state air battery, showcasing a significant technological advancement.
Future Outlook for Asia Pacific Electric Vehicle Battery Materials Market
The Asia Pacific Electric Vehicle Battery Materials market exhibits strong growth potential, driven by increasing EV adoption, technological advancements, and supportive government policies. Strategic investments in research and development, coupled with sustainable sourcing and recycling initiatives, will be crucial for sustained market growth and long-term success in this dynamic sector. The market is expected to reach xx Million by 2033, presenting lucrative opportunities for industry players.
Asia Pacific Electric Vehicle Battery Materials Market Segmentation
-
1. Battery Type
- 1.1. Lithium-ion Battery
- 1.2. Lead-Acid Battery
- 1.3. Others
-
2. Material
- 2.1. Cathode
- 2.2. Anode
- 2.3. Electrolyte
- 2.4. Separator
- 2.5. Others
-
3. Geography
- 3.1. China
- 3.2. India
- 3.3. Australia
- 3.4. Japan
- 3.5. South Korea
- 3.6. Malaysia
- 3.7. Thailand
- 3.8. Indonesia
- 3.9. Vietnam
- 3.10. Rest of Asia-Pacific
Asia Pacific Electric Vehicle Battery Materials Market Segmentation By Geography
- 1. China
- 2. India
- 3. Australia
- 4. Japan
- 5. South Korea
- 6. Malaysia
- 7. Thailand
- 8. Indonesia
- 9. Vietnam
- 10. Rest of Asia Pacific
Asia Pacific Electric Vehicle Battery Materials Market Regional Market Share
Geographic Coverage of Asia Pacific Electric Vehicle Battery Materials Market
Asia Pacific Electric Vehicle Battery Materials Market REPORT HIGHLIGHTS
| Aspects | Details |
|---|---|
| Study Period | 2020-2034 |
| Base Year | 2025 |
| Estimated Year | 2026 |
| Forecast Period | 2026-2034 |
| Historical Period | 2020-2025 |
| Growth Rate | CAGR of 13.61% from 2020-2034 |
| Segmentation |
|
Table of Contents
- 1. Introduction
- 1.1. Research Scope
- 1.2. Market Segmentation
- 1.3. Research Methodology
- 1.4. Definitions and Assumptions
- 2. Executive Summary
- 2.1. Introduction
- 3. Market Dynamics
- 3.1. Introduction
- 3.2. Market Drivers
- 3.2.1. 4.; Growing Electric Vehicle Sales4.; Supportive Government Policies and Regulations
- 3.3. Market Restrains
- 3.3.1. 4.; Growing Electric Vehicle Sales4.; Supportive Government Policies and Regulations
- 3.4. Market Trends
- 3.4.1. Lithium-Ion Battery Type Dominate the Market
- 4. Market Factor Analysis
- 4.1. Porters Five Forces
- 4.2. Supply/Value Chain
- 4.3. PESTEL analysis
- 4.4. Market Entropy
- 4.5. Patent/Trademark Analysis
- 5. Global Asia Pacific Electric Vehicle Battery Materials Market Analysis, Insights and Forecast, 2020-2032
- 5.1. Market Analysis, Insights and Forecast - by Battery Type
- 5.1.1. Lithium-ion Battery
- 5.1.2. Lead-Acid Battery
- 5.1.3. Others
- 5.2. Market Analysis, Insights and Forecast - by Material
- 5.2.1. Cathode
- 5.2.2. Anode
- 5.2.3. Electrolyte
- 5.2.4. Separator
- 5.2.5. Others
- 5.3. Market Analysis, Insights and Forecast - by Geography
- 5.3.1. China
- 5.3.2. India
- 5.3.3. Australia
- 5.3.4. Japan
- 5.3.5. South Korea
- 5.3.6. Malaysia
- 5.3.7. Thailand
- 5.3.8. Indonesia
- 5.3.9. Vietnam
- 5.3.10. Rest of Asia-Pacific
- 5.4. Market Analysis, Insights and Forecast - by Region
- 5.4.1. China
- 5.4.2. India
- 5.4.3. Australia
- 5.4.4. Japan
- 5.4.5. South Korea
- 5.4.6. Malaysia
- 5.4.7. Thailand
- 5.4.8. Indonesia
- 5.4.9. Vietnam
- 5.4.10. Rest of Asia Pacific
- 5.1. Market Analysis, Insights and Forecast - by Battery Type
- 6. China Asia Pacific Electric Vehicle Battery Materials Market Analysis, Insights and Forecast, 2020-2032
- 6.1. Market Analysis, Insights and Forecast - by Battery Type
- 6.1.1. Lithium-ion Battery
- 6.1.2. Lead-Acid Battery
- 6.1.3. Others
- 6.2. Market Analysis, Insights and Forecast - by Material
- 6.2.1. Cathode
- 6.2.2. Anode
- 6.2.3. Electrolyte
- 6.2.4. Separator
- 6.2.5. Others
- 6.3. Market Analysis, Insights and Forecast - by Geography
- 6.3.1. China
- 6.3.2. India
- 6.3.3. Australia
- 6.3.4. Japan
- 6.3.5. South Korea
- 6.3.6. Malaysia
- 6.3.7. Thailand
- 6.3.8. Indonesia
- 6.3.9. Vietnam
- 6.3.10. Rest of Asia-Pacific
- 6.1. Market Analysis, Insights and Forecast - by Battery Type
- 7. India Asia Pacific Electric Vehicle Battery Materials Market Analysis, Insights and Forecast, 2020-2032
- 7.1. Market Analysis, Insights and Forecast - by Battery Type
- 7.1.1. Lithium-ion Battery
- 7.1.2. Lead-Acid Battery
- 7.1.3. Others
- 7.2. Market Analysis, Insights and Forecast - by Material
- 7.2.1. Cathode
- 7.2.2. Anode
- 7.2.3. Electrolyte
- 7.2.4. Separator
- 7.2.5. Others
- 7.3. Market Analysis, Insights and Forecast - by Geography
- 7.3.1. China
- 7.3.2. India
- 7.3.3. Australia
- 7.3.4. Japan
- 7.3.5. South Korea
- 7.3.6. Malaysia
- 7.3.7. Thailand
- 7.3.8. Indonesia
- 7.3.9. Vietnam
- 7.3.10. Rest of Asia-Pacific
- 7.1. Market Analysis, Insights and Forecast - by Battery Type
- 8. Australia Asia Pacific Electric Vehicle Battery Materials Market Analysis, Insights and Forecast, 2020-2032
- 8.1. Market Analysis, Insights and Forecast - by Battery Type
- 8.1.1. Lithium-ion Battery
- 8.1.2. Lead-Acid Battery
- 8.1.3. Others
- 8.2. Market Analysis, Insights and Forecast - by Material
- 8.2.1. Cathode
- 8.2.2. Anode
- 8.2.3. Electrolyte
- 8.2.4. Separator
- 8.2.5. Others
- 8.3. Market Analysis, Insights and Forecast - by Geography
- 8.3.1. China
- 8.3.2. India
- 8.3.3. Australia
- 8.3.4. Japan
- 8.3.5. South Korea
- 8.3.6. Malaysia
- 8.3.7. Thailand
- 8.3.8. Indonesia
- 8.3.9. Vietnam
- 8.3.10. Rest of Asia-Pacific
- 8.1. Market Analysis, Insights and Forecast - by Battery Type
- 9. Japan Asia Pacific Electric Vehicle Battery Materials Market Analysis, Insights and Forecast, 2020-2032
- 9.1. Market Analysis, Insights and Forecast - by Battery Type
- 9.1.1. Lithium-ion Battery
- 9.1.2. Lead-Acid Battery
- 9.1.3. Others
- 9.2. Market Analysis, Insights and Forecast - by Material
- 9.2.1. Cathode
- 9.2.2. Anode
- 9.2.3. Electrolyte
- 9.2.4. Separator
- 9.2.5. Others
- 9.3. Market Analysis, Insights and Forecast - by Geography
- 9.3.1. China
- 9.3.2. India
- 9.3.3. Australia
- 9.3.4. Japan
- 9.3.5. South Korea
- 9.3.6. Malaysia
- 9.3.7. Thailand
- 9.3.8. Indonesia
- 9.3.9. Vietnam
- 9.3.10. Rest of Asia-Pacific
- 9.1. Market Analysis, Insights and Forecast - by Battery Type
- 10. South Korea Asia Pacific Electric Vehicle Battery Materials Market Analysis, Insights and Forecast, 2020-2032
- 10.1. Market Analysis, Insights and Forecast - by Battery Type
- 10.1.1. Lithium-ion Battery
- 10.1.2. Lead-Acid Battery
- 10.1.3. Others
- 10.2. Market Analysis, Insights and Forecast - by Material
- 10.2.1. Cathode
- 10.2.2. Anode
- 10.2.3. Electrolyte
- 10.2.4. Separator
- 10.2.5. Others
- 10.3. Market Analysis, Insights and Forecast - by Geography
- 10.3.1. China
- 10.3.2. India
- 10.3.3. Australia
- 10.3.4. Japan
- 10.3.5. South Korea
- 10.3.6. Malaysia
- 10.3.7. Thailand
- 10.3.8. Indonesia
- 10.3.9. Vietnam
- 10.3.10. Rest of Asia-Pacific
- 10.1. Market Analysis, Insights and Forecast - by Battery Type
- 11. Malaysia Asia Pacific Electric Vehicle Battery Materials Market Analysis, Insights and Forecast, 2020-2032
- 11.1. Market Analysis, Insights and Forecast - by Battery Type
- 11.1.1. Lithium-ion Battery
- 11.1.2. Lead-Acid Battery
- 11.1.3. Others
- 11.2. Market Analysis, Insights and Forecast - by Material
- 11.2.1. Cathode
- 11.2.2. Anode
- 11.2.3. Electrolyte
- 11.2.4. Separator
- 11.2.5. Others
- 11.3. Market Analysis, Insights and Forecast - by Geography
- 11.3.1. China
- 11.3.2. India
- 11.3.3. Australia
- 11.3.4. Japan
- 11.3.5. South Korea
- 11.3.6. Malaysia
- 11.3.7. Thailand
- 11.3.8. Indonesia
- 11.3.9. Vietnam
- 11.3.10. Rest of Asia-Pacific
- 11.1. Market Analysis, Insights and Forecast - by Battery Type
- 12. Thailand Asia Pacific Electric Vehicle Battery Materials Market Analysis, Insights and Forecast, 2020-2032
- 12.1. Market Analysis, Insights and Forecast - by Battery Type
- 12.1.1. Lithium-ion Battery
- 12.1.2. Lead-Acid Battery
- 12.1.3. Others
- 12.2. Market Analysis, Insights and Forecast - by Material
- 12.2.1. Cathode
- 12.2.2. Anode
- 12.2.3. Electrolyte
- 12.2.4. Separator
- 12.2.5. Others
- 12.3. Market Analysis, Insights and Forecast - by Geography
- 12.3.1. China
- 12.3.2. India
- 12.3.3. Australia
- 12.3.4. Japan
- 12.3.5. South Korea
- 12.3.6. Malaysia
- 12.3.7. Thailand
- 12.3.8. Indonesia
- 12.3.9. Vietnam
- 12.3.10. Rest of Asia-Pacific
- 12.1. Market Analysis, Insights and Forecast - by Battery Type
- 13. Indonesia Asia Pacific Electric Vehicle Battery Materials Market Analysis, Insights and Forecast, 2020-2032
- 13.1. Market Analysis, Insights and Forecast - by Battery Type
- 13.1.1. Lithium-ion Battery
- 13.1.2. Lead-Acid Battery
- 13.1.3. Others
- 13.2. Market Analysis, Insights and Forecast - by Material
- 13.2.1. Cathode
- 13.2.2. Anode
- 13.2.3. Electrolyte
- 13.2.4. Separator
- 13.2.5. Others
- 13.3. Market Analysis, Insights and Forecast - by Geography
- 13.3.1. China
- 13.3.2. India
- 13.3.3. Australia
- 13.3.4. Japan
- 13.3.5. South Korea
- 13.3.6. Malaysia
- 13.3.7. Thailand
- 13.3.8. Indonesia
- 13.3.9. Vietnam
- 13.3.10. Rest of Asia-Pacific
- 13.1. Market Analysis, Insights and Forecast - by Battery Type
- 14. Vietnam Asia Pacific Electric Vehicle Battery Materials Market Analysis, Insights and Forecast, 2020-2032
- 14.1. Market Analysis, Insights and Forecast - by Battery Type
- 14.1.1. Lithium-ion Battery
- 14.1.2. Lead-Acid Battery
- 14.1.3. Others
- 14.2. Market Analysis, Insights and Forecast - by Material
- 14.2.1. Cathode
- 14.2.2. Anode
- 14.2.3. Electrolyte
- 14.2.4. Separator
- 14.2.5. Others
- 14.3. Market Analysis, Insights and Forecast - by Geography
- 14.3.1. China
- 14.3.2. India
- 14.3.3. Australia
- 14.3.4. Japan
- 14.3.5. South Korea
- 14.3.6. Malaysia
- 14.3.7. Thailand
- 14.3.8. Indonesia
- 14.3.9. Vietnam
- 14.3.10. Rest of Asia-Pacific
- 14.1. Market Analysis, Insights and Forecast - by Battery Type
- 15. Rest of Asia Pacific Asia Pacific Electric Vehicle Battery Materials Market Analysis, Insights and Forecast, 2020-2032
- 15.1. Market Analysis, Insights and Forecast - by Battery Type
- 15.1.1. Lithium-ion Battery
- 15.1.2. Lead-Acid Battery
- 15.1.3. Others
- 15.2. Market Analysis, Insights and Forecast - by Material
- 15.2.1. Cathode
- 15.2.2. Anode
- 15.2.3. Electrolyte
- 15.2.4. Separator
- 15.2.5. Others
- 15.3. Market Analysis, Insights and Forecast - by Geography
- 15.3.1. China
- 15.3.2. India
- 15.3.3. Australia
- 15.3.4. Japan
- 15.3.5. South Korea
- 15.3.6. Malaysia
- 15.3.7. Thailand
- 15.3.8. Indonesia
- 15.3.9. Vietnam
- 15.3.10. Rest of Asia-Pacific
- 15.1. Market Analysis, Insights and Forecast - by Battery Type
- 16. Competitive Analysis
- 16.1. Global Market Share Analysis 2025
- 16.2. Company Profiles
- 16.2.1 Sumitomo Chemical Co Ltd
- 16.2.1.1. Overview
- 16.2.1.2. Products
- 16.2.1.3. SWOT Analysis
- 16.2.1.4. Recent Developments
- 16.2.1.5. Financials (Based on Availability)
- 16.2.2 BASF SE
- 16.2.2.1. Overview
- 16.2.2.2. Products
- 16.2.2.3. SWOT Analysis
- 16.2.2.4. Recent Developments
- 16.2.2.5. Financials (Based on Availability)
- 16.2.3 Mitsubishi Chemical Group Corporation
- 16.2.3.1. Overview
- 16.2.3.2. Products
- 16.2.3.3. SWOT Analysis
- 16.2.3.4. Recent Developments
- 16.2.3.5. Financials (Based on Availability)
- 16.2.4 UBE Corporation
- 16.2.4.1. Overview
- 16.2.4.2. Products
- 16.2.4.3. SWOT Analysis
- 16.2.4.4. Recent Developments
- 16.2.4.5. Financials (Based on Availability)
- 16.2.5 Umicore SA
- 16.2.5.1. Overview
- 16.2.5.2. Products
- 16.2.5.3. SWOT Analysis
- 16.2.5.4. Recent Developments
- 16.2.5.5. Financials (Based on Availability)
- 16.2.6 Contemporary Amperex Technology Co Limited
- 16.2.6.1. Overview
- 16.2.6.2. Products
- 16.2.6.3. SWOT Analysis
- 16.2.6.4. Recent Developments
- 16.2.6.5. Financials (Based on Availability)
- 16.2.7 Nichia Corporation
- 16.2.7.1. Overview
- 16.2.7.2. Products
- 16.2.7.3. SWOT Analysis
- 16.2.7.4. Recent Developments
- 16.2.7.5. Financials (Based on Availability)
- 16.2.8 ENTEK International LLC
- 16.2.8.1. Overview
- 16.2.8.2. Products
- 16.2.8.3. SWOT Analysis
- 16.2.8.4. Recent Developments
- 16.2.8.5. Financials (Based on Availability)
- 16.2.9 LG Chem
- 16.2.9.1. Overview
- 16.2.9.2. Products
- 16.2.9.3. SWOT Analysis
- 16.2.9.4. Recent Developments
- 16.2.9.5. Financials (Based on Availability)
- 16.2.10 Kureha Corporation*List Not Exhaustive 6 4 List of Other Prominent Companies6 5 Market Ranking/ Share Analysi
- 16.2.10.1. Overview
- 16.2.10.2. Products
- 16.2.10.3. SWOT Analysis
- 16.2.10.4. Recent Developments
- 16.2.10.5. Financials (Based on Availability)
- 16.2.1 Sumitomo Chemical Co Ltd
List of Figures
- Figure 1: Global Asia Pacific Electric Vehicle Battery Materials Market Revenue Breakdown (Million, %) by Region 2025 & 2033
- Figure 2: Global Asia Pacific Electric Vehicle Battery Materials Market Volume Breakdown (Billion, %) by Region 2025 & 2033
- Figure 3: China Asia Pacific Electric Vehicle Battery Materials Market Revenue (Million), by Battery Type 2025 & 2033
- Figure 4: China Asia Pacific Electric Vehicle Battery Materials Market Volume (Billion), by Battery Type 2025 & 2033
- Figure 5: China Asia Pacific Electric Vehicle Battery Materials Market Revenue Share (%), by Battery Type 2025 & 2033
- Figure 6: China Asia Pacific Electric Vehicle Battery Materials Market Volume Share (%), by Battery Type 2025 & 2033
- Figure 7: China Asia Pacific Electric Vehicle Battery Materials Market Revenue (Million), by Material 2025 & 2033
- Figure 8: China Asia Pacific Electric Vehicle Battery Materials Market Volume (Billion), by Material 2025 & 2033
- Figure 9: China Asia Pacific Electric Vehicle Battery Materials Market Revenue Share (%), by Material 2025 & 2033
- Figure 10: China Asia Pacific Electric Vehicle Battery Materials Market Volume Share (%), by Material 2025 & 2033
- Figure 11: China Asia Pacific Electric Vehicle Battery Materials Market Revenue (Million), by Geography 2025 & 2033
- Figure 12: China Asia Pacific Electric Vehicle Battery Materials Market Volume (Billion), by Geography 2025 & 2033
- Figure 13: China Asia Pacific Electric Vehicle Battery Materials Market Revenue Share (%), by Geography 2025 & 2033
- Figure 14: China Asia Pacific Electric Vehicle Battery Materials Market Volume Share (%), by Geography 2025 & 2033
- Figure 15: China Asia Pacific Electric Vehicle Battery Materials Market Revenue (Million), by Country 2025 & 2033
- Figure 16: China Asia Pacific Electric Vehicle Battery Materials Market Volume (Billion), by Country 2025 & 2033
- Figure 17: China Asia Pacific Electric Vehicle Battery Materials Market Revenue Share (%), by Country 2025 & 2033
- Figure 18: China Asia Pacific Electric Vehicle Battery Materials Market Volume Share (%), by Country 2025 & 2033
- Figure 19: India Asia Pacific Electric Vehicle Battery Materials Market Revenue (Million), by Battery Type 2025 & 2033
- Figure 20: India Asia Pacific Electric Vehicle Battery Materials Market Volume (Billion), by Battery Type 2025 & 2033
- Figure 21: India Asia Pacific Electric Vehicle Battery Materials Market Revenue Share (%), by Battery Type 2025 & 2033
- Figure 22: India Asia Pacific Electric Vehicle Battery Materials Market Volume Share (%), by Battery Type 2025 & 2033
- Figure 23: India Asia Pacific Electric Vehicle Battery Materials Market Revenue (Million), by Material 2025 & 2033
- Figure 24: India Asia Pacific Electric Vehicle Battery Materials Market Volume (Billion), by Material 2025 & 2033
- Figure 25: India Asia Pacific Electric Vehicle Battery Materials Market Revenue Share (%), by Material 2025 & 2033
- Figure 26: India Asia Pacific Electric Vehicle Battery Materials Market Volume Share (%), by Material 2025 & 2033
- Figure 27: India Asia Pacific Electric Vehicle Battery Materials Market Revenue (Million), by Geography 2025 & 2033
- Figure 28: India Asia Pacific Electric Vehicle Battery Materials Market Volume (Billion), by Geography 2025 & 2033
- Figure 29: India Asia Pacific Electric Vehicle Battery Materials Market Revenue Share (%), by Geography 2025 & 2033
- Figure 30: India Asia Pacific Electric Vehicle Battery Materials Market Volume Share (%), by Geography 2025 & 2033
- Figure 31: India Asia Pacific Electric Vehicle Battery Materials Market Revenue (Million), by Country 2025 & 2033
- Figure 32: India Asia Pacific Electric Vehicle Battery Materials Market Volume (Billion), by Country 2025 & 2033
- Figure 33: India Asia Pacific Electric Vehicle Battery Materials Market Revenue Share (%), by Country 2025 & 2033
- Figure 34: India Asia Pacific Electric Vehicle Battery Materials Market Volume Share (%), by Country 2025 & 2033
- Figure 35: Australia Asia Pacific Electric Vehicle Battery Materials Market Revenue (Million), by Battery Type 2025 & 2033
- Figure 36: Australia Asia Pacific Electric Vehicle Battery Materials Market Volume (Billion), by Battery Type 2025 & 2033
- Figure 37: Australia Asia Pacific Electric Vehicle Battery Materials Market Revenue Share (%), by Battery Type 2025 & 2033
- Figure 38: Australia Asia Pacific Electric Vehicle Battery Materials Market Volume Share (%), by Battery Type 2025 & 2033
- Figure 39: Australia Asia Pacific Electric Vehicle Battery Materials Market Revenue (Million), by Material 2025 & 2033
- Figure 40: Australia Asia Pacific Electric Vehicle Battery Materials Market Volume (Billion), by Material 2025 & 2033
- Figure 41: Australia Asia Pacific Electric Vehicle Battery Materials Market Revenue Share (%), by Material 2025 & 2033
- Figure 42: Australia Asia Pacific Electric Vehicle Battery Materials Market Volume Share (%), by Material 2025 & 2033
- Figure 43: Australia Asia Pacific Electric Vehicle Battery Materials Market Revenue (Million), by Geography 2025 & 2033
- Figure 44: Australia Asia Pacific Electric Vehicle Battery Materials Market Volume (Billion), by Geography 2025 & 2033
- Figure 45: Australia Asia Pacific Electric Vehicle Battery Materials Market Revenue Share (%), by Geography 2025 & 2033
- Figure 46: Australia Asia Pacific Electric Vehicle Battery Materials Market Volume Share (%), by Geography 2025 & 2033
- Figure 47: Australia Asia Pacific Electric Vehicle Battery Materials Market Revenue (Million), by Country 2025 & 2033
- Figure 48: Australia Asia Pacific Electric Vehicle Battery Materials Market Volume (Billion), by Country 2025 & 2033
- Figure 49: Australia Asia Pacific Electric Vehicle Battery Materials Market Revenue Share (%), by Country 2025 & 2033
- Figure 50: Australia Asia Pacific Electric Vehicle Battery Materials Market Volume Share (%), by Country 2025 & 2033
- Figure 51: Japan Asia Pacific Electric Vehicle Battery Materials Market Revenue (Million), by Battery Type 2025 & 2033
- Figure 52: Japan Asia Pacific Electric Vehicle Battery Materials Market Volume (Billion), by Battery Type 2025 & 2033
- Figure 53: Japan Asia Pacific Electric Vehicle Battery Materials Market Revenue Share (%), by Battery Type 2025 & 2033
- Figure 54: Japan Asia Pacific Electric Vehicle Battery Materials Market Volume Share (%), by Battery Type 2025 & 2033
- Figure 55: Japan Asia Pacific Electric Vehicle Battery Materials Market Revenue (Million), by Material 2025 & 2033
- Figure 56: Japan Asia Pacific Electric Vehicle Battery Materials Market Volume (Billion), by Material 2025 & 2033
- Figure 57: Japan Asia Pacific Electric Vehicle Battery Materials Market Revenue Share (%), by Material 2025 & 2033
- Figure 58: Japan Asia Pacific Electric Vehicle Battery Materials Market Volume Share (%), by Material 2025 & 2033
- Figure 59: Japan Asia Pacific Electric Vehicle Battery Materials Market Revenue (Million), by Geography 2025 & 2033
- Figure 60: Japan Asia Pacific Electric Vehicle Battery Materials Market Volume (Billion), by Geography 2025 & 2033
- Figure 61: Japan Asia Pacific Electric Vehicle Battery Materials Market Revenue Share (%), by Geography 2025 & 2033
- Figure 62: Japan Asia Pacific Electric Vehicle Battery Materials Market Volume Share (%), by Geography 2025 & 2033
- Figure 63: Japan Asia Pacific Electric Vehicle Battery Materials Market Revenue (Million), by Country 2025 & 2033
- Figure 64: Japan Asia Pacific Electric Vehicle Battery Materials Market Volume (Billion), by Country 2025 & 2033
- Figure 65: Japan Asia Pacific Electric Vehicle Battery Materials Market Revenue Share (%), by Country 2025 & 2033
- Figure 66: Japan Asia Pacific Electric Vehicle Battery Materials Market Volume Share (%), by Country 2025 & 2033
- Figure 67: South Korea Asia Pacific Electric Vehicle Battery Materials Market Revenue (Million), by Battery Type 2025 & 2033
- Figure 68: South Korea Asia Pacific Electric Vehicle Battery Materials Market Volume (Billion), by Battery Type 2025 & 2033
- Figure 69: South Korea Asia Pacific Electric Vehicle Battery Materials Market Revenue Share (%), by Battery Type 2025 & 2033
- Figure 70: South Korea Asia Pacific Electric Vehicle Battery Materials Market Volume Share (%), by Battery Type 2025 & 2033
- Figure 71: South Korea Asia Pacific Electric Vehicle Battery Materials Market Revenue (Million), by Material 2025 & 2033
- Figure 72: South Korea Asia Pacific Electric Vehicle Battery Materials Market Volume (Billion), by Material 2025 & 2033
- Figure 73: South Korea Asia Pacific Electric Vehicle Battery Materials Market Revenue Share (%), by Material 2025 & 2033
- Figure 74: South Korea Asia Pacific Electric Vehicle Battery Materials Market Volume Share (%), by Material 2025 & 2033
- Figure 75: South Korea Asia Pacific Electric Vehicle Battery Materials Market Revenue (Million), by Geography 2025 & 2033
- Figure 76: South Korea Asia Pacific Electric Vehicle Battery Materials Market Volume (Billion), by Geography 2025 & 2033
- Figure 77: South Korea Asia Pacific Electric Vehicle Battery Materials Market Revenue Share (%), by Geography 2025 & 2033
- Figure 78: South Korea Asia Pacific Electric Vehicle Battery Materials Market Volume Share (%), by Geography 2025 & 2033
- Figure 79: South Korea Asia Pacific Electric Vehicle Battery Materials Market Revenue (Million), by Country 2025 & 2033
- Figure 80: South Korea Asia Pacific Electric Vehicle Battery Materials Market Volume (Billion), by Country 2025 & 2033
- Figure 81: South Korea Asia Pacific Electric Vehicle Battery Materials Market Revenue Share (%), by Country 2025 & 2033
- Figure 82: South Korea Asia Pacific Electric Vehicle Battery Materials Market Volume Share (%), by Country 2025 & 2033
- Figure 83: Malaysia Asia Pacific Electric Vehicle Battery Materials Market Revenue (Million), by Battery Type 2025 & 2033
- Figure 84: Malaysia Asia Pacific Electric Vehicle Battery Materials Market Volume (Billion), by Battery Type 2025 & 2033
- Figure 85: Malaysia Asia Pacific Electric Vehicle Battery Materials Market Revenue Share (%), by Battery Type 2025 & 2033
- Figure 86: Malaysia Asia Pacific Electric Vehicle Battery Materials Market Volume Share (%), by Battery Type 2025 & 2033
- Figure 87: Malaysia Asia Pacific Electric Vehicle Battery Materials Market Revenue (Million), by Material 2025 & 2033
- Figure 88: Malaysia Asia Pacific Electric Vehicle Battery Materials Market Volume (Billion), by Material 2025 & 2033
- Figure 89: Malaysia Asia Pacific Electric Vehicle Battery Materials Market Revenue Share (%), by Material 2025 & 2033
- Figure 90: Malaysia Asia Pacific Electric Vehicle Battery Materials Market Volume Share (%), by Material 2025 & 2033
- Figure 91: Malaysia Asia Pacific Electric Vehicle Battery Materials Market Revenue (Million), by Geography 2025 & 2033
- Figure 92: Malaysia Asia Pacific Electric Vehicle Battery Materials Market Volume (Billion), by Geography 2025 & 2033
- Figure 93: Malaysia Asia Pacific Electric Vehicle Battery Materials Market Revenue Share (%), by Geography 2025 & 2033
- Figure 94: Malaysia Asia Pacific Electric Vehicle Battery Materials Market Volume Share (%), by Geography 2025 & 2033
- Figure 95: Malaysia Asia Pacific Electric Vehicle Battery Materials Market Revenue (Million), by Country 2025 & 2033
- Figure 96: Malaysia Asia Pacific Electric Vehicle Battery Materials Market Volume (Billion), by Country 2025 & 2033
- Figure 97: Malaysia Asia Pacific Electric Vehicle Battery Materials Market Revenue Share (%), by Country 2025 & 2033
- Figure 98: Malaysia Asia Pacific Electric Vehicle Battery Materials Market Volume Share (%), by Country 2025 & 2033
- Figure 99: Thailand Asia Pacific Electric Vehicle Battery Materials Market Revenue (Million), by Battery Type 2025 & 2033
- Figure 100: Thailand Asia Pacific Electric Vehicle Battery Materials Market Volume (Billion), by Battery Type 2025 & 2033
- Figure 101: Thailand Asia Pacific Electric Vehicle Battery Materials Market Revenue Share (%), by Battery Type 2025 & 2033
- Figure 102: Thailand Asia Pacific Electric Vehicle Battery Materials Market Volume Share (%), by Battery Type 2025 & 2033
- Figure 103: Thailand Asia Pacific Electric Vehicle Battery Materials Market Revenue (Million), by Material 2025 & 2033
- Figure 104: Thailand Asia Pacific Electric Vehicle Battery Materials Market Volume (Billion), by Material 2025 & 2033
- Figure 105: Thailand Asia Pacific Electric Vehicle Battery Materials Market Revenue Share (%), by Material 2025 & 2033
- Figure 106: Thailand Asia Pacific Electric Vehicle Battery Materials Market Volume Share (%), by Material 2025 & 2033
- Figure 107: Thailand Asia Pacific Electric Vehicle Battery Materials Market Revenue (Million), by Geography 2025 & 2033
- Figure 108: Thailand Asia Pacific Electric Vehicle Battery Materials Market Volume (Billion), by Geography 2025 & 2033
- Figure 109: Thailand Asia Pacific Electric Vehicle Battery Materials Market Revenue Share (%), by Geography 2025 & 2033
- Figure 110: Thailand Asia Pacific Electric Vehicle Battery Materials Market Volume Share (%), by Geography 2025 & 2033
- Figure 111: Thailand Asia Pacific Electric Vehicle Battery Materials Market Revenue (Million), by Country 2025 & 2033
- Figure 112: Thailand Asia Pacific Electric Vehicle Battery Materials Market Volume (Billion), by Country 2025 & 2033
- Figure 113: Thailand Asia Pacific Electric Vehicle Battery Materials Market Revenue Share (%), by Country 2025 & 2033
- Figure 114: Thailand Asia Pacific Electric Vehicle Battery Materials Market Volume Share (%), by Country 2025 & 2033
- Figure 115: Indonesia Asia Pacific Electric Vehicle Battery Materials Market Revenue (Million), by Battery Type 2025 & 2033
- Figure 116: Indonesia Asia Pacific Electric Vehicle Battery Materials Market Volume (Billion), by Battery Type 2025 & 2033
- Figure 117: Indonesia Asia Pacific Electric Vehicle Battery Materials Market Revenue Share (%), by Battery Type 2025 & 2033
- Figure 118: Indonesia Asia Pacific Electric Vehicle Battery Materials Market Volume Share (%), by Battery Type 2025 & 2033
- Figure 119: Indonesia Asia Pacific Electric Vehicle Battery Materials Market Revenue (Million), by Material 2025 & 2033
- Figure 120: Indonesia Asia Pacific Electric Vehicle Battery Materials Market Volume (Billion), by Material 2025 & 2033
- Figure 121: Indonesia Asia Pacific Electric Vehicle Battery Materials Market Revenue Share (%), by Material 2025 & 2033
- Figure 122: Indonesia Asia Pacific Electric Vehicle Battery Materials Market Volume Share (%), by Material 2025 & 2033
- Figure 123: Indonesia Asia Pacific Electric Vehicle Battery Materials Market Revenue (Million), by Geography 2025 & 2033
- Figure 124: Indonesia Asia Pacific Electric Vehicle Battery Materials Market Volume (Billion), by Geography 2025 & 2033
- Figure 125: Indonesia Asia Pacific Electric Vehicle Battery Materials Market Revenue Share (%), by Geography 2025 & 2033
- Figure 126: Indonesia Asia Pacific Electric Vehicle Battery Materials Market Volume Share (%), by Geography 2025 & 2033
- Figure 127: Indonesia Asia Pacific Electric Vehicle Battery Materials Market Revenue (Million), by Country 2025 & 2033
- Figure 128: Indonesia Asia Pacific Electric Vehicle Battery Materials Market Volume (Billion), by Country 2025 & 2033
- Figure 129: Indonesia Asia Pacific Electric Vehicle Battery Materials Market Revenue Share (%), by Country 2025 & 2033
- Figure 130: Indonesia Asia Pacific Electric Vehicle Battery Materials Market Volume Share (%), by Country 2025 & 2033
- Figure 131: Vietnam Asia Pacific Electric Vehicle Battery Materials Market Revenue (Million), by Battery Type 2025 & 2033
- Figure 132: Vietnam Asia Pacific Electric Vehicle Battery Materials Market Volume (Billion), by Battery Type 2025 & 2033
- Figure 133: Vietnam Asia Pacific Electric Vehicle Battery Materials Market Revenue Share (%), by Battery Type 2025 & 2033
- Figure 134: Vietnam Asia Pacific Electric Vehicle Battery Materials Market Volume Share (%), by Battery Type 2025 & 2033
- Figure 135: Vietnam Asia Pacific Electric Vehicle Battery Materials Market Revenue (Million), by Material 2025 & 2033
- Figure 136: Vietnam Asia Pacific Electric Vehicle Battery Materials Market Volume (Billion), by Material 2025 & 2033
- Figure 137: Vietnam Asia Pacific Electric Vehicle Battery Materials Market Revenue Share (%), by Material 2025 & 2033
- Figure 138: Vietnam Asia Pacific Electric Vehicle Battery Materials Market Volume Share (%), by Material 2025 & 2033
- Figure 139: Vietnam Asia Pacific Electric Vehicle Battery Materials Market Revenue (Million), by Geography 2025 & 2033
- Figure 140: Vietnam Asia Pacific Electric Vehicle Battery Materials Market Volume (Billion), by Geography 2025 & 2033
- Figure 141: Vietnam Asia Pacific Electric Vehicle Battery Materials Market Revenue Share (%), by Geography 2025 & 2033
- Figure 142: Vietnam Asia Pacific Electric Vehicle Battery Materials Market Volume Share (%), by Geography 2025 & 2033
- Figure 143: Vietnam Asia Pacific Electric Vehicle Battery Materials Market Revenue (Million), by Country 2025 & 2033
- Figure 144: Vietnam Asia Pacific Electric Vehicle Battery Materials Market Volume (Billion), by Country 2025 & 2033
- Figure 145: Vietnam Asia Pacific Electric Vehicle Battery Materials Market Revenue Share (%), by Country 2025 & 2033
- Figure 146: Vietnam Asia Pacific Electric Vehicle Battery Materials Market Volume Share (%), by Country 2025 & 2033
- Figure 147: Rest of Asia Pacific Asia Pacific Electric Vehicle Battery Materials Market Revenue (Million), by Battery Type 2025 & 2033
- Figure 148: Rest of Asia Pacific Asia Pacific Electric Vehicle Battery Materials Market Volume (Billion), by Battery Type 2025 & 2033
- Figure 149: Rest of Asia Pacific Asia Pacific Electric Vehicle Battery Materials Market Revenue Share (%), by Battery Type 2025 & 2033
- Figure 150: Rest of Asia Pacific Asia Pacific Electric Vehicle Battery Materials Market Volume Share (%), by Battery Type 2025 & 2033
- Figure 151: Rest of Asia Pacific Asia Pacific Electric Vehicle Battery Materials Market Revenue (Million), by Material 2025 & 2033
- Figure 152: Rest of Asia Pacific Asia Pacific Electric Vehicle Battery Materials Market Volume (Billion), by Material 2025 & 2033
- Figure 153: Rest of Asia Pacific Asia Pacific Electric Vehicle Battery Materials Market Revenue Share (%), by Material 2025 & 2033
- Figure 154: Rest of Asia Pacific Asia Pacific Electric Vehicle Battery Materials Market Volume Share (%), by Material 2025 & 2033
- Figure 155: Rest of Asia Pacific Asia Pacific Electric Vehicle Battery Materials Market Revenue (Million), by Geography 2025 & 2033
- Figure 156: Rest of Asia Pacific Asia Pacific Electric Vehicle Battery Materials Market Volume (Billion), by Geography 2025 & 2033
- Figure 157: Rest of Asia Pacific Asia Pacific Electric Vehicle Battery Materials Market Revenue Share (%), by Geography 2025 & 2033
- Figure 158: Rest of Asia Pacific Asia Pacific Electric Vehicle Battery Materials Market Volume Share (%), by Geography 2025 & 2033
- Figure 159: Rest of Asia Pacific Asia Pacific Electric Vehicle Battery Materials Market Revenue (Million), by Country 2025 & 2033
- Figure 160: Rest of Asia Pacific Asia Pacific Electric Vehicle Battery Materials Market Volume (Billion), by Country 2025 & 2033
- Figure 161: Rest of Asia Pacific Asia Pacific Electric Vehicle Battery Materials Market Revenue Share (%), by Country 2025 & 2033
- Figure 162: Rest of Asia Pacific Asia Pacific Electric Vehicle Battery Materials Market Volume Share (%), by Country 2025 & 2033
List of Tables
- Table 1: Global Asia Pacific Electric Vehicle Battery Materials Market Revenue Million Forecast, by Battery Type 2020 & 2033
- Table 2: Global Asia Pacific Electric Vehicle Battery Materials Market Volume Billion Forecast, by Battery Type 2020 & 2033
- Table 3: Global Asia Pacific Electric Vehicle Battery Materials Market Revenue Million Forecast, by Material 2020 & 2033
- Table 4: Global Asia Pacific Electric Vehicle Battery Materials Market Volume Billion Forecast, by Material 2020 & 2033
- Table 5: Global Asia Pacific Electric Vehicle Battery Materials Market Revenue Million Forecast, by Geography 2020 & 2033
- Table 6: Global Asia Pacific Electric Vehicle Battery Materials Market Volume Billion Forecast, by Geography 2020 & 2033
- Table 7: Global Asia Pacific Electric Vehicle Battery Materials Market Revenue Million Forecast, by Region 2020 & 2033
- Table 8: Global Asia Pacific Electric Vehicle Battery Materials Market Volume Billion Forecast, by Region 2020 & 2033
- Table 9: Global Asia Pacific Electric Vehicle Battery Materials Market Revenue Million Forecast, by Battery Type 2020 & 2033
- Table 10: Global Asia Pacific Electric Vehicle Battery Materials Market Volume Billion Forecast, by Battery Type 2020 & 2033
- Table 11: Global Asia Pacific Electric Vehicle Battery Materials Market Revenue Million Forecast, by Material 2020 & 2033
- Table 12: Global Asia Pacific Electric Vehicle Battery Materials Market Volume Billion Forecast, by Material 2020 & 2033
- Table 13: Global Asia Pacific Electric Vehicle Battery Materials Market Revenue Million Forecast, by Geography 2020 & 2033
- Table 14: Global Asia Pacific Electric Vehicle Battery Materials Market Volume Billion Forecast, by Geography 2020 & 2033
- Table 15: Global Asia Pacific Electric Vehicle Battery Materials Market Revenue Million Forecast, by Country 2020 & 2033
- Table 16: Global Asia Pacific Electric Vehicle Battery Materials Market Volume Billion Forecast, by Country 2020 & 2033
- Table 17: Global Asia Pacific Electric Vehicle Battery Materials Market Revenue Million Forecast, by Battery Type 2020 & 2033
- Table 18: Global Asia Pacific Electric Vehicle Battery Materials Market Volume Billion Forecast, by Battery Type 2020 & 2033
- Table 19: Global Asia Pacific Electric Vehicle Battery Materials Market Revenue Million Forecast, by Material 2020 & 2033
- Table 20: Global Asia Pacific Electric Vehicle Battery Materials Market Volume Billion Forecast, by Material 2020 & 2033
- Table 21: Global Asia Pacific Electric Vehicle Battery Materials Market Revenue Million Forecast, by Geography 2020 & 2033
- Table 22: Global Asia Pacific Electric Vehicle Battery Materials Market Volume Billion Forecast, by Geography 2020 & 2033
- Table 23: Global Asia Pacific Electric Vehicle Battery Materials Market Revenue Million Forecast, by Country 2020 & 2033
- Table 24: Global Asia Pacific Electric Vehicle Battery Materials Market Volume Billion Forecast, by Country 2020 & 2033
- Table 25: Global Asia Pacific Electric Vehicle Battery Materials Market Revenue Million Forecast, by Battery Type 2020 & 2033
- Table 26: Global Asia Pacific Electric Vehicle Battery Materials Market Volume Billion Forecast, by Battery Type 2020 & 2033
- Table 27: Global Asia Pacific Electric Vehicle Battery Materials Market Revenue Million Forecast, by Material 2020 & 2033
- Table 28: Global Asia Pacific Electric Vehicle Battery Materials Market Volume Billion Forecast, by Material 2020 & 2033
- Table 29: Global Asia Pacific Electric Vehicle Battery Materials Market Revenue Million Forecast, by Geography 2020 & 2033
- Table 30: Global Asia Pacific Electric Vehicle Battery Materials Market Volume Billion Forecast, by Geography 2020 & 2033
- Table 31: Global Asia Pacific Electric Vehicle Battery Materials Market Revenue Million Forecast, by Country 2020 & 2033
- Table 32: Global Asia Pacific Electric Vehicle Battery Materials Market Volume Billion Forecast, by Country 2020 & 2033
- Table 33: Global Asia Pacific Electric Vehicle Battery Materials Market Revenue Million Forecast, by Battery Type 2020 & 2033
- Table 34: Global Asia Pacific Electric Vehicle Battery Materials Market Volume Billion Forecast, by Battery Type 2020 & 2033
- Table 35: Global Asia Pacific Electric Vehicle Battery Materials Market Revenue Million Forecast, by Material 2020 & 2033
- Table 36: Global Asia Pacific Electric Vehicle Battery Materials Market Volume Billion Forecast, by Material 2020 & 2033
- Table 37: Global Asia Pacific Electric Vehicle Battery Materials Market Revenue Million Forecast, by Geography 2020 & 2033
- Table 38: Global Asia Pacific Electric Vehicle Battery Materials Market Volume Billion Forecast, by Geography 2020 & 2033
- Table 39: Global Asia Pacific Electric Vehicle Battery Materials Market Revenue Million Forecast, by Country 2020 & 2033
- Table 40: Global Asia Pacific Electric Vehicle Battery Materials Market Volume Billion Forecast, by Country 2020 & 2033
- Table 41: Global Asia Pacific Electric Vehicle Battery Materials Market Revenue Million Forecast, by Battery Type 2020 & 2033
- Table 42: Global Asia Pacific Electric Vehicle Battery Materials Market Volume Billion Forecast, by Battery Type 2020 & 2033
- Table 43: Global Asia Pacific Electric Vehicle Battery Materials Market Revenue Million Forecast, by Material 2020 & 2033
- Table 44: Global Asia Pacific Electric Vehicle Battery Materials Market Volume Billion Forecast, by Material 2020 & 2033
- Table 45: Global Asia Pacific Electric Vehicle Battery Materials Market Revenue Million Forecast, by Geography 2020 & 2033
- Table 46: Global Asia Pacific Electric Vehicle Battery Materials Market Volume Billion Forecast, by Geography 2020 & 2033
- Table 47: Global Asia Pacific Electric Vehicle Battery Materials Market Revenue Million Forecast, by Country 2020 & 2033
- Table 48: Global Asia Pacific Electric Vehicle Battery Materials Market Volume Billion Forecast, by Country 2020 & 2033
- Table 49: Global Asia Pacific Electric Vehicle Battery Materials Market Revenue Million Forecast, by Battery Type 2020 & 2033
- Table 50: Global Asia Pacific Electric Vehicle Battery Materials Market Volume Billion Forecast, by Battery Type 2020 & 2033
- Table 51: Global Asia Pacific Electric Vehicle Battery Materials Market Revenue Million Forecast, by Material 2020 & 2033
- Table 52: Global Asia Pacific Electric Vehicle Battery Materials Market Volume Billion Forecast, by Material 2020 & 2033
- Table 53: Global Asia Pacific Electric Vehicle Battery Materials Market Revenue Million Forecast, by Geography 2020 & 2033
- Table 54: Global Asia Pacific Electric Vehicle Battery Materials Market Volume Billion Forecast, by Geography 2020 & 2033
- Table 55: Global Asia Pacific Electric Vehicle Battery Materials Market Revenue Million Forecast, by Country 2020 & 2033
- Table 56: Global Asia Pacific Electric Vehicle Battery Materials Market Volume Billion Forecast, by Country 2020 & 2033
- Table 57: Global Asia Pacific Electric Vehicle Battery Materials Market Revenue Million Forecast, by Battery Type 2020 & 2033
- Table 58: Global Asia Pacific Electric Vehicle Battery Materials Market Volume Billion Forecast, by Battery Type 2020 & 2033
- Table 59: Global Asia Pacific Electric Vehicle Battery Materials Market Revenue Million Forecast, by Material 2020 & 2033
- Table 60: Global Asia Pacific Electric Vehicle Battery Materials Market Volume Billion Forecast, by Material 2020 & 2033
- Table 61: Global Asia Pacific Electric Vehicle Battery Materials Market Revenue Million Forecast, by Geography 2020 & 2033
- Table 62: Global Asia Pacific Electric Vehicle Battery Materials Market Volume Billion Forecast, by Geography 2020 & 2033
- Table 63: Global Asia Pacific Electric Vehicle Battery Materials Market Revenue Million Forecast, by Country 2020 & 2033
- Table 64: Global Asia Pacific Electric Vehicle Battery Materials Market Volume Billion Forecast, by Country 2020 & 2033
- Table 65: Global Asia Pacific Electric Vehicle Battery Materials Market Revenue Million Forecast, by Battery Type 2020 & 2033
- Table 66: Global Asia Pacific Electric Vehicle Battery Materials Market Volume Billion Forecast, by Battery Type 2020 & 2033
- Table 67: Global Asia Pacific Electric Vehicle Battery Materials Market Revenue Million Forecast, by Material 2020 & 2033
- Table 68: Global Asia Pacific Electric Vehicle Battery Materials Market Volume Billion Forecast, by Material 2020 & 2033
- Table 69: Global Asia Pacific Electric Vehicle Battery Materials Market Revenue Million Forecast, by Geography 2020 & 2033
- Table 70: Global Asia Pacific Electric Vehicle Battery Materials Market Volume Billion Forecast, by Geography 2020 & 2033
- Table 71: Global Asia Pacific Electric Vehicle Battery Materials Market Revenue Million Forecast, by Country 2020 & 2033
- Table 72: Global Asia Pacific Electric Vehicle Battery Materials Market Volume Billion Forecast, by Country 2020 & 2033
- Table 73: Global Asia Pacific Electric Vehicle Battery Materials Market Revenue Million Forecast, by Battery Type 2020 & 2033
- Table 74: Global Asia Pacific Electric Vehicle Battery Materials Market Volume Billion Forecast, by Battery Type 2020 & 2033
- Table 75: Global Asia Pacific Electric Vehicle Battery Materials Market Revenue Million Forecast, by Material 2020 & 2033
- Table 76: Global Asia Pacific Electric Vehicle Battery Materials Market Volume Billion Forecast, by Material 2020 & 2033
- Table 77: Global Asia Pacific Electric Vehicle Battery Materials Market Revenue Million Forecast, by Geography 2020 & 2033
- Table 78: Global Asia Pacific Electric Vehicle Battery Materials Market Volume Billion Forecast, by Geography 2020 & 2033
- Table 79: Global Asia Pacific Electric Vehicle Battery Materials Market Revenue Million Forecast, by Country 2020 & 2033
- Table 80: Global Asia Pacific Electric Vehicle Battery Materials Market Volume Billion Forecast, by Country 2020 & 2033
- Table 81: Global Asia Pacific Electric Vehicle Battery Materials Market Revenue Million Forecast, by Battery Type 2020 & 2033
- Table 82: Global Asia Pacific Electric Vehicle Battery Materials Market Volume Billion Forecast, by Battery Type 2020 & 2033
- Table 83: Global Asia Pacific Electric Vehicle Battery Materials Market Revenue Million Forecast, by Material 2020 & 2033
- Table 84: Global Asia Pacific Electric Vehicle Battery Materials Market Volume Billion Forecast, by Material 2020 & 2033
- Table 85: Global Asia Pacific Electric Vehicle Battery Materials Market Revenue Million Forecast, by Geography 2020 & 2033
- Table 86: Global Asia Pacific Electric Vehicle Battery Materials Market Volume Billion Forecast, by Geography 2020 & 2033
- Table 87: Global Asia Pacific Electric Vehicle Battery Materials Market Revenue Million Forecast, by Country 2020 & 2033
- Table 88: Global Asia Pacific Electric Vehicle Battery Materials Market Volume Billion Forecast, by Country 2020 & 2033
Frequently Asked Questions
1. What is the projected Compound Annual Growth Rate (CAGR) of the Asia Pacific Electric Vehicle Battery Materials Market?
The projected CAGR is approximately 13.61%.
2. Which companies are prominent players in the Asia Pacific Electric Vehicle Battery Materials Market?
Key companies in the market include Sumitomo Chemical Co Ltd, BASF SE, Mitsubishi Chemical Group Corporation, UBE Corporation, Umicore SA, Contemporary Amperex Technology Co Limited, Nichia Corporation, ENTEK International LLC, LG Chem, Kureha Corporation*List Not Exhaustive 6 4 List of Other Prominent Companies6 5 Market Ranking/ Share Analysi.
3. What are the main segments of the Asia Pacific Electric Vehicle Battery Materials Market?
The market segments include Battery Type, Material, Geography.
4. Can you provide details about the market size?
The market size is estimated to be USD 16.84 Million as of 2022.
5. What are some drivers contributing to market growth?
4.; Growing Electric Vehicle Sales4.; Supportive Government Policies and Regulations.
6. What are the notable trends driving market growth?
Lithium-Ion Battery Type Dominate the Market.
7. Are there any restraints impacting market growth?
4.; Growing Electric Vehicle Sales4.; Supportive Government Policies and Regulations.
8. Can you provide examples of recent developments in the market?
November 2023: SK On Co., an electric vehicle battery maker, and BASF SE, a battery materials producer, collaborated to develop industry-leading battery materials for lithium-ion batteries in North America and the Asia-Pacific. The companies intended to improve long-term competitiveness amid slowing growth in the eco-friendly automobile industry.June 2023: Japan created a solid-air battery that can be recharged. Researchers have shown an all-solid-state rechargeable air battery made of a proton-conductive polymer electrolyte and a redox-active organic negative electrode. These batteries function well in the vicinity of their theoretical maximum capacity.
9. What pricing options are available for accessing the report?
Pricing options include single-user, multi-user, and enterprise licenses priced at USD 4750, USD 5250, and USD 8750 respectively.
10. Is the market size provided in terms of value or volume?
The market size is provided in terms of value, measured in Million and volume, measured in Billion.
11. Are there any specific market keywords associated with the report?
Yes, the market keyword associated with the report is "Asia Pacific Electric Vehicle Battery Materials Market," which aids in identifying and referencing the specific market segment covered.
12. How do I determine which pricing option suits my needs best?
The pricing options vary based on user requirements and access needs. Individual users may opt for single-user licenses, while businesses requiring broader access may choose multi-user or enterprise licenses for cost-effective access to the report.
13. Are there any additional resources or data provided in the Asia Pacific Electric Vehicle Battery Materials Market report?
While the report offers comprehensive insights, it's advisable to review the specific contents or supplementary materials provided to ascertain if additional resources or data are available.
14. How can I stay updated on further developments or reports in the Asia Pacific Electric Vehicle Battery Materials Market?
To stay informed about further developments, trends, and reports in the Asia Pacific Electric Vehicle Battery Materials Market, consider subscribing to industry newsletters, following relevant companies and organizations, or regularly checking reputable industry news sources and publications.
Methodology
Step 1 - Identification of Relevant Samples Size from Population Database


Step 2 - Approaches for Defining Global Market Size (Value, Volume* & Price*)

Note*: In applicable scenarios
Step 3 - Data Sources
Primary Research
- Web Analytics
- Survey Reports
- Research Institute
- Latest Research Reports
- Opinion Leaders
Secondary Research
- Annual Reports
- White Paper
- Latest Press Release
- Industry Association
- Paid Database
- Investor Presentations

Step 4 - Data Triangulation
Involves using different sources of information in order to increase the validity of a study
These sources are likely to be stakeholders in a program - participants, other researchers, program staff, other community members, and so on.
Then we put all data in single framework & apply various statistical tools to find out the dynamic on the market.
During the analysis stage, feedback from the stakeholder groups would be compared to determine areas of agreement as well as areas of divergence