

Key Insights
The Asia Pacific Industrial Computed Tomography (ICT) market is poised for substantial growth, fueled by increasing adoption across key sectors including aerospace, automotive, and electronics. This expansion is driven by the region's robust manufacturing base and the escalating need for advanced non-destructive testing (NDT) for superior quality control and failure analysis. We project the market to reach a size of 536 million by 2025, with a compound annual growth rate (CAGR) of 19.04. Key growth drivers include the rising demand for lightweight, high-strength materials in aerospace and automotive, necessitating precise flaw detection. The increasing complexity of electronic components also demands detailed analytical capabilities. Furthermore, stringent quality regulations across industries are compelling the adoption of ICT to ensure product reliability and safety. Flaw Detection and Inspection applications are leading segments, followed closely by Failure Analysis. Aerospace and automotive industries are significant contributors to end-user demand. Major markets within Asia-Pacific include China, Japan, India, and South Korea, benefiting from established manufacturing infrastructure and investment in advanced technologies. While initial investment costs and the need for skilled personnel may present challenges, the market outlook remains highly positive, offering considerable growth opportunities.
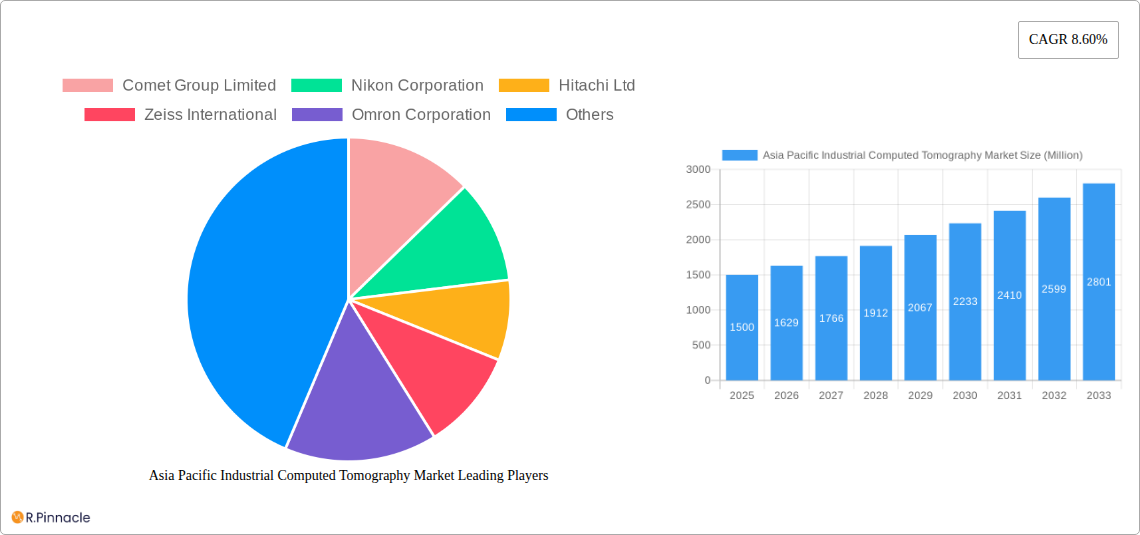
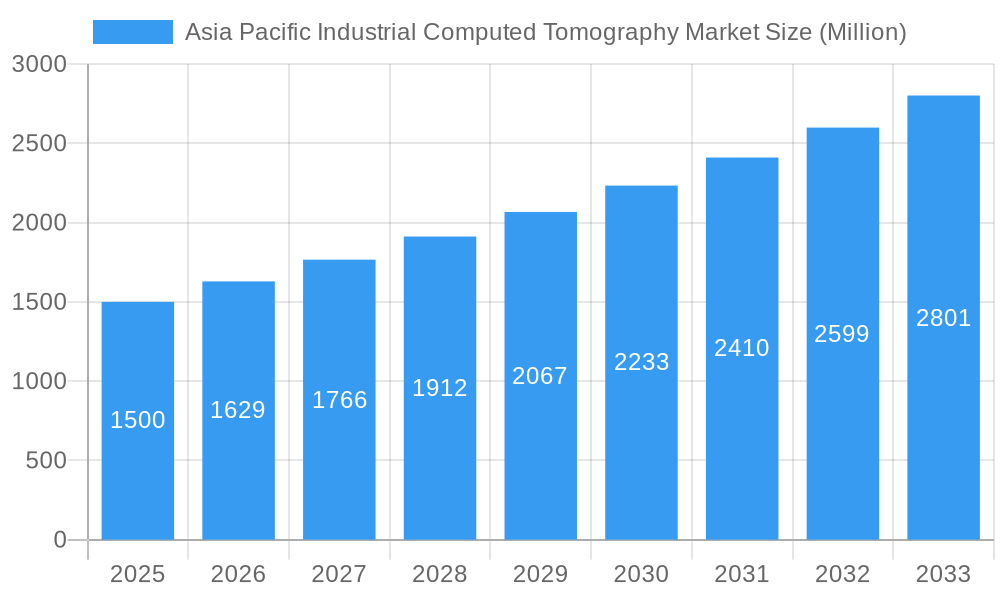
Asia Pacific Industrial Computed Tomography Market Market Size (In Million)
The considerable market size and high projected CAGR highlight the critical role of ICT in ensuring product quality and safety. Leading companies such as Comet Group, Nikon, Hitachi, and Zeiss are strategically positioned to capitalize on this growth by offering advanced ICT systems and comprehensive services. Continuous technological advancements, including enhanced resolution, accelerated scan times, and sophisticated data analysis software, are further boosting market appeal. The diverse manufacturing landscape of the Asia-Pacific region provides an ideal environment for ICT adoption, especially with the growing emphasis on precision engineering and efficient quality control processes. As emerging economies in the region expand their manufacturing capabilities, the demand for advanced NDT techniques like ICT is set to surge.
Asia Pacific Industrial Computed Tomography Market Company Market Share
Asia Pacific Industrial Computed Tomography Market: A Comprehensive Report (2019-2033)
This comprehensive report provides an in-depth analysis of the Asia Pacific Industrial Computed Tomography (CT) market, offering invaluable insights for industry professionals, investors, and strategic decision-makers. Covering the period from 2019 to 2033, with a focus on 2025, this report meticulously examines market dynamics, segmentation, key players, and future growth prospects. The report leverages robust data analysis and expert insights to deliver actionable intelligence, empowering businesses to navigate the evolving landscape of industrial CT technology in the Asia-Pacific region.
Asia Pacific Industrial Computed Tomography Market Structure & Innovation Trends
The Asia Pacific industrial computed tomography market exhibits a moderately consolidated structure, with several multinational corporations and regional players competing for market share. The market share distribution among the top 10 players is estimated to be around xx%, indicating a competitive yet concentrated landscape. Key innovation drivers include advancements in X-ray source technology, detector sensitivity, and image reconstruction algorithms, leading to higher resolution, faster scan times, and improved material characterization capabilities. Stringent quality control regulations across various end-user industries, particularly in aerospace and automotive, are shaping market demand for advanced CT systems. Product substitutes, such as conventional non-destructive testing (NDT) methods, pose a competitive threat, although the superior capabilities of CT in terms of internal visualization and quantitative analysis are driving its adoption. The M&A landscape has witnessed xx number of deals valued at approximately xx Million in the past five years, primarily driven by strategic acquisitions aimed at expanding product portfolios and geographical reach. Examples include:
- Consolidation: The market has seen consolidation through mergers and acquisitions, with larger players acquiring smaller companies to expand their product portfolios and market reach. The average deal value was approximately xx Million.
- Technological Advancements: The continuous advancements in X-ray source technology, detector sensitivity and image reconstruction software fuels the need for improved quality and speed in the industrial CT market.
- Regulatory Changes: Stringent quality and safety regulations are driving the growth in certain sectors, especially aerospace and automotive.
Asia Pacific Industrial Computed Tomography Market Dynamics & Trends
The Asia Pacific industrial computed tomography market is experiencing robust growth, driven by increasing demand from various end-user industries. The market is projected to register a CAGR of xx% during the forecast period (2025-2033), fueled by several key factors:
- Rising adoption of advanced manufacturing techniques: The demand for higher quality control and product inspection in the manufacturing sector is propelling the adoption of industrial CT.
- Growth of the electronics industry: The increasing complexity of electronic components necessitates precise inspection techniques like CT for quality assurance.
- Stringent quality control standards: Stringent regulatory frameworks and quality standards in industries like aerospace and automotive drive the demand for highly reliable CT systems.
- Technological advancements: Continuous innovation in X-ray source technology, detectors and reconstruction algorithms are enhancing the capabilities and reducing the cost of industrial CT systems.
- Increased adoption in Oil & Gas: The demand for non-destructive testing in Oil and Gas exploration and processing is driving the use of industrial CT.
Market penetration of industrial CT in specific sectors like electronics and automotive is expected to increase significantly in the coming years due to increasing production volumes and quality demands. However, high initial investment costs and the need for specialized expertise can potentially hinder market growth in certain segments.
Dominant Regions & Segments in Asia Pacific Industrial Computed Tomography Market
China and Japan currently dominate the Asia Pacific industrial computed tomography market, driven by robust manufacturing sectors and significant investments in advanced technologies.
Key Drivers in Dominant Regions:
- China: Rapid industrialization, expanding manufacturing base, and government support for technological advancements.
- Japan: Strong presence of established industrial CT manufacturers, advanced technological capabilities, and high-quality standards.
Dominant Segments:
- By Application: Flaw detection and inspection is the largest segment, accounting for approximately xx% of the market. Failure analysis is a rapidly growing segment, driven by the increasing need for detailed root cause analysis.
- By End-User Industry: The automotive and electronics industries represent significant market shares, owing to high-volume production and the need for stringent quality control. The aerospace industry is another significant segment due to the critical nature of safety and reliability standards.
Asia Pacific Industrial Computed Tomography Market Product Innovations
Recent product innovations in the Asia Pacific industrial computed tomography market are focused on enhancing speed, resolution, and ease of use. The introduction of systems like Shimadzu's XSeeker 8000, a compact and lightweight benchtop system, and Omron's VT-X750-V3, a high-speed inspection device, showcases this trend. These innovations expand the accessibility and capabilities of CT technology across various applications and manufacturing processes. The market is witnessing a shift towards more user-friendly software interfaces and automation features, aimed at reducing operational complexities and improving productivity.
Report Scope & Segmentation Analysis
This report provides a comprehensive segmentation of the Asia Pacific industrial computed tomography market:
By Application:
- Flaw Detection and Inspection: This segment is expected to maintain significant growth due to the increasing demand for high-quality products across various industries. The market size is estimated at xx Million in 2025 and is projected to reach xx Million by 2033.
- Failure Analysis: This segment is witnessing rapid growth driven by the need for detailed root-cause analysis to improve product reliability. The market size is estimated at xx Million in 2025 and is projected to reach xx Million by 2033.
- Assembly Analysis: This segment shows steady growth fueled by the need to ensure proper component integration in complex assemblies. The market size is estimated at xx Million in 2025 and is projected to reach xx Million by 2033.
- Other Applications: This segment includes applications such as research and development and material characterization, expected to exhibit moderate growth. The market size is estimated at xx Million in 2025 and is projected to reach xx Million by 2033.
By End-User Industry:
- Aerospace: Stringent quality and safety regulations drive high demand, with a market size of xx Million in 2025, projected to reach xx Million by 2033.
- Automotive: High-volume production and increasing complexity of vehicle components fuel this segment, with a market size of xx Million in 2025, projected to reach xx Million by 2033.
- Electronics: Miniaturization of components and the need for precise inspection drive this market segment, with a market size of xx Million in 2025, projected to reach xx Million by 2033.
- Oil and Gas: This segment exhibits steady growth due to demand for non-destructive testing in exploration and production, with a market size of xx Million in 2025, projected to reach xx Million by 2033.
- Other End-User Industries: This includes sectors like medical devices and consumer goods, with a market size of xx Million in 2025, projected to reach xx Million by 2033.
Key Drivers of Asia Pacific Industrial Computed Tomography Market Growth
Several factors contribute to the growth of the Asia Pacific industrial computed tomography market:
- Increasing demand for higher quality and reliability: Businesses are increasingly focused on producing high-quality products to meet stringent regulatory standards. Industrial CT plays a critical role in ensuring product quality and reliability.
- Technological advancements: Continuous improvements in X-ray source technology, detectors, and image reconstruction algorithms are leading to better image quality, faster scan times, and enhanced analytical capabilities.
- Government initiatives: Many governments in the Asia Pacific region are promoting technological advancements and industrial development, leading to increased investments in advanced manufacturing techniques, thus further driving the demand for industrial CT systems.
Challenges in the Asia Pacific Industrial Computed Tomography Market Sector
Despite the promising growth outlook, the Asia Pacific industrial computed tomography market faces several challenges:
- High initial investment costs: The high cost of purchasing and maintaining industrial CT systems can be a significant barrier to entry for small and medium-sized enterprises.
- Shortage of skilled professionals: Operating and interpreting the data from industrial CT systems requires specialized training and expertise, which can be a constraint in some regions.
- Competition from alternative NDT methods: Other non-destructive testing methods offer lower costs, though often with reduced precision, and present competition for industrial CT systems.
Emerging Opportunities in Asia Pacific Industrial Computed Tomography Market
The Asia Pacific industrial computed tomography market presents several emerging opportunities:
- Growing adoption in emerging economies: The rising industrialization in several emerging economies in the region presents significant growth potential for industrial CT systems.
- Integration with AI and machine learning: The integration of artificial intelligence and machine learning techniques into CT systems promises to enhance analytical capabilities, leading to faster and more accurate results.
- Development of specialized applications: There are opportunities to develop specialized applications for industrial CT in niche sectors, such as medical devices, microelectronics, and advanced materials.
Leading Players in the Asia Pacific Industrial Computed Tomography Market
Key Developments in Asia Pacific Industrial Computed Tomography Market Industry
- May 2022: Shimadzu Corporation launched the XSeeker 8000 benchtop X-ray CT system, a compact and lightweight system offering high-quality imaging for various samples. This launch significantly expands the accessibility of CT technology to smaller businesses and laboratories.
- November 2021: Omron Corporation unveiled the VT-X750-V3, claimed to be the fastest CT-type X-ray inspection device. This advancement improves productivity and quality control, particularly beneficial for high-volume electronics manufacturing.
Future Outlook for Asia Pacific Industrial Computed Tomography Market
The Asia Pacific industrial computed tomography market is poised for continued growth, driven by technological advancements, increasing demand for quality control, and expansion into new applications. The market is expected to witness further consolidation through mergers and acquisitions, along with innovation in software and automation capabilities. The integration of AI and machine learning will unlock new opportunities for enhanced image analysis and improved decision-making. The adoption of industrial CT is expected to accelerate across diverse sectors, solidifying its position as a crucial technology for advanced manufacturing and quality assurance.
Asia Pacific Industrial Computed Tomography Market Segmentation
-
1. Application
- 1.1. Flaw Detection and Inspection
- 1.2. Failure Analysis
- 1.3. Assembly Analysis
- 1.4. Other Applications
-
2. End-User Industry
- 2.1. Aerospace
- 2.2. Automotive
- 2.3. Electronics
- 2.4. Oil and Gas
- 2.5. Other End-User Industries
Asia Pacific Industrial Computed Tomography Market Segmentation By Geography
-
1. Asia Pacific
- 1.1. China
- 1.2. Japan
- 1.3. South Korea
- 1.4. India
- 1.5. Australia
- 1.6. New Zealand
- 1.7. Indonesia
- 1.8. Malaysia
- 1.9. Singapore
- 1.10. Thailand
- 1.11. Vietnam
- 1.12. Philippines
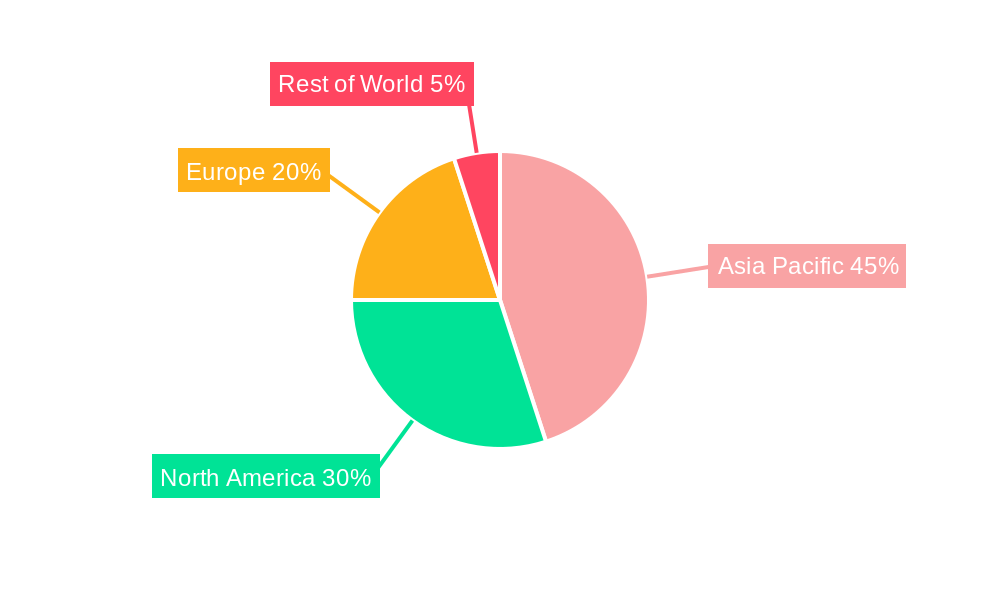
Asia Pacific Industrial Computed Tomography Market Regional Market Share
Geographic Coverage of Asia Pacific Industrial Computed Tomography Market
Asia Pacific Industrial Computed Tomography Market REPORT HIGHLIGHTS
| Aspects | Details |
|---|---|
| Study Period | 2020-2034 |
| Base Year | 2025 |
| Estimated Year | 2026 |
| Forecast Period | 2026-2034 |
| Historical Period | 2020-2025 |
| Growth Rate | CAGR of 19.04% from 2020-2034 |
| Segmentation |
|
Table of Contents
- 1. Introduction
- 1.1. Research Scope
- 1.2. Market Segmentation
- 1.3. Research Objective
- 1.4. Definitions and Assumptions
- 2. Executive Summary
- 2.1. Market Snapshot
- 3. Market Dynamics
- 3.1. Market Drivers
- 3.2. Market Restrains
- 3.3. Market Trends
- 3.4. Market Opportunities
- 4. Market Factor Analysis
- 4.1. Porters Five Forces
- 4.1.1. Bargaining Power of Suppliers
- 4.1.2. Bargaining Power of Buyers
- 4.1.3. Threat of New Entrants
- 4.1.4. Threat of Substitutes
- 4.1.5. Competitive Rivalry
- 4.2. PESTEL analysis
- 4.3. BCG Analysis
- 4.3.1. Stars (High Growth, High Market Share)
- 4.3.2. Cash Cows (Low Growth, High Market Share)
- 4.3.3. Question Mark (High Growth, Low Market Share)
- 4.3.4. Dogs (Low Growth, Low Market Share)
- 4.4. Ansoff Matrix Analysis
- 4.5. Supply Chain Analysis
- 4.6. Regulatory Landscape
- 4.7. Current Market Potential and Opportunity Assessment (TAM–SAM–SOM Framework)
- 4.8. PRI Analyst Note
- 4.1. Porters Five Forces
- 5. Market Analysis, Insights and Forecast 2021-2033
- 5.1. Market Analysis, Insights and Forecast - by Application
- 5.1.1. Flaw Detection and Inspection
- 5.1.2. Failure Analysis
- 5.1.3. Assembly Analysis
- 5.1.4. Other Applications
- 5.2. Market Analysis, Insights and Forecast - by End-User Industry
- 5.2.1. Aerospace
- 5.2.2. Automotive
- 5.2.3. Electronics
- 5.2.4. Oil and Gas
- 5.2.5. Other End-User Industries
- 5.3. Market Analysis, Insights and Forecast - by Region
- 5.3.1. Asia Pacific
- 5.1. Market Analysis, Insights and Forecast - by Application
- 6. Asia Pacific Industrial Computed Tomography Market Analysis, Insights and Forecast, 2021-2033
- 6.1. Market Analysis, Insights and Forecast - by Application
- 6.1.1. Flaw Detection and Inspection
- 6.1.2. Failure Analysis
- 6.1.3. Assembly Analysis
- 6.1.4. Other Applications
- 6.2. Market Analysis, Insights and Forecast - by End-User Industry
- 6.2.1. Aerospace
- 6.2.2. Automotive
- 6.2.3. Electronics
- 6.2.4. Oil and Gas
- 6.2.5. Other End-User Industries
- 6.1. Market Analysis, Insights and Forecast - by Application
- 7. Competitive Analysis
- 7.1. Company Profiles
- 7.1.1 Comet Group Limited
- 7.1.1.1. Company Overview
- 7.1.1.2. Products
- 7.1.1.3. Company Financials
- 7.1.1.4. SWOT Analysis
- 7.1.2 Nikon Corporation
- 7.1.2.1. Company Overview
- 7.1.2.2. Products
- 7.1.2.3. Company Financials
- 7.1.2.4. SWOT Analysis
- 7.1.3 Hitachi Ltd
- 7.1.3.1. Company Overview
- 7.1.3.2. Products
- 7.1.3.3. Company Financials
- 7.1.3.4. SWOT Analysis
- 7.1.4 Zeiss International
- 7.1.4.1. Company Overview
- 7.1.4.2. Products
- 7.1.4.3. Company Financials
- 7.1.4.4. SWOT Analysis
- 7.1.5 Omron Corporation
- 7.1.5.1. Company Overview
- 7.1.5.2. Products
- 7.1.5.3. Company Financials
- 7.1.5.4. SWOT Analysis
- 7.1.6 Thermo Fischer Scientific Inc
- 7.1.6.1. Company Overview
- 7.1.6.2. Products
- 7.1.6.3. Company Financials
- 7.1.6.4. SWOT Analysis
- 7.1.7 Shimadzu Corporation
- 7.1.7.1. Company Overview
- 7.1.7.2. Products
- 7.1.7.3. Company Financials
- 7.1.7.4. SWOT Analysis
- 7.1.8 Waygate Technologies (Baker Hughes Digital Solutions GmbH)
- 7.1.8.1. Company Overview
- 7.1.8.2. Products
- 7.1.8.3. Company Financials
- 7.1.8.4. SWOT Analysis
- 7.1.9 Bruker Corporation
- 7.1.9.1. Company Overview
- 7.1.9.2. Products
- 7.1.9.3. Company Financials
- 7.1.9.4. SWOT Analysis
- 7.1.10 Shimadzu Corporation
- 7.1.10.1. Company Overview
- 7.1.10.2. Products
- 7.1.10.3. Company Financials
- 7.1.10.4. SWOT Analysis
- 7.1.1 Comet Group Limited
- 7.2. Market Entropy
- 7.2.1 Company's Key Areas Served
- 7.2.2 Recent Developments
- 7.3. Company Market Share Analysis 2025
- 7.3.1 Top 5 Companies Market Share Analysis
- 7.3.2 Top 3 Companies Market Share Analysis
- 7.4. List of Potential Customers
- 8. Research Methodology
List of Figures
- Figure 1: Asia Pacific Industrial Computed Tomography Market Revenue Breakdown (million, %) by Product 2025 & 2033
- Figure 2: Asia Pacific Industrial Computed Tomography Market Share (%) by Company 2025
List of Tables
- Table 1: Asia Pacific Industrial Computed Tomography Market Revenue million Forecast, by Application 2020 & 2033
- Table 2: Asia Pacific Industrial Computed Tomography Market Revenue million Forecast, by End-User Industry 2020 & 2033
- Table 3: Asia Pacific Industrial Computed Tomography Market Revenue million Forecast, by Region 2020 & 2033
- Table 4: Asia Pacific Industrial Computed Tomography Market Revenue million Forecast, by Application 2020 & 2033
- Table 5: Asia Pacific Industrial Computed Tomography Market Revenue million Forecast, by End-User Industry 2020 & 2033
- Table 6: Asia Pacific Industrial Computed Tomography Market Revenue million Forecast, by Country 2020 & 2033
- Table 7: China Asia Pacific Industrial Computed Tomography Market Revenue (million) Forecast, by Application 2020 & 2033
- Table 8: Japan Asia Pacific Industrial Computed Tomography Market Revenue (million) Forecast, by Application 2020 & 2033
- Table 9: South Korea Asia Pacific Industrial Computed Tomography Market Revenue (million) Forecast, by Application 2020 & 2033
- Table 10: India Asia Pacific Industrial Computed Tomography Market Revenue (million) Forecast, by Application 2020 & 2033
- Table 11: Australia Asia Pacific Industrial Computed Tomography Market Revenue (million) Forecast, by Application 2020 & 2033
- Table 12: New Zealand Asia Pacific Industrial Computed Tomography Market Revenue (million) Forecast, by Application 2020 & 2033
- Table 13: Indonesia Asia Pacific Industrial Computed Tomography Market Revenue (million) Forecast, by Application 2020 & 2033
- Table 14: Malaysia Asia Pacific Industrial Computed Tomography Market Revenue (million) Forecast, by Application 2020 & 2033
- Table 15: Singapore Asia Pacific Industrial Computed Tomography Market Revenue (million) Forecast, by Application 2020 & 2033
- Table 16: Thailand Asia Pacific Industrial Computed Tomography Market Revenue (million) Forecast, by Application 2020 & 2033
- Table 17: Vietnam Asia Pacific Industrial Computed Tomography Market Revenue (million) Forecast, by Application 2020 & 2033
- Table 18: Philippines Asia Pacific Industrial Computed Tomography Market Revenue (million) Forecast, by Application 2020 & 2033
Frequently Asked Questions
1. What is the projected Compound Annual Growth Rate (CAGR) of the Asia Pacific Industrial Computed Tomography Market?
The projected CAGR is approximately 19.04%.
2. Which companies are prominent players in the Asia Pacific Industrial Computed Tomography Market?
Key companies in the market include Comet Group Limited, Nikon Corporation, Hitachi Ltd, Zeiss International, Omron Corporation, Thermo Fischer Scientific Inc, Shimadzu Corporation, Waygate Technologies (Baker Hughes Digital Solutions GmbH), Bruker Corporation, Shimadzu Corporation.
3. What are the main segments of the Asia Pacific Industrial Computed Tomography Market?
The market segments include Application, End-User Industry.
4. Can you provide details about the market size?
The market size is estimated to be USD 536 million as of 2022.
5. What are some drivers contributing to market growth?
Rising Demand for Portable Radiography Equipment; Technology Advancements in Resolution and Image Processing.
6. What are the notable trends driving market growth?
Automotive to Gain Significant Growth in the Region.
7. Are there any restraints impacting market growth?
High Installation Cost and Longer ROI Period; Longer Replacement Cycle of Water Meters.
8. Can you provide examples of recent developments in the market?
May 2022 - Shimadzu Corporation announced the release of the XSeeker 8000 bench-top X-ray CT system. It is considered to be the smallest and lightest X-ray system. It offers clear images of a variety of samples, from resin molded parts to aluminum die cast and other metallic elements.
9. What pricing options are available for accessing the report?
Pricing options include single-user, multi-user, and enterprise licenses priced at USD 4750, USD 5250, and USD 8750 respectively.
10. Is the market size provided in terms of value or volume?
The market size is provided in terms of value, measured in million.
11. Are there any specific market keywords associated with the report?
Yes, the market keyword associated with the report is "Asia Pacific Industrial Computed Tomography Market," which aids in identifying and referencing the specific market segment covered.
12. How do I determine which pricing option suits my needs best?
The pricing options vary based on user requirements and access needs. Individual users may opt for single-user licenses, while businesses requiring broader access may choose multi-user or enterprise licenses for cost-effective access to the report.
13. Are there any additional resources or data provided in the Asia Pacific Industrial Computed Tomography Market report?
While the report offers comprehensive insights, it's advisable to review the specific contents or supplementary materials provided to ascertain if additional resources or data are available.
14. How can I stay updated on further developments or reports in the Asia Pacific Industrial Computed Tomography Market?
To stay informed about further developments, trends, and reports in the Asia Pacific Industrial Computed Tomography Market, consider subscribing to industry newsletters, following relevant companies and organizations, or regularly checking reputable industry news sources and publications.
Methodology
Step 1 - Identification of Relevant Samples Size from Population Database


Step 2 - Approaches for Defining Global Market Size (Value, Volume* & Price*)

Note*: In applicable scenarios
Step 3 - Data Sources
Primary Research
- Web Analytics
- Survey Reports
- Research Institute
- Latest Research Reports
- Opinion Leaders
Secondary Research
- Annual Reports
- White Paper
- Latest Press Release
- Industry Association
- Paid Database
- Investor Presentations

Step 4 - Data Triangulation
Involves using different sources of information in order to increase the validity of a study
These sources are likely to be stakeholders in a program - participants, other researchers, program staff, other community members, and so on.
Then we put all data in single framework & apply various statistical tools to find out the dynamic on the market.
During the analysis stage, feedback from the stakeholder groups would be compared to determine areas of agreement as well as areas of divergence