

Key Insights
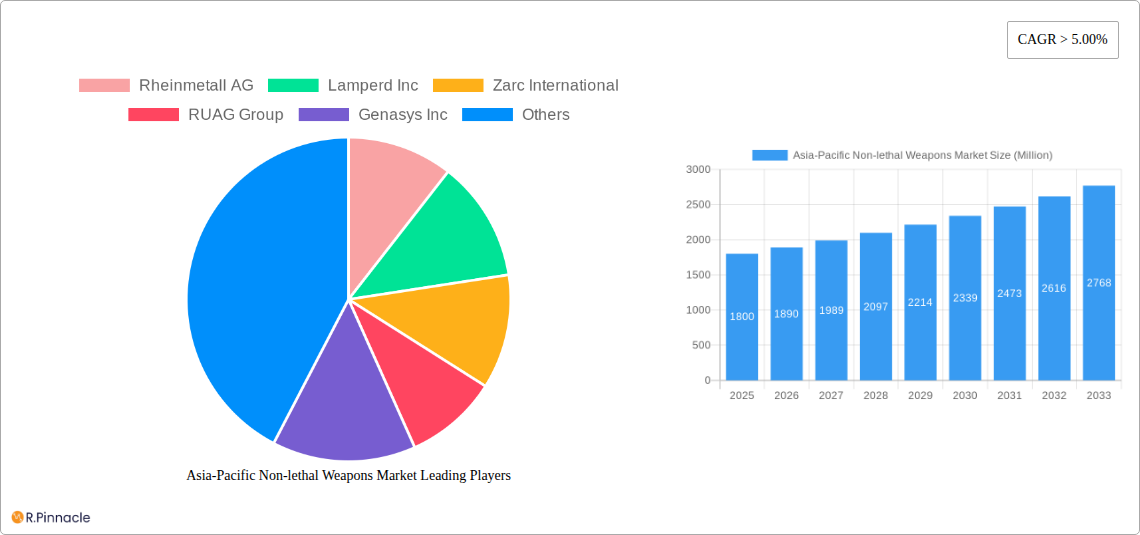
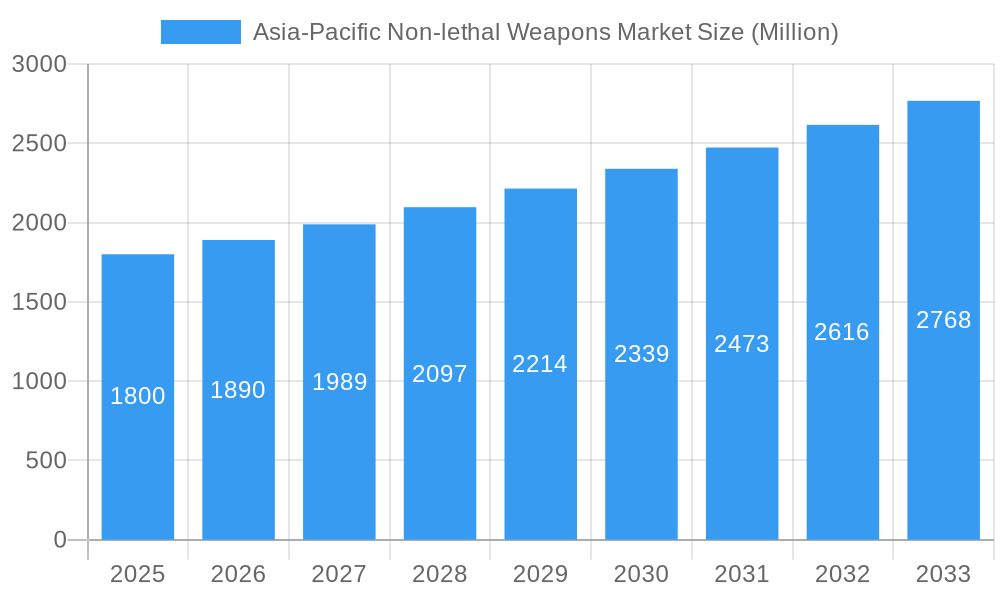
The Asia-Pacific non-lethal weapons market is experiencing significant expansion, driven by heightened demand for crowd control and riot management solutions. This growth is attributed to increasing geopolitical instability, rising security threats, and a focus on minimizing casualties during civil unrest. Key market segments include area denial systems, specialized ammunition, controlled demolition explosives, irritant gases and sprays, directed energy weapons, and electroshock devices. Primary consumers are law enforcement and military agencies involved in peacekeeping and internal security. With a projected Compound Annual Growth Rate (CAGR) exceeding 5%, the market size is estimated to reach $4.4 billion by the 2025 base year.
Asia-Pacific Non-lethal Weapons Market Market Size (In Billion)
Major contributors to market value in the Asia-Pacific region include China, India, and Japan, fueled by substantial investments in national security infrastructure. Continued technological advancements in non-lethal weapon efficacy and precision are expected to drive further adoption by governmental and military entities.
Asia-Pacific Non-lethal Weapons Market Company Market Share
Despite robust growth potential, the market faces challenges such as regulatory complexities and ethical considerations surrounding the deployment of certain non-lethal technologies. However, the prevailing demand for advanced security measures and casualty reduction strategies is expected to outweigh these obstacles. Leading companies are strategically investing in research and development to introduce innovative solutions, positioning themselves for sustained growth throughout the forecast period (2025-2033).
Asia-Pacific Non-lethal Weapons Market Analysis (2019-2033)
This comprehensive report offers critical insights into the Asia-Pacific non-lethal weapons market for industry stakeholders and investors. Covering the period 2019-2033, with a 2025 base year and a 2025-2033 forecast period, the study provides actionable intelligence on market dynamics, size, growth drivers, challenges, and future trends. The market is segmented by product type (Area Denial, Ammunition, Explosives, Gases and Sprays, Directed Energy Weapons, Electroshock Weapons) and application (Law Enforcement, Military). Leading companies featured include Rheinmetall AG, Axon, and others. The market is projected to reach a significant value by 2033.
Asia-Pacific Non-lethal Weapons Market Market Structure & Innovation Trends
The Asia-Pacific non-lethal weapons market exhibits a moderately concentrated structure, with a few dominant players and several smaller niche players. Market share dynamics are influenced by factors such as technological innovation, regulatory compliance, and strategic partnerships. Innovation in non-lethal technologies, driven by advancements in directed energy weapons and less-lethal ammunition, is a key growth driver. Regulatory frameworks vary across countries within the region, influencing market access and product adoption. Product substitutes, such as crowd control techniques that do not involve weaponry, pose a competitive challenge. The end-user demographics encompass law enforcement agencies, military forces, and private security firms. M&A activities are infrequent but significant, influencing market consolidation and competitive landscapes. Deal values have varied, with larger acquisitions occurring in the xx Million range in recent years.
- Market Concentration: Moderately concentrated with a few dominant players.
- Innovation Drivers: Advancements in directed energy weapons and less-lethal ammunition.
- Regulatory Frameworks: Vary significantly across Asia-Pacific nations.
- Product Substitutes: Crowd control techniques that do not involve weaponry.
- End-User Demographics: Law enforcement, military, and private security firms.
- M&A Activity: Infrequent but with deal values ranging up to xx Million.
Asia-Pacific Non-lethal Weapons Market Market Dynamics & Trends
The Asia-Pacific non-lethal weapons market is experiencing robust growth, driven by several key factors. Increasing instances of civil unrest and terrorism have heightened the demand for effective yet non-lethal crowd control solutions. Government investments in security infrastructure and the modernization of law enforcement agencies are significant catalysts for market expansion. Technological disruptions, such as the development of more precise and humane non-lethal weapons, are reshaping the market landscape. Consumer preferences are shifting towards technologies that minimize collateral damage and enhance situational awareness. Competitive dynamics are marked by both intense competition among established players and the emergence of innovative startups. The market is anticipated to experience a Compound Annual Growth Rate (CAGR) of xx% during the forecast period, with market penetration projected to reach xx% by 2033.
Dominant Regions & Segments in Asia-Pacific Non-lethal Weapons Market
The Asia-Pacific non-lethal weapons market is witnessing significant growth across several regions and segments. While specific data for precise regional dominance is unavailable, countries with higher levels of civil unrest and robust defense budgets are likely to dominate. Similarly, demand for specific weapon types varies significantly across the region, with demand for area denial systems high in certain politically unstable areas. The law enforcement segment is projected to hold a substantial share in terms of application, driven by the increasing need for effective crowd control and riot management solutions. Specific details for individual countries and segments are unavailable for public release.
- Key Drivers for Dominant Regions/Segments:
- High levels of civil unrest and terrorism.
- Significant government investments in security infrastructure.
- Modernization of law enforcement agencies.
- Stringent regulatory frameworks in certain countries.
Asia-Pacific Non-lethal Weapons Market Product Innovations
Recent advancements in non-lethal weapons technology have focused on enhancing precision, reducing collateral damage, and improving overall effectiveness. New products include improved tasers, more sophisticated crowd control systems, and advanced directed energy weapons that provide greater accuracy and less risk of injury. These innovations cater to the growing demand for safer and more effective non-lethal solutions, aligning perfectly with market needs for minimizing civilian casualties while maximizing crowd control efficacy.
Report Scope & Segmentation Analysis
This report segments the Asia-Pacific non-lethal weapons market by type and application. The Type segment includes: Area Denial, Ammunition, Explosives, Gases and Sprays, Directed Energy Weapons, and Electroshock Weapons. Each segment presents unique growth projections and market sizes with varying levels of competitive intensity. The Application segment comprises: Law Enforcement and Military, each possessing differing growth trajectories and specific market dynamics. Further detailed breakdown of market sizes and growth projections for each segment is available in the full report.
Key Drivers of Asia-Pacific Non-lethal Weapons Market Growth
Several factors are driving the growth of the Asia-Pacific non-lethal weapons market. Increased instances of civil unrest and terrorism are pushing governments to invest heavily in robust security solutions. The modernization of law enforcement agencies and the need for effective crowd control methods are also major contributing factors. Technological advancements, such as the development of more precise and less-lethal weapons, continue to fuel market growth. Furthermore, rising government budgets allocated to defense and security bolster market expansion significantly.
Challenges in the Asia-Pacific Non-lethal Weapons Market Sector
The Asia-Pacific non-lethal weapons market faces several challenges, including stringent regulatory hurdles that can impede product approvals and market entry. Supply chain disruptions and geopolitical instability can affect the availability of raw materials and manufacturing processes. Intense competition among established and emerging players further complicates market dynamics. The ethical concerns surrounding the use of certain non-lethal weapons also pose a significant challenge, impacting market acceptance and adoption rates.
Emerging Opportunities in Asia-Pacific Non-lethal Weapons Market
Several opportunities exist for growth within the Asia-Pacific non-lethal weapons market. The adoption of advanced technologies like AI and IoT integration into non-lethal weapons offers potential for enhanced efficiency and improved targeting accuracy. Untapped markets in certain regions with growing security needs present opportunities for market expansion. Furthermore, focusing on developing more humane and precise non-lethal weapons addresses growing ethical concerns and increases market acceptance.
Leading Players in the Asia-Pacific Non-lethal Weapons Market Market
- Rheinmetall AG
- Lamperd Inc
- Zarc International
- RUAG Group
- Genasys Inc
- AMTEC Less-Lethal Systems Inc
- PACEM Defense LLC
- Condor Non-lethal Technologies
- Axon (Taser International Inc)
Key Developments in Asia-Pacific Non-lethal Weapons Market Industry
- November 2022: China donated two water cannon trucks to the Royal Solomon Islands Police Force (RSIPF), strengthening its presence as a key security partner. This demonstrates the increasing role of non-lethal aid in international relations and showcases the market for area control equipment.
- January 2023: Intelligence reports indicate China is supplying non-lethal military aid to Russia. This signifies the potential for increased demand within the market due to geopolitical tensions and ongoing conflicts.
Future Outlook for Asia-Pacific Non-lethal Weapons Market Market
The Asia-Pacific non-lethal weapons market is poised for continued growth, driven by persistent geopolitical instability and the increasing need for effective crowd control solutions. Technological advancements and government investments in security infrastructure will further propel market expansion. The focus on developing more precise and humane non-lethal weapons will also contribute to market growth, addressing ethical concerns and enhancing overall acceptance. The market presents significant opportunities for both established players and emerging innovators.
Asia-Pacific Non-lethal Weapons Market Segmentation
-
1. Type
- 1.1. Area Denial
- 1.2. Ammunition
- 1.3. Explosives
- 1.4. Gases and Sprays
- 1.5. Directed Energy Weapons
- 1.6. Electroshock Weapons
-
2. Application
- 2.1. Law Enforcement
- 2.2. Military
-
3. Geography
-
3.1. Asia-Pacific
- 3.1.1. India
- 3.1.2. China
- 3.1.3. South Korea
- 3.1.4. Australia
- 3.1.5. Japan
- 3.1.6. Rest of Asia-Pacific
-
3.1. Asia-Pacific
Asia-Pacific Non-lethal Weapons Market Segmentation By Geography
-
1. Asia Pacific
- 1.1. India
- 1.2. China
- 1.3. South Korea
- 1.4. Australia
- 1.5. Japan
- 1.6. Rest of Asia Pacific
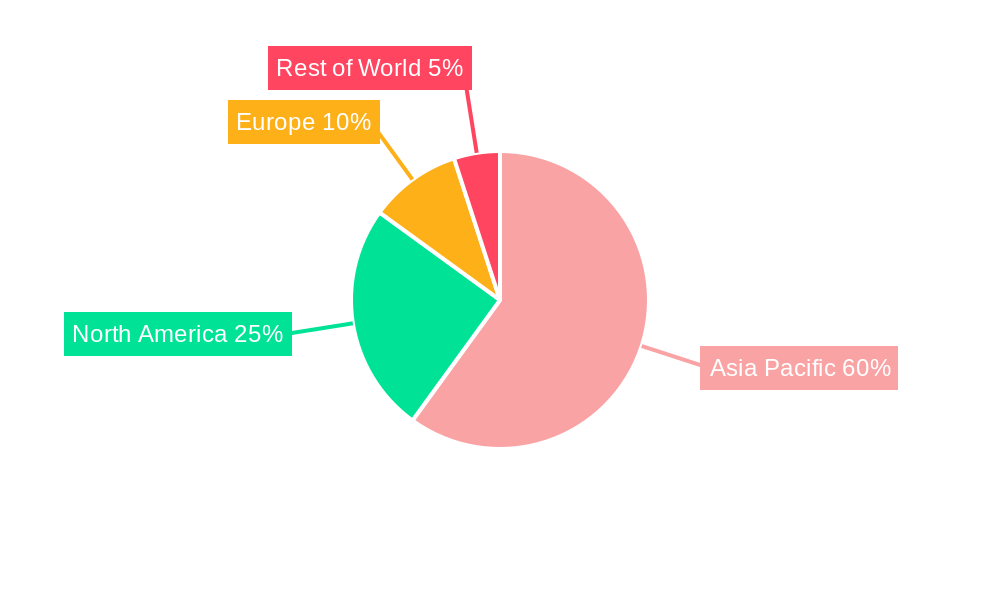
Asia-Pacific Non-lethal Weapons Market Regional Market Share
Geographic Coverage of Asia-Pacific Non-lethal Weapons Market
Asia-Pacific Non-lethal Weapons Market REPORT HIGHLIGHTS
| Aspects | Details |
|---|---|
| Study Period | 2020-2034 |
| Base Year | 2025 |
| Estimated Year | 2026 |
| Forecast Period | 2026-2034 |
| Historical Period | 2020-2025 |
| Growth Rate | CAGR of 5% from 2020-2034 |
| Segmentation |
|
Table of Contents
- 1. Introduction
- 1.1. Research Scope
- 1.2. Market Segmentation
- 1.3. Research Objective
- 1.4. Definitions and Assumptions
- 2. Executive Summary
- 2.1. Market Snapshot
- 3. Market Dynamics
- 3.1. Market Drivers
- 3.2. Market Restrains
- 3.3. Market Trends
- 3.4. Market Opportunities
- 4. Market Factor Analysis
- 4.1. Porters Five Forces
- 4.1.1. Bargaining Power of Suppliers
- 4.1.2. Bargaining Power of Buyers
- 4.1.3. Threat of New Entrants
- 4.1.4. Threat of Substitutes
- 4.1.5. Competitive Rivalry
- 4.2. PESTEL analysis
- 4.3. BCG Analysis
- 4.3.1. Stars (High Growth, High Market Share)
- 4.3.2. Cash Cows (Low Growth, High Market Share)
- 4.3.3. Question Mark (High Growth, Low Market Share)
- 4.3.4. Dogs (Low Growth, Low Market Share)
- 4.4. Ansoff Matrix Analysis
- 4.5. Supply Chain Analysis
- 4.6. Regulatory Landscape
- 4.7. Current Market Potential and Opportunity Assessment (TAM–SAM–SOM Framework)
- 4.8. PRI Analyst Note
- 4.1. Porters Five Forces
- 5. Market Analysis, Insights and Forecast 2021-2033
- 5.1. Market Analysis, Insights and Forecast - by Type
- 5.1.1. Area Denial
- 5.1.2. Ammunition
- 5.1.3. Explosives
- 5.1.4. Gases and Sprays
- 5.1.5. Directed Energy Weapons
- 5.1.6. Electroshock Weapons
- 5.2. Market Analysis, Insights and Forecast - by Application
- 5.2.1. Law Enforcement
- 5.2.2. Military
- 5.3. Market Analysis, Insights and Forecast - by Geography
- 5.3.1. Asia-Pacific
- 5.3.1.1. India
- 5.3.1.2. China
- 5.3.1.3. South Korea
- 5.3.1.4. Australia
- 5.3.1.5. Japan
- 5.3.1.6. Rest of Asia-Pacific
- 5.3.1. Asia-Pacific
- 5.4. Market Analysis, Insights and Forecast - by Region
- 5.4.1. Asia Pacific
- 5.1. Market Analysis, Insights and Forecast - by Type
- 6. Asia-Pacific Non-lethal Weapons Market Analysis, Insights and Forecast, 2021-2033
- 6.1. Market Analysis, Insights and Forecast - by Type
- 6.1.1. Area Denial
- 6.1.2. Ammunition
- 6.1.3. Explosives
- 6.1.4. Gases and Sprays
- 6.1.5. Directed Energy Weapons
- 6.1.6. Electroshock Weapons
- 6.2. Market Analysis, Insights and Forecast - by Application
- 6.2.1. Law Enforcement
- 6.2.2. Military
- 6.3. Market Analysis, Insights and Forecast - by Geography
- 6.3.1. Asia-Pacific
- 6.3.1.1. India
- 6.3.1.2. China
- 6.3.1.3. South Korea
- 6.3.1.4. Australia
- 6.3.1.5. Japan
- 6.3.1.6. Rest of Asia-Pacific
- 6.3.1. Asia-Pacific
- 6.1. Market Analysis, Insights and Forecast - by Type
- 7. Competitive Analysis
- 7.1. Company Profiles
- 7.1.1 Rheinmetall AG
- 7.1.1.1. Company Overview
- 7.1.1.2. Products
- 7.1.1.3. Company Financials
- 7.1.1.4. SWOT Analysis
- 7.1.2 Lamperd Inc
- 7.1.2.1. Company Overview
- 7.1.2.2. Products
- 7.1.2.3. Company Financials
- 7.1.2.4. SWOT Analysis
- 7.1.3 Zarc International
- 7.1.3.1. Company Overview
- 7.1.3.2. Products
- 7.1.3.3. Company Financials
- 7.1.3.4. SWOT Analysis
- 7.1.4 RUAG Group
- 7.1.4.1. Company Overview
- 7.1.4.2. Products
- 7.1.4.3. Company Financials
- 7.1.4.4. SWOT Analysis
- 7.1.5 Genasys Inc
- 7.1.5.1. Company Overview
- 7.1.5.2. Products
- 7.1.5.3. Company Financials
- 7.1.5.4. SWOT Analysis
- 7.1.6 AMTEC Less-Lethal Systems Inc (PACEM Defense LLC
- 7.1.6.1. Company Overview
- 7.1.6.2. Products
- 7.1.6.3. Company Financials
- 7.1.6.4. SWOT Analysis
- 7.1.7 Condor Non-lethal Technologies
- 7.1.7.1. Company Overview
- 7.1.7.2. Products
- 7.1.7.3. Company Financials
- 7.1.7.4. SWOT Analysis
- 7.1.8 Axon (Taser International Inc )
- 7.1.8.1. Company Overview
- 7.1.8.2. Products
- 7.1.8.3. Company Financials
- 7.1.8.4. SWOT Analysis
- 7.1.1 Rheinmetall AG
- 7.2. Market Entropy
- 7.2.1 Company's Key Areas Served
- 7.2.2 Recent Developments
- 7.3. Company Market Share Analysis 2025
- 7.3.1 Top 5 Companies Market Share Analysis
- 7.3.2 Top 3 Companies Market Share Analysis
- 7.4. List of Potential Customers
- 8. Research Methodology
List of Figures
- Figure 1: Asia-Pacific Non-lethal Weapons Market Revenue Breakdown (billion, %) by Product 2025 & 2033
- Figure 2: Asia-Pacific Non-lethal Weapons Market Share (%) by Company 2025
List of Tables
- Table 1: Asia-Pacific Non-lethal Weapons Market Revenue billion Forecast, by Type 2020 & 2033
- Table 2: Asia-Pacific Non-lethal Weapons Market Revenue billion Forecast, by Application 2020 & 2033
- Table 3: Asia-Pacific Non-lethal Weapons Market Revenue billion Forecast, by Geography 2020 & 2033
- Table 4: Asia-Pacific Non-lethal Weapons Market Revenue billion Forecast, by Region 2020 & 2033
- Table 5: Asia-Pacific Non-lethal Weapons Market Revenue billion Forecast, by Type 2020 & 2033
- Table 6: Asia-Pacific Non-lethal Weapons Market Revenue billion Forecast, by Application 2020 & 2033
- Table 7: Asia-Pacific Non-lethal Weapons Market Revenue billion Forecast, by Geography 2020 & 2033
- Table 8: Asia-Pacific Non-lethal Weapons Market Revenue billion Forecast, by Country 2020 & 2033
- Table 9: India Asia-Pacific Non-lethal Weapons Market Revenue (billion) Forecast, by Application 2020 & 2033
- Table 10: China Asia-Pacific Non-lethal Weapons Market Revenue (billion) Forecast, by Application 2020 & 2033
- Table 11: South Korea Asia-Pacific Non-lethal Weapons Market Revenue (billion) Forecast, by Application 2020 & 2033
- Table 12: Australia Asia-Pacific Non-lethal Weapons Market Revenue (billion) Forecast, by Application 2020 & 2033
- Table 13: Japan Asia-Pacific Non-lethal Weapons Market Revenue (billion) Forecast, by Application 2020 & 2033
- Table 14: Rest of Asia Pacific Asia-Pacific Non-lethal Weapons Market Revenue (billion) Forecast, by Application 2020 & 2033
Frequently Asked Questions
1. What is the projected Compound Annual Growth Rate (CAGR) of the Asia-Pacific Non-lethal Weapons Market?
The projected CAGR is approximately 5%.
2. Which companies are prominent players in the Asia-Pacific Non-lethal Weapons Market?
Key companies in the market include Rheinmetall AG, Lamperd Inc, Zarc International, RUAG Group, Genasys Inc, AMTEC Less-Lethal Systems Inc (PACEM Defense LLC, Condor Non-lethal Technologies, Axon (Taser International Inc ).
3. What are the main segments of the Asia-Pacific Non-lethal Weapons Market?
The market segments include Type, Application, Geography.
4. Can you provide details about the market size?
The market size is estimated to be USD 4.4 billion as of 2022.
5. What are some drivers contributing to market growth?
N/A
6. What are the notable trends driving market growth?
Ammunition Segment is Projected to Grow at a High Pace.
7. Are there any restraints impacting market growth?
N/A
8. Can you provide examples of recent developments in the market?
January 2023: China is providing non-lethal military aid to Russia for Moscow's use in Ukraine. A top-secret intelligence summary stated that Beijing had approved the incremental provision of weapons to Moscow,
9. What pricing options are available for accessing the report?
Pricing options include single-user, multi-user, and enterprise licenses priced at USD 4750, USD 5250, and USD 8750 respectively.
10. Is the market size provided in terms of value or volume?
The market size is provided in terms of value, measured in billion.
11. Are there any specific market keywords associated with the report?
Yes, the market keyword associated with the report is "Asia-Pacific Non-lethal Weapons Market," which aids in identifying and referencing the specific market segment covered.
12. How do I determine which pricing option suits my needs best?
The pricing options vary based on user requirements and access needs. Individual users may opt for single-user licenses, while businesses requiring broader access may choose multi-user or enterprise licenses for cost-effective access to the report.
13. Are there any additional resources or data provided in the Asia-Pacific Non-lethal Weapons Market report?
While the report offers comprehensive insights, it's advisable to review the specific contents or supplementary materials provided to ascertain if additional resources or data are available.
14. How can I stay updated on further developments or reports in the Asia-Pacific Non-lethal Weapons Market?
To stay informed about further developments, trends, and reports in the Asia-Pacific Non-lethal Weapons Market, consider subscribing to industry newsletters, following relevant companies and organizations, or regularly checking reputable industry news sources and publications.
Methodology
Step 1 - Identification of Relevant Samples Size from Population Database


Step 2 - Approaches for Defining Global Market Size (Value, Volume* & Price*)

Note*: In applicable scenarios
Step 3 - Data Sources
Primary Research
- Web Analytics
- Survey Reports
- Research Institute
- Latest Research Reports
- Opinion Leaders
Secondary Research
- Annual Reports
- White Paper
- Latest Press Release
- Industry Association
- Paid Database
- Investor Presentations

Step 4 - Data Triangulation
Involves using different sources of information in order to increase the validity of a study
These sources are likely to be stakeholders in a program - participants, other researchers, program staff, other community members, and so on.
Then we put all data in single framework & apply various statistical tools to find out the dynamic on the market.
During the analysis stage, feedback from the stakeholder groups would be compared to determine areas of agreement as well as areas of divergence