
Key Insights
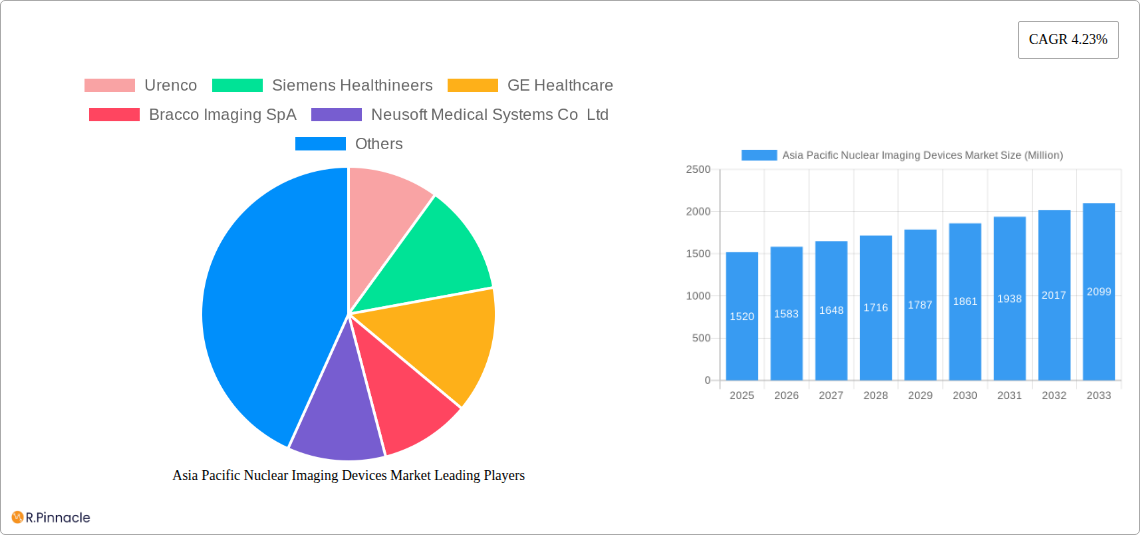
The Asia Pacific Nuclear Imaging Devices market, valued at $1.52 billion in 2025, is projected to experience robust growth, driven by a rising prevalence of chronic diseases like cancer and cardiovascular ailments necessitating early and accurate diagnosis. The market's Compound Annual Growth Rate (CAGR) of 4.23% from 2025 to 2033 indicates a steady expansion, fueled by technological advancements in PET and SPECT imaging, leading to improved image quality and diagnostic capabilities. Key growth drivers include increasing government initiatives to improve healthcare infrastructure, rising disposable incomes leading to increased healthcare spending, and a growing geriatric population more susceptible to these diseases. The market is segmented by product type (equipment, radioisotopes), with radioisotopes like Technetium-99m (Tc-99m) and Fluorine-18 (F-18) holding significant market share. Furthermore, the application segment is broadly categorized into SPECT and PET applications, each contributing to substantial market revenue. Within the Asia Pacific region, China, Japan, India, and South Korea are expected to be the major contributors to market growth due to their large populations and expanding healthcare sectors. While challenges exist, such as high equipment costs and regulatory hurdles, the overall market outlook remains positive due to the aforementioned growth drivers and increasing awareness about preventive healthcare.
The competitive landscape features a mix of established multinational corporations like Siemens Healthineers, GE Healthcare, and Philips alongside regional players. These companies are strategically focusing on product innovation, partnerships, and acquisitions to strengthen their market positions. The focus on developing advanced imaging technologies, coupled with the increasing demand for minimally invasive diagnostic procedures, promises to further accelerate market growth. The increasing adoption of hybrid imaging systems combining PET/CT and SPECT/CT is also a significant trend bolstering market expansion. The growing availability of skilled professionals and improving healthcare infrastructure further contribute to the positive outlook for the Asia Pacific Nuclear Imaging Devices market in the coming years.
This comprehensive report provides an in-depth analysis of the Asia Pacific Nuclear Imaging Devices Market, offering valuable insights for industry professionals, investors, and strategic decision-makers. Covering the period 2019-2033, with a base year of 2025 and a forecast period of 2025-2033, this report unveils the market's structure, dynamics, dominant segments, and future outlook.
Asia Pacific Nuclear Imaging Devices Market Structure & Innovation Trends
This section analyzes the market concentration, innovation drivers, regulatory landscape, product substitutes, end-user demographics, and mergers & acquisitions (M&A) activities within the Asia Pacific Nuclear Imaging Devices Market. The market is moderately concentrated, with key players holding significant market share. For example, Siemens Healthineers and GE Healthcare collectively hold an estimated xx% market share in 2025. Innovation is driven by advancements in radioisotope technology, improved imaging equipment, and the development of more sophisticated diagnostic applications. Regulatory frameworks vary across the Asia-Pacific region, impacting market access and product approvals. The market witnesses consistent M&A activity, with total deal values exceeding xx Million in the period 2019-2024. End-user demographics show a growing demand driven by an aging population and increasing prevalence of chronic diseases.
- Market Concentration: Moderately concentrated, with top players holding xx% market share (2025).
- Innovation Drivers: Advancements in radioisotope technology, improved imaging equipment, sophisticated diagnostic applications.
- Regulatory Frameworks: Vary across the region, impacting market access and product approvals.
- M&A Activity: Total deal value exceeded xx Million (2019-2024).
- End-User Demographics: Growing demand driven by aging population and increasing prevalence of chronic diseases.
Asia Pacific Nuclear Imaging Devices Market Dynamics & Trends
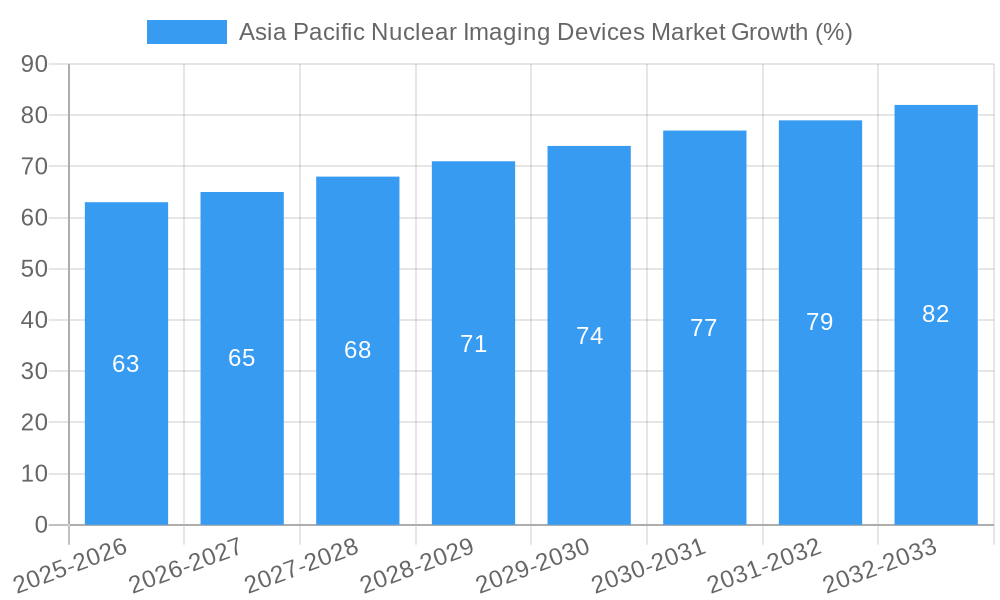
The Asia Pacific Nuclear Imaging Devices Market exhibits robust growth, driven by factors such as increasing healthcare expenditure, rising prevalence of chronic diseases requiring early diagnosis, technological advancements leading to improved image quality and faster scan times, and government initiatives promoting healthcare infrastructure development. The market is witnessing a shift towards advanced imaging modalities like PET scans, fueled by their superior diagnostic capabilities. Technological disruptions, such as the introduction of AI-powered image analysis tools, are further enhancing the market’s potential. Competitive dynamics are characterized by continuous product innovation, strategic partnerships, and expansion into new markets. The CAGR for the market is projected to be xx% during the forecast period (2025-2033), with market penetration expected to reach xx% by 2033.
Dominant Regions & Segments in Asia Pacific Nuclear Imaging Devices Market
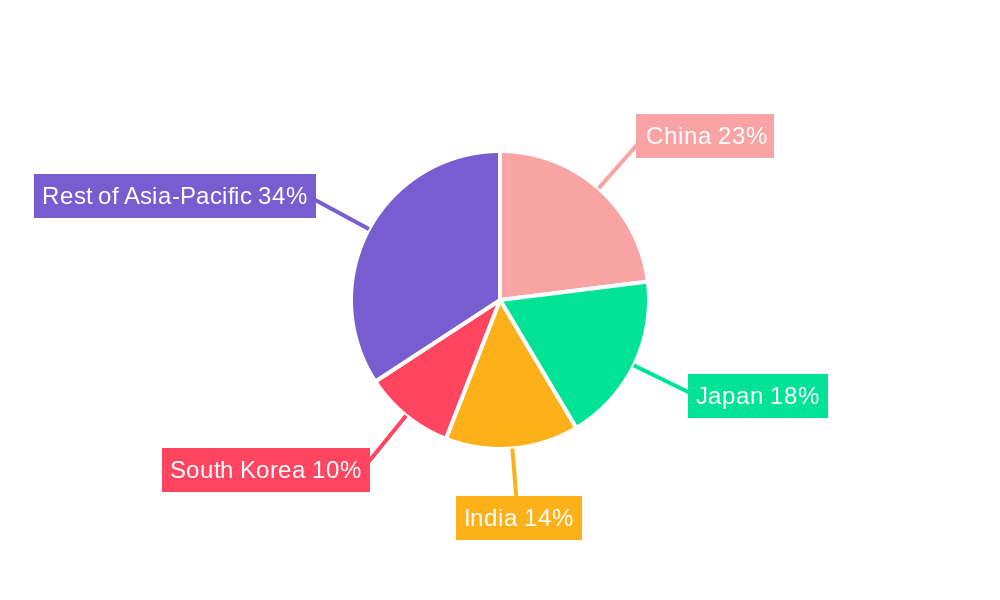
Japan, China, and Australia are the leading markets within the Asia Pacific region, driven by factors such as well-established healthcare infrastructure, high healthcare expenditure, and rising prevalence of target diseases. The Equipment segment dominates the Product Type category, followed by Radioisotopes. Within Radioisotopes, Technetium-99m (Tc-99m) holds the largest market share due to its widespread use in SPECT imaging. Similarly, SPECT Applications dominate the Application segment, owing to its established role in diagnosing cardiovascular and neurological diseases.
- Key Drivers for Dominant Regions:
- Japan: Advanced healthcare infrastructure, high healthcare expenditure.
- China: Rapid economic growth, increasing healthcare investment.
- Australia: Well-developed healthcare system, high per capita healthcare spending.
- Dominant Segments:
- Product Type: Equipment > Radioisotopes
- Radioisotope: Technetium-99m (Tc-99m) > Fluorine-18 (F-18)
- Application: SPECT Applications > PET Applications
Asia Pacific Nuclear Imaging Devices Market Product Innovations
Recent product innovations focus on enhancing image quality, reducing scan times, and improving patient comfort. This includes the development of hybrid imaging systems combining PET and CT or SPECT and CT, as well as the introduction of more efficient and user-friendly radioisotope production methods. These innovations are improving diagnostic accuracy, expanding applications, and enhancing the overall efficiency of nuclear imaging procedures.
Report Scope & Segmentation Analysis
This report segments the Asia Pacific Nuclear Imaging Devices Market by Product Type (Equipment, Radioisotopes), Radioisotope type (SPECT: Tc-99m, Tl-201, Ga-67, I-123, Other; PET: F-18, Rb-82, Other), and Application (SPECT Applications, PET Applications, Other Applications). Each segment's growth projections, market sizes, and competitive dynamics are analyzed in detail. The market is expected to witness significant growth across all segments, driven by technological advancements and increased demand for advanced diagnostic capabilities.
Key Drivers of Asia Pacific Nuclear Imaging Devices Market Growth
The market's growth is driven by several factors, including increasing prevalence of chronic diseases like cancer and cardiovascular diseases, rising healthcare expenditure, technological advancements leading to improved imaging technology, supportive government policies and initiatives promoting healthcare infrastructure development, and growing awareness about early diagnosis and treatment.
Challenges in the Asia Pacific Nuclear Imaging Devices Market Sector
Challenges include stringent regulatory approvals for new products, high initial investment costs associated with acquiring advanced imaging equipment, variations in healthcare infrastructure across different countries in the region, and potential supply chain disruptions impacting the availability of radioisotopes. These challenges, if not addressed effectively, could hamper the market's growth.
Emerging Opportunities in Asia Pacific Nuclear Imaging Devices Market
Emerging opportunities include the increasing adoption of hybrid imaging systems, growing demand for personalized medicine and targeted therapies, expansion of nuclear medicine services into underserved regions, and the development of AI-powered image analysis tools for improved diagnostic accuracy and efficiency.
Leading Players in the Asia Pacific Nuclear Imaging Devices Market Market
- Urenco
- Siemens Healthineers
- GE Healthcare
- Bracco Imaging SpA
- Neusoft Medical Systems Co Ltd
- Koninklijke Philips NV
- Canon Medical Systems Corporation
- Taiyo Nippon Sanso
- MiE GmbH
Key Developments in Asia Pacific Nuclear Imaging Devices Market Industry
- January 2023: Siemens Healthineers launched a new PET/CT scanner with enhanced image quality.
- June 2022: GE Healthcare announced a strategic partnership with a leading radiopharmaceutical company to expand its isotope supply chain.
- October 2021: Bracco Imaging SpA acquired a smaller imaging technology company, expanding its portfolio. (Further details on specific dates and impacts are needed for complete accuracy)
Future Outlook for Asia Pacific Nuclear Imaging Devices Market Market
The Asia Pacific Nuclear Imaging Devices Market is poised for significant growth in the coming years. Technological advancements, expanding healthcare infrastructure, rising prevalence of chronic diseases, and increased government support will drive market expansion. Strategic partnerships, product innovations, and market penetration into underserved areas will present significant opportunities for industry players.
Asia Pacific Nuclear Imaging Devices Market Segmentation
-
1. Product Type
- 1.1. Equipment
-
1.2. Radioisotope
-
1.2.1. SPECT Radioisotopes
- 1.2.1.1. Technetium-99m (TC-99m)
- 1.2.1.2. Thallium-201 (TI-201)
- 1.2.1.3. Gallium(Ga-67)
- 1.2.1.4. Iodine (I-123)
- 1.2.1.5. Other SPECT Radioisotopes
-
1.2.2. PET Radioisotopes
- 1.2.2.1. Fluorine-18 (F-18)
- 1.2.2.2. Rubidium-82 (RB-82)
- 1.2.2.3. Other PET Radioisotopes
-
1.2.1. SPECT Radioisotopes
-
2. Application
-
2.1. SPECT Applications
- 2.1.1. Cardiology
- 2.1.2. Neurology
- 2.1.3. Thyroid
- 2.1.4. Other SPECT Applications
-
2.2. PET Applications
- 2.2.1. Oncology
- 2.2.2. Other PET Applications
-
2.1. SPECT Applications
-
3. Geography
-
3.1. Asia-Pacific
- 3.1.1. China
- 3.1.2. Japan
- 3.1.3. India
- 3.1.4. Australia
- 3.1.5. South Korea
- 3.1.6. Rest of Asia-Pacific
-
3.1. Asia-Pacific
Asia Pacific Nuclear Imaging Devices Market Segmentation By Geography
-
1. Asia Pacific
- 1.1. China
- 1.2. Japan
- 1.3. India
- 1.4. Australia
- 1.5. South Korea
- 1.6. Rest of Asia Pacific
Asia Pacific Nuclear Imaging Devices Market REPORT HIGHLIGHTS
| Aspects | Details |
|---|---|
| Study Period | 2019-2033 |
| Base Year | 2024 |
| Estimated Year | 2025 |
| Forecast Period | 2025-2033 |
| Historical Period | 2019-2024 |
| Growth Rate | CAGR of 4.23% from 2019-2033 |
| Segmentation |
|
Table of Contents
- 1. Introduction
- 1.1. Research Scope
- 1.2. Market Segmentation
- 1.3. Research Methodology
- 1.4. Definitions and Assumptions
- 2. Executive Summary
- 2.1. Introduction
- 3. Market Dynamics
- 3.1. Introduction
- 3.2. Market Drivers
- 3.2.1. ; Rise in Prevalence of Cancer and Cardiac Disorders; Increase in Technological Advancements
- 3.3. Market Restrains
- 3.3.1. ; Limited Reimbursement and Stringent Regulatory Procedures
- 3.4. Market Trends
- 3.4.1. Cardiology is Expected to Hold the Highest Market Share in the Region
- 4. Market Factor Analysis
- 4.1. Porters Five Forces
- 4.2. Supply/Value Chain
- 4.3. PESTEL analysis
- 4.4. Market Entropy
- 4.5. Patent/Trademark Analysis
- 5. Asia Pacific Nuclear Imaging Devices Market Analysis, Insights and Forecast, 2019-2031
- 5.1. Market Analysis, Insights and Forecast - by Product Type
- 5.1.1. Equipment
- 5.1.2. Radioisotope
- 5.1.2.1. SPECT Radioisotopes
- 5.1.2.1.1. Technetium-99m (TC-99m)
- 5.1.2.1.2. Thallium-201 (TI-201)
- 5.1.2.1.3. Gallium(Ga-67)
- 5.1.2.1.4. Iodine (I-123)
- 5.1.2.1.5. Other SPECT Radioisotopes
- 5.1.2.2. PET Radioisotopes
- 5.1.2.2.1. Fluorine-18 (F-18)
- 5.1.2.2.2. Rubidium-82 (RB-82)
- 5.1.2.2.3. Other PET Radioisotopes
- 5.1.2.1. SPECT Radioisotopes
- 5.2. Market Analysis, Insights and Forecast - by Application
- 5.2.1. SPECT Applications
- 5.2.1.1. Cardiology
- 5.2.1.2. Neurology
- 5.2.1.3. Thyroid
- 5.2.1.4. Other SPECT Applications
- 5.2.2. PET Applications
- 5.2.2.1. Oncology
- 5.2.2.2. Other PET Applications
- 5.2.1. SPECT Applications
- 5.3. Market Analysis, Insights and Forecast - by Geography
- 5.3.1. Asia-Pacific
- 5.3.1.1. China
- 5.3.1.2. Japan
- 5.3.1.3. India
- 5.3.1.4. Australia
- 5.3.1.5. South Korea
- 5.3.1.6. Rest of Asia-Pacific
- 5.3.1. Asia-Pacific
- 5.4. Market Analysis, Insights and Forecast - by Region
- 5.4.1. Asia Pacific
- 5.1. Market Analysis, Insights and Forecast - by Product Type
- 6. China Asia Pacific Nuclear Imaging Devices Market Analysis, Insights and Forecast, 2019-2031
- 7. Japan Asia Pacific Nuclear Imaging Devices Market Analysis, Insights and Forecast, 2019-2031
- 8. India Asia Pacific Nuclear Imaging Devices Market Analysis, Insights and Forecast, 2019-2031
- 9. South Korea Asia Pacific Nuclear Imaging Devices Market Analysis, Insights and Forecast, 2019-2031
- 10. Taiwan Asia Pacific Nuclear Imaging Devices Market Analysis, Insights and Forecast, 2019-2031
- 11. Australia Asia Pacific Nuclear Imaging Devices Market Analysis, Insights and Forecast, 2019-2031
- 12. Rest of Asia-Pacific Asia Pacific Nuclear Imaging Devices Market Analysis, Insights and Forecast, 2019-2031
- 13. Competitive Analysis
- 13.1. Market Share Analysis 2024
- 13.2. Company Profiles
- 13.2.1 Urenco
- 13.2.1.1. Overview
- 13.2.1.2. Products
- 13.2.1.3. SWOT Analysis
- 13.2.1.4. Recent Developments
- 13.2.1.5. Financials (Based on Availability)
- 13.2.2 Siemens Healthineers
- 13.2.2.1. Overview
- 13.2.2.2. Products
- 13.2.2.3. SWOT Analysis
- 13.2.2.4. Recent Developments
- 13.2.2.5. Financials (Based on Availability)
- 13.2.3 GE Healthcare
- 13.2.3.1. Overview
- 13.2.3.2. Products
- 13.2.3.3. SWOT Analysis
- 13.2.3.4. Recent Developments
- 13.2.3.5. Financials (Based on Availability)
- 13.2.4 Bracco Imaging SpA
- 13.2.4.1. Overview
- 13.2.4.2. Products
- 13.2.4.3. SWOT Analysis
- 13.2.4.4. Recent Developments
- 13.2.4.5. Financials (Based on Availability)
- 13.2.5 Neusoft Medical Systems Co Ltd
- 13.2.5.1. Overview
- 13.2.5.2. Products
- 13.2.5.3. SWOT Analysis
- 13.2.5.4. Recent Developments
- 13.2.5.5. Financials (Based on Availability)
- 13.2.6 Koninklijke Philips NV
- 13.2.6.1. Overview
- 13.2.6.2. Products
- 13.2.6.3. SWOT Analysis
- 13.2.6.4. Recent Developments
- 13.2.6.5. Financials (Based on Availability)
- 13.2.7 Canon Medical Systems Corporation
- 13.2.7.1. Overview
- 13.2.7.2. Products
- 13.2.7.3. SWOT Analysis
- 13.2.7.4. Recent Developments
- 13.2.7.5. Financials (Based on Availability)
- 13.2.8 Taiyo Nippon Sanso
- 13.2.8.1. Overview
- 13.2.8.2. Products
- 13.2.8.3. SWOT Analysis
- 13.2.8.4. Recent Developments
- 13.2.8.5. Financials (Based on Availability)
- 13.2.9 MiE GmbH
- 13.2.9.1. Overview
- 13.2.9.2. Products
- 13.2.9.3. SWOT Analysis
- 13.2.9.4. Recent Developments
- 13.2.9.5. Financials (Based on Availability)
- 13.2.1 Urenco
List of Figures
- Figure 1: Asia Pacific Nuclear Imaging Devices Market Revenue Breakdown (Million, %) by Product 2024 & 2032
- Figure 2: Asia Pacific Nuclear Imaging Devices Market Share (%) by Company 2024
List of Tables
- Table 1: Asia Pacific Nuclear Imaging Devices Market Revenue Million Forecast, by Region 2019 & 2032
- Table 2: Asia Pacific Nuclear Imaging Devices Market Volume K Unit Forecast, by Region 2019 & 2032
- Table 3: Asia Pacific Nuclear Imaging Devices Market Revenue Million Forecast, by Product Type 2019 & 2032
- Table 4: Asia Pacific Nuclear Imaging Devices Market Volume K Unit Forecast, by Product Type 2019 & 2032
- Table 5: Asia Pacific Nuclear Imaging Devices Market Revenue Million Forecast, by Application 2019 & 2032
- Table 6: Asia Pacific Nuclear Imaging Devices Market Volume K Unit Forecast, by Application 2019 & 2032
- Table 7: Asia Pacific Nuclear Imaging Devices Market Revenue Million Forecast, by Geography 2019 & 2032
- Table 8: Asia Pacific Nuclear Imaging Devices Market Volume K Unit Forecast, by Geography 2019 & 2032
- Table 9: Asia Pacific Nuclear Imaging Devices Market Revenue Million Forecast, by Region 2019 & 2032
- Table 10: Asia Pacific Nuclear Imaging Devices Market Volume K Unit Forecast, by Region 2019 & 2032
- Table 11: Asia Pacific Nuclear Imaging Devices Market Revenue Million Forecast, by Country 2019 & 2032
- Table 12: Asia Pacific Nuclear Imaging Devices Market Volume K Unit Forecast, by Country 2019 & 2032
- Table 13: China Asia Pacific Nuclear Imaging Devices Market Revenue (Million) Forecast, by Application 2019 & 2032
- Table 14: China Asia Pacific Nuclear Imaging Devices Market Volume (K Unit) Forecast, by Application 2019 & 2032
- Table 15: Japan Asia Pacific Nuclear Imaging Devices Market Revenue (Million) Forecast, by Application 2019 & 2032
- Table 16: Japan Asia Pacific Nuclear Imaging Devices Market Volume (K Unit) Forecast, by Application 2019 & 2032
- Table 17: India Asia Pacific Nuclear Imaging Devices Market Revenue (Million) Forecast, by Application 2019 & 2032
- Table 18: India Asia Pacific Nuclear Imaging Devices Market Volume (K Unit) Forecast, by Application 2019 & 2032
- Table 19: South Korea Asia Pacific Nuclear Imaging Devices Market Revenue (Million) Forecast, by Application 2019 & 2032
- Table 20: South Korea Asia Pacific Nuclear Imaging Devices Market Volume (K Unit) Forecast, by Application 2019 & 2032
- Table 21: Taiwan Asia Pacific Nuclear Imaging Devices Market Revenue (Million) Forecast, by Application 2019 & 2032
- Table 22: Taiwan Asia Pacific Nuclear Imaging Devices Market Volume (K Unit) Forecast, by Application 2019 & 2032
- Table 23: Australia Asia Pacific Nuclear Imaging Devices Market Revenue (Million) Forecast, by Application 2019 & 2032
- Table 24: Australia Asia Pacific Nuclear Imaging Devices Market Volume (K Unit) Forecast, by Application 2019 & 2032
- Table 25: Rest of Asia-Pacific Asia Pacific Nuclear Imaging Devices Market Revenue (Million) Forecast, by Application 2019 & 2032
- Table 26: Rest of Asia-Pacific Asia Pacific Nuclear Imaging Devices Market Volume (K Unit) Forecast, by Application 2019 & 2032
- Table 27: Asia Pacific Nuclear Imaging Devices Market Revenue Million Forecast, by Product Type 2019 & 2032
- Table 28: Asia Pacific Nuclear Imaging Devices Market Volume K Unit Forecast, by Product Type 2019 & 2032
- Table 29: Asia Pacific Nuclear Imaging Devices Market Revenue Million Forecast, by Application 2019 & 2032
- Table 30: Asia Pacific Nuclear Imaging Devices Market Volume K Unit Forecast, by Application 2019 & 2032
- Table 31: Asia Pacific Nuclear Imaging Devices Market Revenue Million Forecast, by Geography 2019 & 2032
- Table 32: Asia Pacific Nuclear Imaging Devices Market Volume K Unit Forecast, by Geography 2019 & 2032
- Table 33: Asia Pacific Nuclear Imaging Devices Market Revenue Million Forecast, by Country 2019 & 2032
- Table 34: Asia Pacific Nuclear Imaging Devices Market Volume K Unit Forecast, by Country 2019 & 2032
- Table 35: China Asia Pacific Nuclear Imaging Devices Market Revenue (Million) Forecast, by Application 2019 & 2032
- Table 36: China Asia Pacific Nuclear Imaging Devices Market Volume (K Unit) Forecast, by Application 2019 & 2032
- Table 37: Japan Asia Pacific Nuclear Imaging Devices Market Revenue (Million) Forecast, by Application 2019 & 2032
- Table 38: Japan Asia Pacific Nuclear Imaging Devices Market Volume (K Unit) Forecast, by Application 2019 & 2032
- Table 39: India Asia Pacific Nuclear Imaging Devices Market Revenue (Million) Forecast, by Application 2019 & 2032
- Table 40: India Asia Pacific Nuclear Imaging Devices Market Volume (K Unit) Forecast, by Application 2019 & 2032
- Table 41: Australia Asia Pacific Nuclear Imaging Devices Market Revenue (Million) Forecast, by Application 2019 & 2032
- Table 42: Australia Asia Pacific Nuclear Imaging Devices Market Volume (K Unit) Forecast, by Application 2019 & 2032
- Table 43: South Korea Asia Pacific Nuclear Imaging Devices Market Revenue (Million) Forecast, by Application 2019 & 2032
- Table 44: South Korea Asia Pacific Nuclear Imaging Devices Market Volume (K Unit) Forecast, by Application 2019 & 2032
- Table 45: Rest of Asia Pacific Asia Pacific Nuclear Imaging Devices Market Revenue (Million) Forecast, by Application 2019 & 2032
- Table 46: Rest of Asia Pacific Asia Pacific Nuclear Imaging Devices Market Volume (K Unit) Forecast, by Application 2019 & 2032
Frequently Asked Questions
1. What is the projected Compound Annual Growth Rate (CAGR) of the Asia Pacific Nuclear Imaging Devices Market?
The projected CAGR is approximately 4.23%.
2. Which companies are prominent players in the Asia Pacific Nuclear Imaging Devices Market?
Key companies in the market include Urenco, Siemens Healthineers, GE Healthcare, Bracco Imaging SpA, Neusoft Medical Systems Co Ltd, Koninklijke Philips NV, Canon Medical Systems Corporation, Taiyo Nippon Sanso, MiE GmbH.
3. What are the main segments of the Asia Pacific Nuclear Imaging Devices Market?
The market segments include Product Type, Application, Geography.
4. Can you provide details about the market size?
The market size is estimated to be USD 1.52 Million as of 2022.
5. What are some drivers contributing to market growth?
; Rise in Prevalence of Cancer and Cardiac Disorders; Increase in Technological Advancements.
6. What are the notable trends driving market growth?
Cardiology is Expected to Hold the Highest Market Share in the Region.
7. Are there any restraints impacting market growth?
; Limited Reimbursement and Stringent Regulatory Procedures.
8. Can you provide examples of recent developments in the market?
N/A
9. What pricing options are available for accessing the report?
Pricing options include single-user, multi-user, and enterprise licenses priced at USD 4750, USD 5250, and USD 8750 respectively.
10. Is the market size provided in terms of value or volume?
The market size is provided in terms of value, measured in Million and volume, measured in K Unit.
11. Are there any specific market keywords associated with the report?
Yes, the market keyword associated with the report is "Asia Pacific Nuclear Imaging Devices Market," which aids in identifying and referencing the specific market segment covered.
12. How do I determine which pricing option suits my needs best?
The pricing options vary based on user requirements and access needs. Individual users may opt for single-user licenses, while businesses requiring broader access may choose multi-user or enterprise licenses for cost-effective access to the report.
13. Are there any additional resources or data provided in the Asia Pacific Nuclear Imaging Devices Market report?
While the report offers comprehensive insights, it's advisable to review the specific contents or supplementary materials provided to ascertain if additional resources or data are available.
14. How can I stay updated on further developments or reports in the Asia Pacific Nuclear Imaging Devices Market?
To stay informed about further developments, trends, and reports in the Asia Pacific Nuclear Imaging Devices Market, consider subscribing to industry newsletters, following relevant companies and organizations, or regularly checking reputable industry news sources and publications.
Methodology
Step 1 - Identification of Relevant Samples Size from Population Database


Step 2 - Approaches for Defining Global Market Size (Value, Volume* & Price*)

Note*: In applicable scenarios
Step 3 - Data Sources
Primary Research
- Web Analytics
- Survey Reports
- Research Institute
- Latest Research Reports
- Opinion Leaders
Secondary Research
- Annual Reports
- White Paper
- Latest Press Release
- Industry Association
- Paid Database
- Investor Presentations

Step 4 - Data Triangulation
Involves using different sources of information in order to increase the validity of a study
These sources are likely to be stakeholders in a program - participants, other researchers, program staff, other community members, and so on.
Then we put all data in single framework & apply various statistical tools to find out the dynamic on the market.
During the analysis stage, feedback from the stakeholder groups would be compared to determine areas of agreement as well as areas of divergence


