
Key Insights
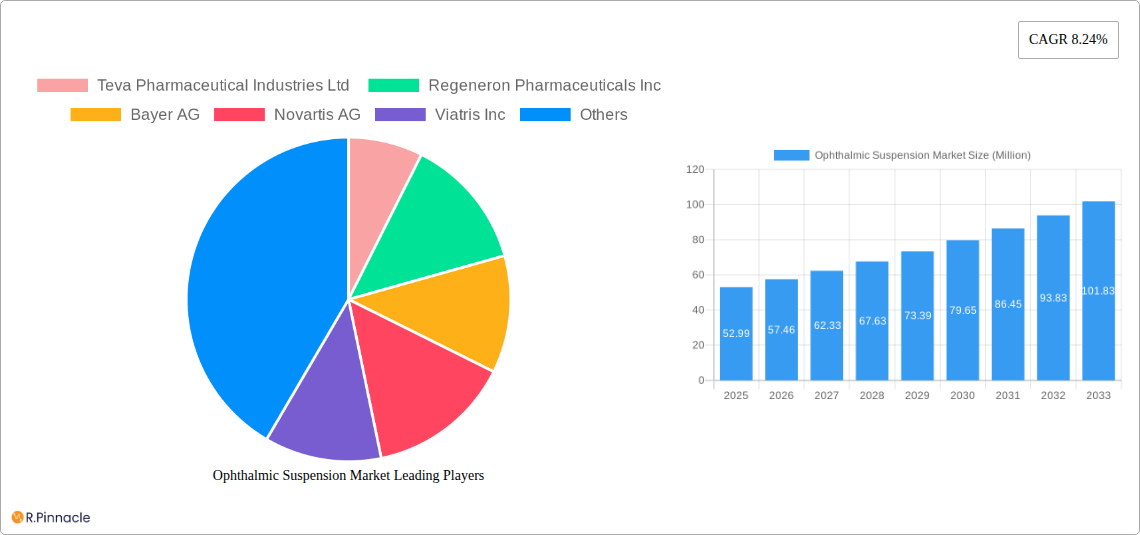
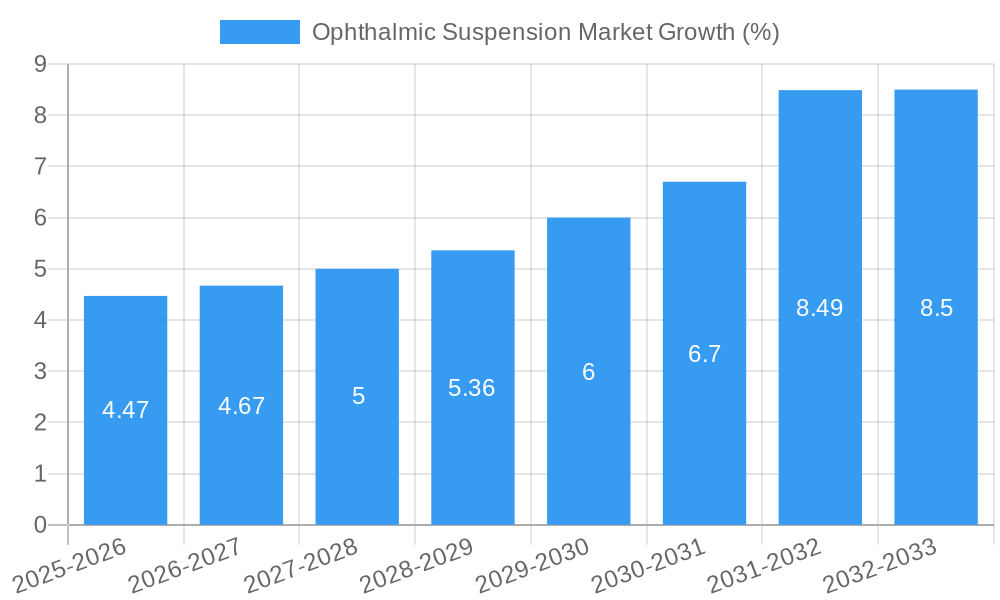
The ophthalmic suspension market, valued at $52.99 million in 2025, is projected to experience robust growth, driven by a rising prevalence of eye diseases like glaucoma, dry eye syndrome, and allergies. This growth is further fueled by an aging global population, increasing healthcare expenditure, and advancements in ophthalmic drug delivery systems offering improved efficacy and patient compliance. The market is segmented by drug class (anti-glaucoma, dry eye, anti-allergy/inflammatory, retinal, anti-infective, and others) and product type (OTC and prescription drugs). Prescription drugs currently dominate the market, reflecting the severity of many eye conditions requiring medical intervention. Key players like Teva Pharmaceutical Industries, Regeneron Pharmaceuticals, Bayer, Novartis, and Alcon are actively involved in research and development, driving innovation and competition within the sector. Geographic expansion, particularly in emerging markets with growing healthcare awareness, presents significant opportunities for market growth. However, the market faces constraints such as high drug prices, stringent regulatory approvals, and the potential for generic competition impacting profitability. The 8.24% CAGR projected from 2025 to 2033 suggests a substantial market expansion over the forecast period.
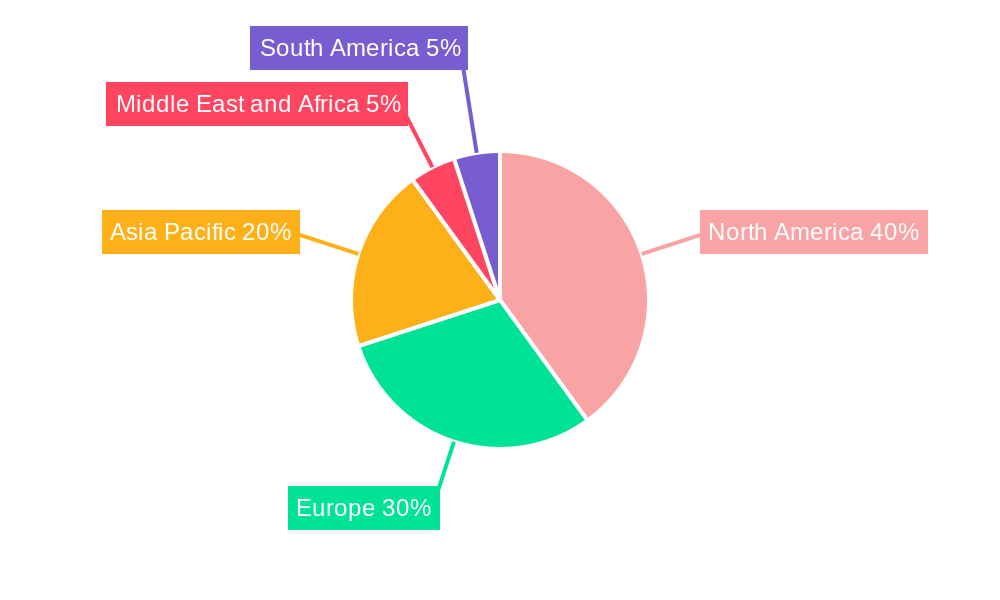
The regional distribution of the ophthalmic suspension market is expected to show a considerable concentration in North America and Europe due to higher healthcare spending and advanced medical infrastructure. However, the Asia Pacific region is projected to demonstrate the fastest growth rate owing to a burgeoning population, increasing prevalence of eye diseases, and rising disposable incomes. This presents a lucrative opportunity for pharmaceutical companies to expand their market reach and cater to the unmet needs in developing economies. Strategic partnerships, mergers and acquisitions, and focused marketing campaigns tailored to specific regional needs are key strategies employed by market players to maintain a competitive edge and maximize their market share. The introduction of novel drug formulations and improved delivery systems will further enhance market growth and improve patient outcomes in the coming years.
Ophthalmic Suspension Market Report: 2019-2033
This comprehensive report provides a detailed analysis of the Ophthalmic Suspension Market, offering invaluable insights for industry professionals, investors, and strategic decision-makers. The study period covers 2019-2033, with 2025 as the base year and a forecast period spanning 2025-2033. The report utilizes a robust methodology, incorporating historical data (2019-2024) and expert projections to deliver accurate and actionable market intelligence. The global market size is projected to reach xx Million by 2033.
Ophthalmic Suspension Market Structure & Innovation Trends
The Ophthalmic Suspension Market is characterized by a moderately consolidated structure, with several key players holding significant market share. Top companies such as Teva Pharmaceutical Industries Ltd, Regeneron Pharmaceuticals Inc, Bayer AG, Novartis AG, and Alcon are driving innovation and shaping market dynamics. The market exhibits high competition, fueled by continuous product innovation and a strong focus on R&D. Innovation is primarily driven by the need for improved efficacy, reduced side effects, and the development of targeted therapies for specific ophthalmic conditions. Regulatory frameworks, including FDA approvals and international guidelines, significantly impact market growth and product launches. The market also sees substantial M&A activity. For instance, Théa Pharma's acquisition of seven ophthalmic products in March 2022 demonstrates the strategic importance of consolidation within the sector. The estimated value of this deal is xx Million. Substitute products, such as topical gels and ointments, exist but generally offer less convenient administration or comparable efficacy. The end-user demographics are primarily focused on the aging population, a key driver of growth due to increased prevalence of age-related eye diseases.
Ophthalmic Suspension Market Dynamics & Trends
The Ophthalmic Suspension Market is experiencing robust growth, projected at a CAGR of xx% during the forecast period (2025-2033). Several factors contribute to this positive trajectory. Increased prevalence of chronic eye diseases like glaucoma and dry eye is a major driver, alongside rising healthcare expenditure and improved access to healthcare services. Technological advancements, such as the development of novel drug delivery systems and personalized therapies, are further propelling market growth. Changing consumer preferences towards convenient and effective treatments are also shaping market demand. Intense competition among established players and emerging companies fuels innovation and drives prices, leading to market penetration of new and improved products.
Dominant Regions & Segments in Ophthalmic Suspension Market
The North American region currently dominates the Ophthalmic Suspension Market, driven by high healthcare expenditure, a large aging population, and robust regulatory frameworks supporting innovation and new product approvals. Within the drug classes, Anti-glaucoma Drugs and Dry Eye Drugs are leading segments, reflecting the high prevalence of these conditions. Prescription Drugs constitute the largest product type segment due to the clinical requirement for many ophthalmic suspensions.
Key Drivers for North America:
- High healthcare expenditure
- Large geriatric population
- Strong regulatory support for innovation
- High awareness about eye health
Dominant Segments:
- Drug Class: Anti-glaucoma Drugs, Dry Eye Drugs
- Product Type: Prescription Drugs
The European market is also exhibiting significant growth, though at a slightly slower pace compared to North America. Asia-Pacific is projected to be a high-growth region in the coming years due to rising healthcare expenditure, and improving healthcare infrastructure.
Ophthalmic Suspension Market Product Innovations
Recent product innovations focus on improved drug delivery systems, enhanced efficacy, and reduced side effects. For instance, the development of nanotechnology-based drug delivery systems aims to improve drug penetration and reduce systemic absorption. The focus is on creating targeted therapies with improved patient compliance and enhanced therapeutic outcomes. This aligns with the broader trend towards personalized medicine in ophthalmology.
Report Scope & Segmentation Analysis
This report segments the Ophthalmic Suspension Market by drug class (Anti-glaucoma Drugs, Dry Eye Drugs, Ophthalmic Anti-allergy/Inflammatory, Retinal Drugs, Anti-infective Drugs, Other Drugs) and product type (OTC Drugs, Prescription Drugs). Each segment is analyzed in detail, providing growth projections, market sizes, and competitive dynamics. For example, the Anti-glaucoma Drugs segment is expected to exhibit significant growth due to the increasing prevalence of glaucoma. The Prescription Drugs segment is expected to maintain its dominance due to the prevalence of chronic eye conditions that demand continuous therapeutic intervention.
Key Drivers of Ophthalmic Suspension Market Growth
Several factors are driving the growth of the Ophthalmic Suspension Market. The aging global population, leading to increased prevalence of age-related eye diseases, is a key driver. Advances in technology, particularly in drug delivery systems and diagnostic tools, are enabling the development of more effective and convenient treatments. Increased healthcare expenditure and improved access to healthcare services also contribute significantly to market expansion. Finally, supportive government regulations and initiatives promoting eye health awareness are driving the market's trajectory.
Challenges in the Ophthalmic Suspension Market Sector
The Ophthalmic Suspension Market faces several challenges, including stringent regulatory approvals for new drugs, resulting in high R&D costs and prolonged timelines. Supply chain disruptions and fluctuations in raw material prices pose additional challenges. The high cost of treatment and lack of insurance coverage in several regions limit market penetration. Intense competition among established players and emerging companies also presents a significant challenge to smaller players.
Emerging Opportunities in Ophthalmic Suspension Market
Emerging markets in Asia-Pacific and Latin America present significant growth opportunities due to increasing healthcare expenditure and rising awareness about eye health. The development of novel drug delivery systems, such as nanotechnology-based formulations and biocompatible polymers, offers substantial opportunities for innovation. Personalized medicine and the use of big data in ophthalmology promise improved patient outcomes and treatment efficacy.
Leading Players in the Ophthalmic Suspension Market Market
- Teva Pharmaceutical Industries Ltd
- Regeneron Pharmaceuticals Inc
- Bayer AG
- Novartis AG
- Viatris Inc
- F Hoffmann-La Roche Ltd
- AbbVie (Allergan)
- Aerie Pharmaceuticals Inc
- Sun Pharmaceutical Industries Ltd
- Alcon
- Bausch Health Companies Inc
- Santen Pharmaceutical Co Ltd
Key Developments in Ophthalmic Suspension Market Industry
- April 2022: Sandoz (Novartis) launched a generic brimonidine/timolol eyedrop, competing with AbbVie's COMBIGAN.
- March 2022: Théa Pharma acquired seven branded ophthalmic products from Akorn Operating Company LLC, expanding its market share.
Future Outlook for Ophthalmic Suspension Market Market
The Ophthalmic Suspension Market is poised for continued growth, driven by technological advancements, increased prevalence of eye diseases, and rising healthcare expenditure. Strategic partnerships, focused R&D, and expansion into emerging markets will be crucial for success. The market is expected to witness a surge in demand for innovative therapies, personalized medicine approaches, and advanced drug delivery systems.
Ophthalmic Suspension Market Segmentation
-
1. Drug Class
- 1.1. Anti-glaucoma Drugs
- 1.2. Dry Eye Drugs
- 1.3. Ophthalmic Anti-allergy/Inflammatory
- 1.4. Retinal Drugs
- 1.5. Anti-infective Drugs
- 1.6. Other Drugs
-
2. Product Type
- 2.1. OTC Drugs
- 2.2. Prescription Drugs
Ophthalmic Suspension Market Segmentation By Geography
-
1. North America
- 1.1. United States
- 1.2. Canada
- 1.3. Mexico
-
2. Europe
- 2.1. Germany
- 2.2. United Kingdom
- 2.3. France
- 2.4. Italy
- 2.5. Spain
- 2.6. Rest of Europe
-
3. Asia Pacific
- 3.1. China
- 3.2. Japan
- 3.3. India
- 3.4. Australia
- 3.5. South Korea
- 3.6. Rest of Asia Pacific
-
4. Middle East and Africa
- 4.1. GCC
- 4.2. South Africa
- 4.3. Rest of Middle East and Africa
-
5. South America
- 5.1. Brazil
- 5.2. Argentina
- 5.3. Rest of South America
Ophthalmic Suspension Market REPORT HIGHLIGHTS
| Aspects | Details |
|---|---|
| Study Period | 2019-2033 |
| Base Year | 2024 |
| Estimated Year | 2025 |
| Forecast Period | 2025-2033 |
| Historical Period | 2019-2024 |
| Growth Rate | CAGR of 8.24% from 2019-2033 |
| Segmentation |
|
Table of Contents
- 1. Introduction
- 1.1. Research Scope
- 1.2. Market Segmentation
- 1.3. Research Methodology
- 1.4. Definitions and Assumptions
- 2. Executive Summary
- 2.1. Introduction
- 3. Market Dynamics
- 3.1. Introduction
- 3.2. Market Drivers
- 3.2.1. Increasing Incidence and Prevalence of Eye-related Disorders; Rising Research and Development Pertaining to the Development of Novel Drugs; Increasing Focus on Developing Combination Therapies
- 3.3. Market Restrains
- 3.3.1. Loss of Patent Protection for Popular Drugs; Lack of Health Insurance in the Developing Countries
- 3.4. Market Trends
- 3.4.1. The Anti-glaucoma Drug Segment under Drug Class is Expected to Hold a Significant Share in the Ophthalmic Drugs Market During the Forecast Period
- 4. Market Factor Analysis
- 4.1. Porters Five Forces
- 4.2. Supply/Value Chain
- 4.3. PESTEL analysis
- 4.4. Market Entropy
- 4.5. Patent/Trademark Analysis
- 5. Global Ophthalmic Suspension Market Analysis, Insights and Forecast, 2019-2031
- 5.1. Market Analysis, Insights and Forecast - by Drug Class
- 5.1.1. Anti-glaucoma Drugs
- 5.1.2. Dry Eye Drugs
- 5.1.3. Ophthalmic Anti-allergy/Inflammatory
- 5.1.4. Retinal Drugs
- 5.1.5. Anti-infective Drugs
- 5.1.6. Other Drugs
- 5.2. Market Analysis, Insights and Forecast - by Product Type
- 5.2.1. OTC Drugs
- 5.2.2. Prescription Drugs
- 5.3. Market Analysis, Insights and Forecast - by Region
- 5.3.1. North America
- 5.3.2. Europe
- 5.3.3. Asia Pacific
- 5.3.4. Middle East and Africa
- 5.3.5. South America
- 5.1. Market Analysis, Insights and Forecast - by Drug Class
- 6. North America Ophthalmic Suspension Market Analysis, Insights and Forecast, 2019-2031
- 6.1. Market Analysis, Insights and Forecast - by Drug Class
- 6.1.1. Anti-glaucoma Drugs
- 6.1.2. Dry Eye Drugs
- 6.1.3. Ophthalmic Anti-allergy/Inflammatory
- 6.1.4. Retinal Drugs
- 6.1.5. Anti-infective Drugs
- 6.1.6. Other Drugs
- 6.2. Market Analysis, Insights and Forecast - by Product Type
- 6.2.1. OTC Drugs
- 6.2.2. Prescription Drugs
- 6.1. Market Analysis, Insights and Forecast - by Drug Class
- 7. Europe Ophthalmic Suspension Market Analysis, Insights and Forecast, 2019-2031
- 7.1. Market Analysis, Insights and Forecast - by Drug Class
- 7.1.1. Anti-glaucoma Drugs
- 7.1.2. Dry Eye Drugs
- 7.1.3. Ophthalmic Anti-allergy/Inflammatory
- 7.1.4. Retinal Drugs
- 7.1.5. Anti-infective Drugs
- 7.1.6. Other Drugs
- 7.2. Market Analysis, Insights and Forecast - by Product Type
- 7.2.1. OTC Drugs
- 7.2.2. Prescription Drugs
- 7.1. Market Analysis, Insights and Forecast - by Drug Class
- 8. Asia Pacific Ophthalmic Suspension Market Analysis, Insights and Forecast, 2019-2031
- 8.1. Market Analysis, Insights and Forecast - by Drug Class
- 8.1.1. Anti-glaucoma Drugs
- 8.1.2. Dry Eye Drugs
- 8.1.3. Ophthalmic Anti-allergy/Inflammatory
- 8.1.4. Retinal Drugs
- 8.1.5. Anti-infective Drugs
- 8.1.6. Other Drugs
- 8.2. Market Analysis, Insights and Forecast - by Product Type
- 8.2.1. OTC Drugs
- 8.2.2. Prescription Drugs
- 8.1. Market Analysis, Insights and Forecast - by Drug Class
- 9. Middle East and Africa Ophthalmic Suspension Market Analysis, Insights and Forecast, 2019-2031
- 9.1. Market Analysis, Insights and Forecast - by Drug Class
- 9.1.1. Anti-glaucoma Drugs
- 9.1.2. Dry Eye Drugs
- 9.1.3. Ophthalmic Anti-allergy/Inflammatory
- 9.1.4. Retinal Drugs
- 9.1.5. Anti-infective Drugs
- 9.1.6. Other Drugs
- 9.2. Market Analysis, Insights and Forecast - by Product Type
- 9.2.1. OTC Drugs
- 9.2.2. Prescription Drugs
- 9.1. Market Analysis, Insights and Forecast - by Drug Class
- 10. South America Ophthalmic Suspension Market Analysis, Insights and Forecast, 2019-2031
- 10.1. Market Analysis, Insights and Forecast - by Drug Class
- 10.1.1. Anti-glaucoma Drugs
- 10.1.2. Dry Eye Drugs
- 10.1.3. Ophthalmic Anti-allergy/Inflammatory
- 10.1.4. Retinal Drugs
- 10.1.5. Anti-infective Drugs
- 10.1.6. Other Drugs
- 10.2. Market Analysis, Insights and Forecast - by Product Type
- 10.2.1. OTC Drugs
- 10.2.2. Prescription Drugs
- 10.1. Market Analysis, Insights and Forecast - by Drug Class
- 11. North America Ophthalmic Suspension Market Analysis, Insights and Forecast, 2019-2031
- 11.1. Market Analysis, Insights and Forecast - By Country/Sub-region
- 11.1.1 United States
- 11.1.2 Canada
- 11.1.3 Mexico
- 12. Europe Ophthalmic Suspension Market Analysis, Insights and Forecast, 2019-2031
- 12.1. Market Analysis, Insights and Forecast - By Country/Sub-region
- 12.1.1 Germany
- 12.1.2 United Kingdom
- 12.1.3 France
- 12.1.4 Italy
- 12.1.5 Spain
- 12.1.6 Rest of Europe
- 13. Asia Pacific Ophthalmic Suspension Market Analysis, Insights and Forecast, 2019-2031
- 13.1. Market Analysis, Insights and Forecast - By Country/Sub-region
- 13.1.1 China
- 13.1.2 Japan
- 13.1.3 India
- 13.1.4 Australia
- 13.1.5 South Korea
- 13.1.6 Rest of Asia Pacific
- 14. Middle East and Africa Ophthalmic Suspension Market Analysis, Insights and Forecast, 2019-2031
- 14.1. Market Analysis, Insights and Forecast - By Country/Sub-region
- 14.1.1 GCC
- 14.1.2 South Africa
- 14.1.3 Rest of Middle East and Africa
- 15. South America Ophthalmic Suspension Market Analysis, Insights and Forecast, 2019-2031
- 15.1. Market Analysis, Insights and Forecast - By Country/Sub-region
- 15.1.1 Brazil
- 15.1.2 Argentina
- 15.1.3 Rest of South America
- 16. Competitive Analysis
- 16.1. Global Market Share Analysis 2024
- 16.2. Company Profiles
- 16.2.1 Teva Pharmaceutical Industries Ltd
- 16.2.1.1. Overview
- 16.2.1.2. Products
- 16.2.1.3. SWOT Analysis
- 16.2.1.4. Recent Developments
- 16.2.1.5. Financials (Based on Availability)
- 16.2.2 Regeneron Pharmaceuticals Inc
- 16.2.2.1. Overview
- 16.2.2.2. Products
- 16.2.2.3. SWOT Analysis
- 16.2.2.4. Recent Developments
- 16.2.2.5. Financials (Based on Availability)
- 16.2.3 Bayer AG
- 16.2.3.1. Overview
- 16.2.3.2. Products
- 16.2.3.3. SWOT Analysis
- 16.2.3.4. Recent Developments
- 16.2.3.5. Financials (Based on Availability)
- 16.2.4 Novartis AG
- 16.2.4.1. Overview
- 16.2.4.2. Products
- 16.2.4.3. SWOT Analysis
- 16.2.4.4. Recent Developments
- 16.2.4.5. Financials (Based on Availability)
- 16.2.5 Viatris Inc
- 16.2.5.1. Overview
- 16.2.5.2. Products
- 16.2.5.3. SWOT Analysis
- 16.2.5.4. Recent Developments
- 16.2.5.5. Financials (Based on Availability)
- 16.2.6 F Hoffmann-La Roche Ltd
- 16.2.6.1. Overview
- 16.2.6.2. Products
- 16.2.6.3. SWOT Analysis
- 16.2.6.4. Recent Developments
- 16.2.6.5. Financials (Based on Availability)
- 16.2.7 AbbVie (Allergan)
- 16.2.7.1. Overview
- 16.2.7.2. Products
- 16.2.7.3. SWOT Analysis
- 16.2.7.4. Recent Developments
- 16.2.7.5. Financials (Based on Availability)
- 16.2.8 Aerie Pharmaceuticals Inc
- 16.2.8.1. Overview
- 16.2.8.2. Products
- 16.2.8.3. SWOT Analysis
- 16.2.8.4. Recent Developments
- 16.2.8.5. Financials (Based on Availability)
- 16.2.9 Sun Pharmaceutical Industries Ltd
- 16.2.9.1. Overview
- 16.2.9.2. Products
- 16.2.9.3. SWOT Analysis
- 16.2.9.4. Recent Developments
- 16.2.9.5. Financials (Based on Availability)
- 16.2.10 Alcon
- 16.2.10.1. Overview
- 16.2.10.2. Products
- 16.2.10.3. SWOT Analysis
- 16.2.10.4. Recent Developments
- 16.2.10.5. Financials (Based on Availability)
- 16.2.11 Bausch Health Companies Inc
- 16.2.11.1. Overview
- 16.2.11.2. Products
- 16.2.11.3. SWOT Analysis
- 16.2.11.4. Recent Developments
- 16.2.11.5. Financials (Based on Availability)
- 16.2.12 Santen Pharmaceutical Co Ltd
- 16.2.12.1. Overview
- 16.2.12.2. Products
- 16.2.12.3. SWOT Analysis
- 16.2.12.4. Recent Developments
- 16.2.12.5. Financials (Based on Availability)
- 16.2.1 Teva Pharmaceutical Industries Ltd
List of Figures
- Figure 1: Global Ophthalmic Suspension Market Revenue Breakdown (Million, %) by Region 2024 & 2032
- Figure 2: Global Ophthalmic Suspension Market Volume Breakdown (K Unit, %) by Region 2024 & 2032
- Figure 3: North America Ophthalmic Suspension Market Revenue (Million), by Country 2024 & 2032
- Figure 4: North America Ophthalmic Suspension Market Volume (K Unit), by Country 2024 & 2032
- Figure 5: North America Ophthalmic Suspension Market Revenue Share (%), by Country 2024 & 2032
- Figure 6: North America Ophthalmic Suspension Market Volume Share (%), by Country 2024 & 2032
- Figure 7: Europe Ophthalmic Suspension Market Revenue (Million), by Country 2024 & 2032
- Figure 8: Europe Ophthalmic Suspension Market Volume (K Unit), by Country 2024 & 2032
- Figure 9: Europe Ophthalmic Suspension Market Revenue Share (%), by Country 2024 & 2032
- Figure 10: Europe Ophthalmic Suspension Market Volume Share (%), by Country 2024 & 2032
- Figure 11: Asia Pacific Ophthalmic Suspension Market Revenue (Million), by Country 2024 & 2032
- Figure 12: Asia Pacific Ophthalmic Suspension Market Volume (K Unit), by Country 2024 & 2032
- Figure 13: Asia Pacific Ophthalmic Suspension Market Revenue Share (%), by Country 2024 & 2032
- Figure 14: Asia Pacific Ophthalmic Suspension Market Volume Share (%), by Country 2024 & 2032
- Figure 15: Middle East and Africa Ophthalmic Suspension Market Revenue (Million), by Country 2024 & 2032
- Figure 16: Middle East and Africa Ophthalmic Suspension Market Volume (K Unit), by Country 2024 & 2032
- Figure 17: Middle East and Africa Ophthalmic Suspension Market Revenue Share (%), by Country 2024 & 2032
- Figure 18: Middle East and Africa Ophthalmic Suspension Market Volume Share (%), by Country 2024 & 2032
- Figure 19: South America Ophthalmic Suspension Market Revenue (Million), by Country 2024 & 2032
- Figure 20: South America Ophthalmic Suspension Market Volume (K Unit), by Country 2024 & 2032
- Figure 21: South America Ophthalmic Suspension Market Revenue Share (%), by Country 2024 & 2032
- Figure 22: South America Ophthalmic Suspension Market Volume Share (%), by Country 2024 & 2032
- Figure 23: North America Ophthalmic Suspension Market Revenue (Million), by Drug Class 2024 & 2032
- Figure 24: North America Ophthalmic Suspension Market Volume (K Unit), by Drug Class 2024 & 2032
- Figure 25: North America Ophthalmic Suspension Market Revenue Share (%), by Drug Class 2024 & 2032
- Figure 26: North America Ophthalmic Suspension Market Volume Share (%), by Drug Class 2024 & 2032
- Figure 27: North America Ophthalmic Suspension Market Revenue (Million), by Product Type 2024 & 2032
- Figure 28: North America Ophthalmic Suspension Market Volume (K Unit), by Product Type 2024 & 2032
- Figure 29: North America Ophthalmic Suspension Market Revenue Share (%), by Product Type 2024 & 2032
- Figure 30: North America Ophthalmic Suspension Market Volume Share (%), by Product Type 2024 & 2032
- Figure 31: North America Ophthalmic Suspension Market Revenue (Million), by Country 2024 & 2032
- Figure 32: North America Ophthalmic Suspension Market Volume (K Unit), by Country 2024 & 2032
- Figure 33: North America Ophthalmic Suspension Market Revenue Share (%), by Country 2024 & 2032
- Figure 34: North America Ophthalmic Suspension Market Volume Share (%), by Country 2024 & 2032
- Figure 35: Europe Ophthalmic Suspension Market Revenue (Million), by Drug Class 2024 & 2032
- Figure 36: Europe Ophthalmic Suspension Market Volume (K Unit), by Drug Class 2024 & 2032
- Figure 37: Europe Ophthalmic Suspension Market Revenue Share (%), by Drug Class 2024 & 2032
- Figure 38: Europe Ophthalmic Suspension Market Volume Share (%), by Drug Class 2024 & 2032
- Figure 39: Europe Ophthalmic Suspension Market Revenue (Million), by Product Type 2024 & 2032
- Figure 40: Europe Ophthalmic Suspension Market Volume (K Unit), by Product Type 2024 & 2032
- Figure 41: Europe Ophthalmic Suspension Market Revenue Share (%), by Product Type 2024 & 2032
- Figure 42: Europe Ophthalmic Suspension Market Volume Share (%), by Product Type 2024 & 2032
- Figure 43: Europe Ophthalmic Suspension Market Revenue (Million), by Country 2024 & 2032
- Figure 44: Europe Ophthalmic Suspension Market Volume (K Unit), by Country 2024 & 2032
- Figure 45: Europe Ophthalmic Suspension Market Revenue Share (%), by Country 2024 & 2032
- Figure 46: Europe Ophthalmic Suspension Market Volume Share (%), by Country 2024 & 2032
- Figure 47: Asia Pacific Ophthalmic Suspension Market Revenue (Million), by Drug Class 2024 & 2032
- Figure 48: Asia Pacific Ophthalmic Suspension Market Volume (K Unit), by Drug Class 2024 & 2032
- Figure 49: Asia Pacific Ophthalmic Suspension Market Revenue Share (%), by Drug Class 2024 & 2032
- Figure 50: Asia Pacific Ophthalmic Suspension Market Volume Share (%), by Drug Class 2024 & 2032
- Figure 51: Asia Pacific Ophthalmic Suspension Market Revenue (Million), by Product Type 2024 & 2032
- Figure 52: Asia Pacific Ophthalmic Suspension Market Volume (K Unit), by Product Type 2024 & 2032
- Figure 53: Asia Pacific Ophthalmic Suspension Market Revenue Share (%), by Product Type 2024 & 2032
- Figure 54: Asia Pacific Ophthalmic Suspension Market Volume Share (%), by Product Type 2024 & 2032
- Figure 55: Asia Pacific Ophthalmic Suspension Market Revenue (Million), by Country 2024 & 2032
- Figure 56: Asia Pacific Ophthalmic Suspension Market Volume (K Unit), by Country 2024 & 2032
- Figure 57: Asia Pacific Ophthalmic Suspension Market Revenue Share (%), by Country 2024 & 2032
- Figure 58: Asia Pacific Ophthalmic Suspension Market Volume Share (%), by Country 2024 & 2032
- Figure 59: Middle East and Africa Ophthalmic Suspension Market Revenue (Million), by Drug Class 2024 & 2032
- Figure 60: Middle East and Africa Ophthalmic Suspension Market Volume (K Unit), by Drug Class 2024 & 2032
- Figure 61: Middle East and Africa Ophthalmic Suspension Market Revenue Share (%), by Drug Class 2024 & 2032
- Figure 62: Middle East and Africa Ophthalmic Suspension Market Volume Share (%), by Drug Class 2024 & 2032
- Figure 63: Middle East and Africa Ophthalmic Suspension Market Revenue (Million), by Product Type 2024 & 2032
- Figure 64: Middle East and Africa Ophthalmic Suspension Market Volume (K Unit), by Product Type 2024 & 2032
- Figure 65: Middle East and Africa Ophthalmic Suspension Market Revenue Share (%), by Product Type 2024 & 2032
- Figure 66: Middle East and Africa Ophthalmic Suspension Market Volume Share (%), by Product Type 2024 & 2032
- Figure 67: Middle East and Africa Ophthalmic Suspension Market Revenue (Million), by Country 2024 & 2032
- Figure 68: Middle East and Africa Ophthalmic Suspension Market Volume (K Unit), by Country 2024 & 2032
- Figure 69: Middle East and Africa Ophthalmic Suspension Market Revenue Share (%), by Country 2024 & 2032
- Figure 70: Middle East and Africa Ophthalmic Suspension Market Volume Share (%), by Country 2024 & 2032
- Figure 71: South America Ophthalmic Suspension Market Revenue (Million), by Drug Class 2024 & 2032
- Figure 72: South America Ophthalmic Suspension Market Volume (K Unit), by Drug Class 2024 & 2032
- Figure 73: South America Ophthalmic Suspension Market Revenue Share (%), by Drug Class 2024 & 2032
- Figure 74: South America Ophthalmic Suspension Market Volume Share (%), by Drug Class 2024 & 2032
- Figure 75: South America Ophthalmic Suspension Market Revenue (Million), by Product Type 2024 & 2032
- Figure 76: South America Ophthalmic Suspension Market Volume (K Unit), by Product Type 2024 & 2032
- Figure 77: South America Ophthalmic Suspension Market Revenue Share (%), by Product Type 2024 & 2032
- Figure 78: South America Ophthalmic Suspension Market Volume Share (%), by Product Type 2024 & 2032
- Figure 79: South America Ophthalmic Suspension Market Revenue (Million), by Country 2024 & 2032
- Figure 80: South America Ophthalmic Suspension Market Volume (K Unit), by Country 2024 & 2032
- Figure 81: South America Ophthalmic Suspension Market Revenue Share (%), by Country 2024 & 2032
- Figure 82: South America Ophthalmic Suspension Market Volume Share (%), by Country 2024 & 2032
List of Tables
- Table 1: Global Ophthalmic Suspension Market Revenue Million Forecast, by Region 2019 & 2032
- Table 2: Global Ophthalmic Suspension Market Volume K Unit Forecast, by Region 2019 & 2032
- Table 3: Global Ophthalmic Suspension Market Revenue Million Forecast, by Drug Class 2019 & 2032
- Table 4: Global Ophthalmic Suspension Market Volume K Unit Forecast, by Drug Class 2019 & 2032
- Table 5: Global Ophthalmic Suspension Market Revenue Million Forecast, by Product Type 2019 & 2032
- Table 6: Global Ophthalmic Suspension Market Volume K Unit Forecast, by Product Type 2019 & 2032
- Table 7: Global Ophthalmic Suspension Market Revenue Million Forecast, by Region 2019 & 2032
- Table 8: Global Ophthalmic Suspension Market Volume K Unit Forecast, by Region 2019 & 2032
- Table 9: Global Ophthalmic Suspension Market Revenue Million Forecast, by Country 2019 & 2032
- Table 10: Global Ophthalmic Suspension Market Volume K Unit Forecast, by Country 2019 & 2032
- Table 11: United States Ophthalmic Suspension Market Revenue (Million) Forecast, by Application 2019 & 2032
- Table 12: United States Ophthalmic Suspension Market Volume (K Unit) Forecast, by Application 2019 & 2032
- Table 13: Canada Ophthalmic Suspension Market Revenue (Million) Forecast, by Application 2019 & 2032
- Table 14: Canada Ophthalmic Suspension Market Volume (K Unit) Forecast, by Application 2019 & 2032
- Table 15: Mexico Ophthalmic Suspension Market Revenue (Million) Forecast, by Application 2019 & 2032
- Table 16: Mexico Ophthalmic Suspension Market Volume (K Unit) Forecast, by Application 2019 & 2032
- Table 17: Global Ophthalmic Suspension Market Revenue Million Forecast, by Country 2019 & 2032
- Table 18: Global Ophthalmic Suspension Market Volume K Unit Forecast, by Country 2019 & 2032
- Table 19: Germany Ophthalmic Suspension Market Revenue (Million) Forecast, by Application 2019 & 2032
- Table 20: Germany Ophthalmic Suspension Market Volume (K Unit) Forecast, by Application 2019 & 2032
- Table 21: United Kingdom Ophthalmic Suspension Market Revenue (Million) Forecast, by Application 2019 & 2032
- Table 22: United Kingdom Ophthalmic Suspension Market Volume (K Unit) Forecast, by Application 2019 & 2032
- Table 23: France Ophthalmic Suspension Market Revenue (Million) Forecast, by Application 2019 & 2032
- Table 24: France Ophthalmic Suspension Market Volume (K Unit) Forecast, by Application 2019 & 2032
- Table 25: Italy Ophthalmic Suspension Market Revenue (Million) Forecast, by Application 2019 & 2032
- Table 26: Italy Ophthalmic Suspension Market Volume (K Unit) Forecast, by Application 2019 & 2032
- Table 27: Spain Ophthalmic Suspension Market Revenue (Million) Forecast, by Application 2019 & 2032
- Table 28: Spain Ophthalmic Suspension Market Volume (K Unit) Forecast, by Application 2019 & 2032
- Table 29: Rest of Europe Ophthalmic Suspension Market Revenue (Million) Forecast, by Application 2019 & 2032
- Table 30: Rest of Europe Ophthalmic Suspension Market Volume (K Unit) Forecast, by Application 2019 & 2032
- Table 31: Global Ophthalmic Suspension Market Revenue Million Forecast, by Country 2019 & 2032
- Table 32: Global Ophthalmic Suspension Market Volume K Unit Forecast, by Country 2019 & 2032
- Table 33: China Ophthalmic Suspension Market Revenue (Million) Forecast, by Application 2019 & 2032
- Table 34: China Ophthalmic Suspension Market Volume (K Unit) Forecast, by Application 2019 & 2032
- Table 35: Japan Ophthalmic Suspension Market Revenue (Million) Forecast, by Application 2019 & 2032
- Table 36: Japan Ophthalmic Suspension Market Volume (K Unit) Forecast, by Application 2019 & 2032
- Table 37: India Ophthalmic Suspension Market Revenue (Million) Forecast, by Application 2019 & 2032
- Table 38: India Ophthalmic Suspension Market Volume (K Unit) Forecast, by Application 2019 & 2032
- Table 39: Australia Ophthalmic Suspension Market Revenue (Million) Forecast, by Application 2019 & 2032
- Table 40: Australia Ophthalmic Suspension Market Volume (K Unit) Forecast, by Application 2019 & 2032
- Table 41: South Korea Ophthalmic Suspension Market Revenue (Million) Forecast, by Application 2019 & 2032
- Table 42: South Korea Ophthalmic Suspension Market Volume (K Unit) Forecast, by Application 2019 & 2032
- Table 43: Rest of Asia Pacific Ophthalmic Suspension Market Revenue (Million) Forecast, by Application 2019 & 2032
- Table 44: Rest of Asia Pacific Ophthalmic Suspension Market Volume (K Unit) Forecast, by Application 2019 & 2032
- Table 45: Global Ophthalmic Suspension Market Revenue Million Forecast, by Country 2019 & 2032
- Table 46: Global Ophthalmic Suspension Market Volume K Unit Forecast, by Country 2019 & 2032
- Table 47: GCC Ophthalmic Suspension Market Revenue (Million) Forecast, by Application 2019 & 2032
- Table 48: GCC Ophthalmic Suspension Market Volume (K Unit) Forecast, by Application 2019 & 2032
- Table 49: South Africa Ophthalmic Suspension Market Revenue (Million) Forecast, by Application 2019 & 2032
- Table 50: South Africa Ophthalmic Suspension Market Volume (K Unit) Forecast, by Application 2019 & 2032
- Table 51: Rest of Middle East and Africa Ophthalmic Suspension Market Revenue (Million) Forecast, by Application 2019 & 2032
- Table 52: Rest of Middle East and Africa Ophthalmic Suspension Market Volume (K Unit) Forecast, by Application 2019 & 2032
- Table 53: Global Ophthalmic Suspension Market Revenue Million Forecast, by Country 2019 & 2032
- Table 54: Global Ophthalmic Suspension Market Volume K Unit Forecast, by Country 2019 & 2032
- Table 55: Brazil Ophthalmic Suspension Market Revenue (Million) Forecast, by Application 2019 & 2032
- Table 56: Brazil Ophthalmic Suspension Market Volume (K Unit) Forecast, by Application 2019 & 2032
- Table 57: Argentina Ophthalmic Suspension Market Revenue (Million) Forecast, by Application 2019 & 2032
- Table 58: Argentina Ophthalmic Suspension Market Volume (K Unit) Forecast, by Application 2019 & 2032
- Table 59: Rest of South America Ophthalmic Suspension Market Revenue (Million) Forecast, by Application 2019 & 2032
- Table 60: Rest of South America Ophthalmic Suspension Market Volume (K Unit) Forecast, by Application 2019 & 2032
- Table 61: Global Ophthalmic Suspension Market Revenue Million Forecast, by Drug Class 2019 & 2032
- Table 62: Global Ophthalmic Suspension Market Volume K Unit Forecast, by Drug Class 2019 & 2032
- Table 63: Global Ophthalmic Suspension Market Revenue Million Forecast, by Product Type 2019 & 2032
- Table 64: Global Ophthalmic Suspension Market Volume K Unit Forecast, by Product Type 2019 & 2032
- Table 65: Global Ophthalmic Suspension Market Revenue Million Forecast, by Country 2019 & 2032
- Table 66: Global Ophthalmic Suspension Market Volume K Unit Forecast, by Country 2019 & 2032
- Table 67: United States Ophthalmic Suspension Market Revenue (Million) Forecast, by Application 2019 & 2032
- Table 68: United States Ophthalmic Suspension Market Volume (K Unit) Forecast, by Application 2019 & 2032
- Table 69: Canada Ophthalmic Suspension Market Revenue (Million) Forecast, by Application 2019 & 2032
- Table 70: Canada Ophthalmic Suspension Market Volume (K Unit) Forecast, by Application 2019 & 2032
- Table 71: Mexico Ophthalmic Suspension Market Revenue (Million) Forecast, by Application 2019 & 2032
- Table 72: Mexico Ophthalmic Suspension Market Volume (K Unit) Forecast, by Application 2019 & 2032
- Table 73: Global Ophthalmic Suspension Market Revenue Million Forecast, by Drug Class 2019 & 2032
- Table 74: Global Ophthalmic Suspension Market Volume K Unit Forecast, by Drug Class 2019 & 2032
- Table 75: Global Ophthalmic Suspension Market Revenue Million Forecast, by Product Type 2019 & 2032
- Table 76: Global Ophthalmic Suspension Market Volume K Unit Forecast, by Product Type 2019 & 2032
- Table 77: Global Ophthalmic Suspension Market Revenue Million Forecast, by Country 2019 & 2032
- Table 78: Global Ophthalmic Suspension Market Volume K Unit Forecast, by Country 2019 & 2032
- Table 79: Germany Ophthalmic Suspension Market Revenue (Million) Forecast, by Application 2019 & 2032
- Table 80: Germany Ophthalmic Suspension Market Volume (K Unit) Forecast, by Application 2019 & 2032
- Table 81: United Kingdom Ophthalmic Suspension Market Revenue (Million) Forecast, by Application 2019 & 2032
- Table 82: United Kingdom Ophthalmic Suspension Market Volume (K Unit) Forecast, by Application 2019 & 2032
- Table 83: France Ophthalmic Suspension Market Revenue (Million) Forecast, by Application 2019 & 2032
- Table 84: France Ophthalmic Suspension Market Volume (K Unit) Forecast, by Application 2019 & 2032
- Table 85: Italy Ophthalmic Suspension Market Revenue (Million) Forecast, by Application 2019 & 2032
- Table 86: Italy Ophthalmic Suspension Market Volume (K Unit) Forecast, by Application 2019 & 2032
- Table 87: Spain Ophthalmic Suspension Market Revenue (Million) Forecast, by Application 2019 & 2032
- Table 88: Spain Ophthalmic Suspension Market Volume (K Unit) Forecast, by Application 2019 & 2032
- Table 89: Rest of Europe Ophthalmic Suspension Market Revenue (Million) Forecast, by Application 2019 & 2032
- Table 90: Rest of Europe Ophthalmic Suspension Market Volume (K Unit) Forecast, by Application 2019 & 2032
- Table 91: Global Ophthalmic Suspension Market Revenue Million Forecast, by Drug Class 2019 & 2032
- Table 92: Global Ophthalmic Suspension Market Volume K Unit Forecast, by Drug Class 2019 & 2032
- Table 93: Global Ophthalmic Suspension Market Revenue Million Forecast, by Product Type 2019 & 2032
- Table 94: Global Ophthalmic Suspension Market Volume K Unit Forecast, by Product Type 2019 & 2032
- Table 95: Global Ophthalmic Suspension Market Revenue Million Forecast, by Country 2019 & 2032
- Table 96: Global Ophthalmic Suspension Market Volume K Unit Forecast, by Country 2019 & 2032
- Table 97: China Ophthalmic Suspension Market Revenue (Million) Forecast, by Application 2019 & 2032
- Table 98: China Ophthalmic Suspension Market Volume (K Unit) Forecast, by Application 2019 & 2032
- Table 99: Japan Ophthalmic Suspension Market Revenue (Million) Forecast, by Application 2019 & 2032
- Table 100: Japan Ophthalmic Suspension Market Volume (K Unit) Forecast, by Application 2019 & 2032
- Table 101: India Ophthalmic Suspension Market Revenue (Million) Forecast, by Application 2019 & 2032
- Table 102: India Ophthalmic Suspension Market Volume (K Unit) Forecast, by Application 2019 & 2032
- Table 103: Australia Ophthalmic Suspension Market Revenue (Million) Forecast, by Application 2019 & 2032
- Table 104: Australia Ophthalmic Suspension Market Volume (K Unit) Forecast, by Application 2019 & 2032
- Table 105: South Korea Ophthalmic Suspension Market Revenue (Million) Forecast, by Application 2019 & 2032
- Table 106: South Korea Ophthalmic Suspension Market Volume (K Unit) Forecast, by Application 2019 & 2032
- Table 107: Rest of Asia Pacific Ophthalmic Suspension Market Revenue (Million) Forecast, by Application 2019 & 2032
- Table 108: Rest of Asia Pacific Ophthalmic Suspension Market Volume (K Unit) Forecast, by Application 2019 & 2032
- Table 109: Global Ophthalmic Suspension Market Revenue Million Forecast, by Drug Class 2019 & 2032
- Table 110: Global Ophthalmic Suspension Market Volume K Unit Forecast, by Drug Class 2019 & 2032
- Table 111: Global Ophthalmic Suspension Market Revenue Million Forecast, by Product Type 2019 & 2032
- Table 112: Global Ophthalmic Suspension Market Volume K Unit Forecast, by Product Type 2019 & 2032
- Table 113: Global Ophthalmic Suspension Market Revenue Million Forecast, by Country 2019 & 2032
- Table 114: Global Ophthalmic Suspension Market Volume K Unit Forecast, by Country 2019 & 2032
- Table 115: GCC Ophthalmic Suspension Market Revenue (Million) Forecast, by Application 2019 & 2032
- Table 116: GCC Ophthalmic Suspension Market Volume (K Unit) Forecast, by Application 2019 & 2032
- Table 117: South Africa Ophthalmic Suspension Market Revenue (Million) Forecast, by Application 2019 & 2032
- Table 118: South Africa Ophthalmic Suspension Market Volume (K Unit) Forecast, by Application 2019 & 2032
- Table 119: Rest of Middle East and Africa Ophthalmic Suspension Market Revenue (Million) Forecast, by Application 2019 & 2032
- Table 120: Rest of Middle East and Africa Ophthalmic Suspension Market Volume (K Unit) Forecast, by Application 2019 & 2032
- Table 121: Global Ophthalmic Suspension Market Revenue Million Forecast, by Drug Class 2019 & 2032
- Table 122: Global Ophthalmic Suspension Market Volume K Unit Forecast, by Drug Class 2019 & 2032
- Table 123: Global Ophthalmic Suspension Market Revenue Million Forecast, by Product Type 2019 & 2032
- Table 124: Global Ophthalmic Suspension Market Volume K Unit Forecast, by Product Type 2019 & 2032
- Table 125: Global Ophthalmic Suspension Market Revenue Million Forecast, by Country 2019 & 2032
- Table 126: Global Ophthalmic Suspension Market Volume K Unit Forecast, by Country 2019 & 2032
- Table 127: Brazil Ophthalmic Suspension Market Revenue (Million) Forecast, by Application 2019 & 2032
- Table 128: Brazil Ophthalmic Suspension Market Volume (K Unit) Forecast, by Application 2019 & 2032
- Table 129: Argentina Ophthalmic Suspension Market Revenue (Million) Forecast, by Application 2019 & 2032
- Table 130: Argentina Ophthalmic Suspension Market Volume (K Unit) Forecast, by Application 2019 & 2032
- Table 131: Rest of South America Ophthalmic Suspension Market Revenue (Million) Forecast, by Application 2019 & 2032
- Table 132: Rest of South America Ophthalmic Suspension Market Volume (K Unit) Forecast, by Application 2019 & 2032
Frequently Asked Questions
1. What is the projected Compound Annual Growth Rate (CAGR) of the Ophthalmic Suspension Market?
The projected CAGR is approximately 8.24%.
2. Which companies are prominent players in the Ophthalmic Suspension Market?
Key companies in the market include Teva Pharmaceutical Industries Ltd , Regeneron Pharmaceuticals Inc, Bayer AG, Novartis AG, Viatris Inc, F Hoffmann-La Roche Ltd, AbbVie (Allergan), Aerie Pharmaceuticals Inc, Sun Pharmaceutical Industries Ltd, Alcon, Bausch Health Companies Inc, Santen Pharmaceutical Co Ltd.
3. What are the main segments of the Ophthalmic Suspension Market?
The market segments include Drug Class, Product Type.
4. Can you provide details about the market size?
The market size is estimated to be USD 52.99 Million as of 2022.
5. What are some drivers contributing to market growth?
Increasing Incidence and Prevalence of Eye-related Disorders; Rising Research and Development Pertaining to the Development of Novel Drugs; Increasing Focus on Developing Combination Therapies.
6. What are the notable trends driving market growth?
The Anti-glaucoma Drug Segment under Drug Class is Expected to Hold a Significant Share in the Ophthalmic Drugs Market During the Forecast Period.
7. Are there any restraints impacting market growth?
Loss of Patent Protection for Popular Drugs; Lack of Health Insurance in the Developing Countries.
8. Can you provide examples of recent developments in the market?
In April 2022, Sandoz, a Novartis company, launched its generic combination eyedrop brimonidine tartrate/timolol maleate ophthalmic solution 0.2%/0.5%, an AB-rated generic equivalent to AbbVie's COMBIGAN, to lower eye pressure in patients with ocular hypertension (high eye pressure) in the United States.
9. What pricing options are available for accessing the report?
Pricing options include single-user, multi-user, and enterprise licenses priced at USD 4750, USD 5250, and USD 8750 respectively.
10. Is the market size provided in terms of value or volume?
The market size is provided in terms of value, measured in Million and volume, measured in K Unit.
11. Are there any specific market keywords associated with the report?
Yes, the market keyword associated with the report is "Ophthalmic Suspension Market," which aids in identifying and referencing the specific market segment covered.
12. How do I determine which pricing option suits my needs best?
The pricing options vary based on user requirements and access needs. Individual users may opt for single-user licenses, while businesses requiring broader access may choose multi-user or enterprise licenses for cost-effective access to the report.
13. Are there any additional resources or data provided in the Ophthalmic Suspension Market report?
While the report offers comprehensive insights, it's advisable to review the specific contents or supplementary materials provided to ascertain if additional resources or data are available.
14. How can I stay updated on further developments or reports in the Ophthalmic Suspension Market?
To stay informed about further developments, trends, and reports in the Ophthalmic Suspension Market, consider subscribing to industry newsletters, following relevant companies and organizations, or regularly checking reputable industry news sources and publications.
Methodology
Step 1 - Identification of Relevant Samples Size from Population Database


Step 2 - Approaches for Defining Global Market Size (Value, Volume* & Price*)

Note*: In applicable scenarios
Step 3 - Data Sources
Primary Research
- Web Analytics
- Survey Reports
- Research Institute
- Latest Research Reports
- Opinion Leaders
Secondary Research
- Annual Reports
- White Paper
- Latest Press Release
- Industry Association
- Paid Database
- Investor Presentations

Step 4 - Data Triangulation
Involves using different sources of information in order to increase the validity of a study
These sources are likely to be stakeholders in a program - participants, other researchers, program staff, other community members, and so on.
Then we put all data in single framework & apply various statistical tools to find out the dynamic on the market.
During the analysis stage, feedback from the stakeholder groups would be compared to determine areas of agreement as well as areas of divergence


