

Key Insights
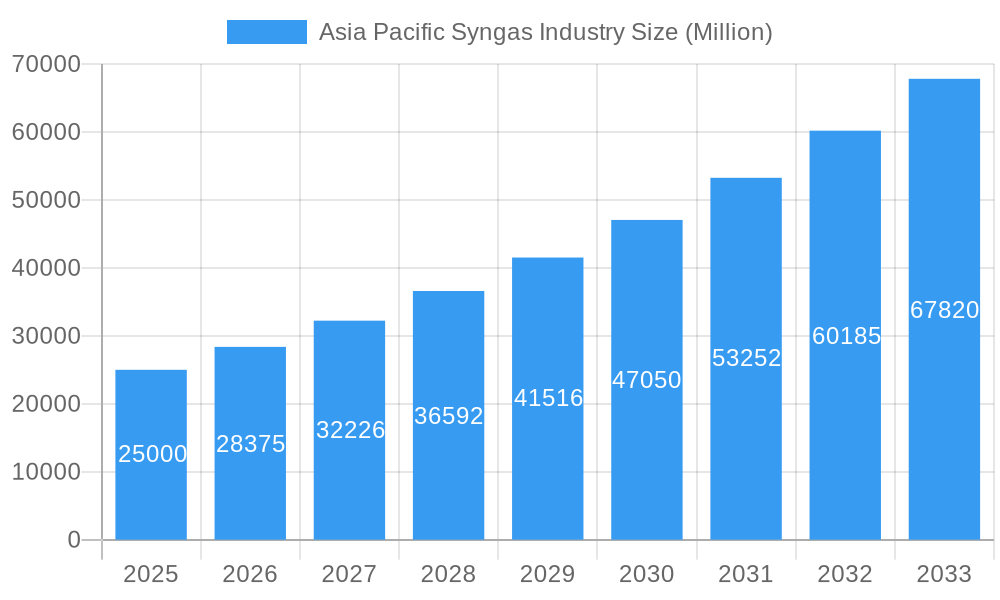
The Asia Pacific syngas market is poised for substantial growth, driven by escalating energy demands and the imperative for cleaner industrial processes. With an estimated compound annual growth rate (CAGR) of 6.4%, the market is projected to reach 44.39 billion by 2033, commencing from a base year of 2024. Rapid industrialization in key economies like China and India is a primary catalyst, increasing syngas utilization for power generation and chemical manufacturing. The region's commitment to decarbonization is also fostering the adoption of biomass gasification, supporting the transition to sustainable energy solutions. Innovations in syngas production technologies, enhancing efficiency and cost-effectiveness of reforming processes such as steam and auto-thermal reforming, are further accelerating market expansion. Strategic diversification of feedstocks, incorporating biomass and pet coke alongside traditional resources like coal and natural gas, underscores a focus on sustainability and resource optimization. Major market contributors include China and India, owing to their extensive industrial footprints, with significant roles also played by Japan, South Korea, and Australia. Leading industry players such as Haldor Topsoe, Air Products, and Shell are instrumental in production, technological advancement, and supply chain integrity, contributing to the vibrant competitive landscape. Diverse applications and continuous technological innovation project a robust future for the Asia Pacific syngas market.
Asia Pacific Syngas Industry Market Size (In Billion)
The competitive arena features a mix of global enterprises and niche syngas technology specialists, emphasizing the importance of innovation and strategic alliances for enduring market leadership. Government policies encouraging renewable energy and cleaner technologies, coupled with ongoing R&D to boost efficiency and environmental performance, will shape future market trajectories. While feedstock price volatility and stringent environmental regulations present challenges, the long-term outlook for the Asia Pacific syngas market remains highly promising, fueled by consistent regional demand for energy and chemicals. Sustained investment in infrastructure and sustainable production methodologies will be critical for realizing future market potential.
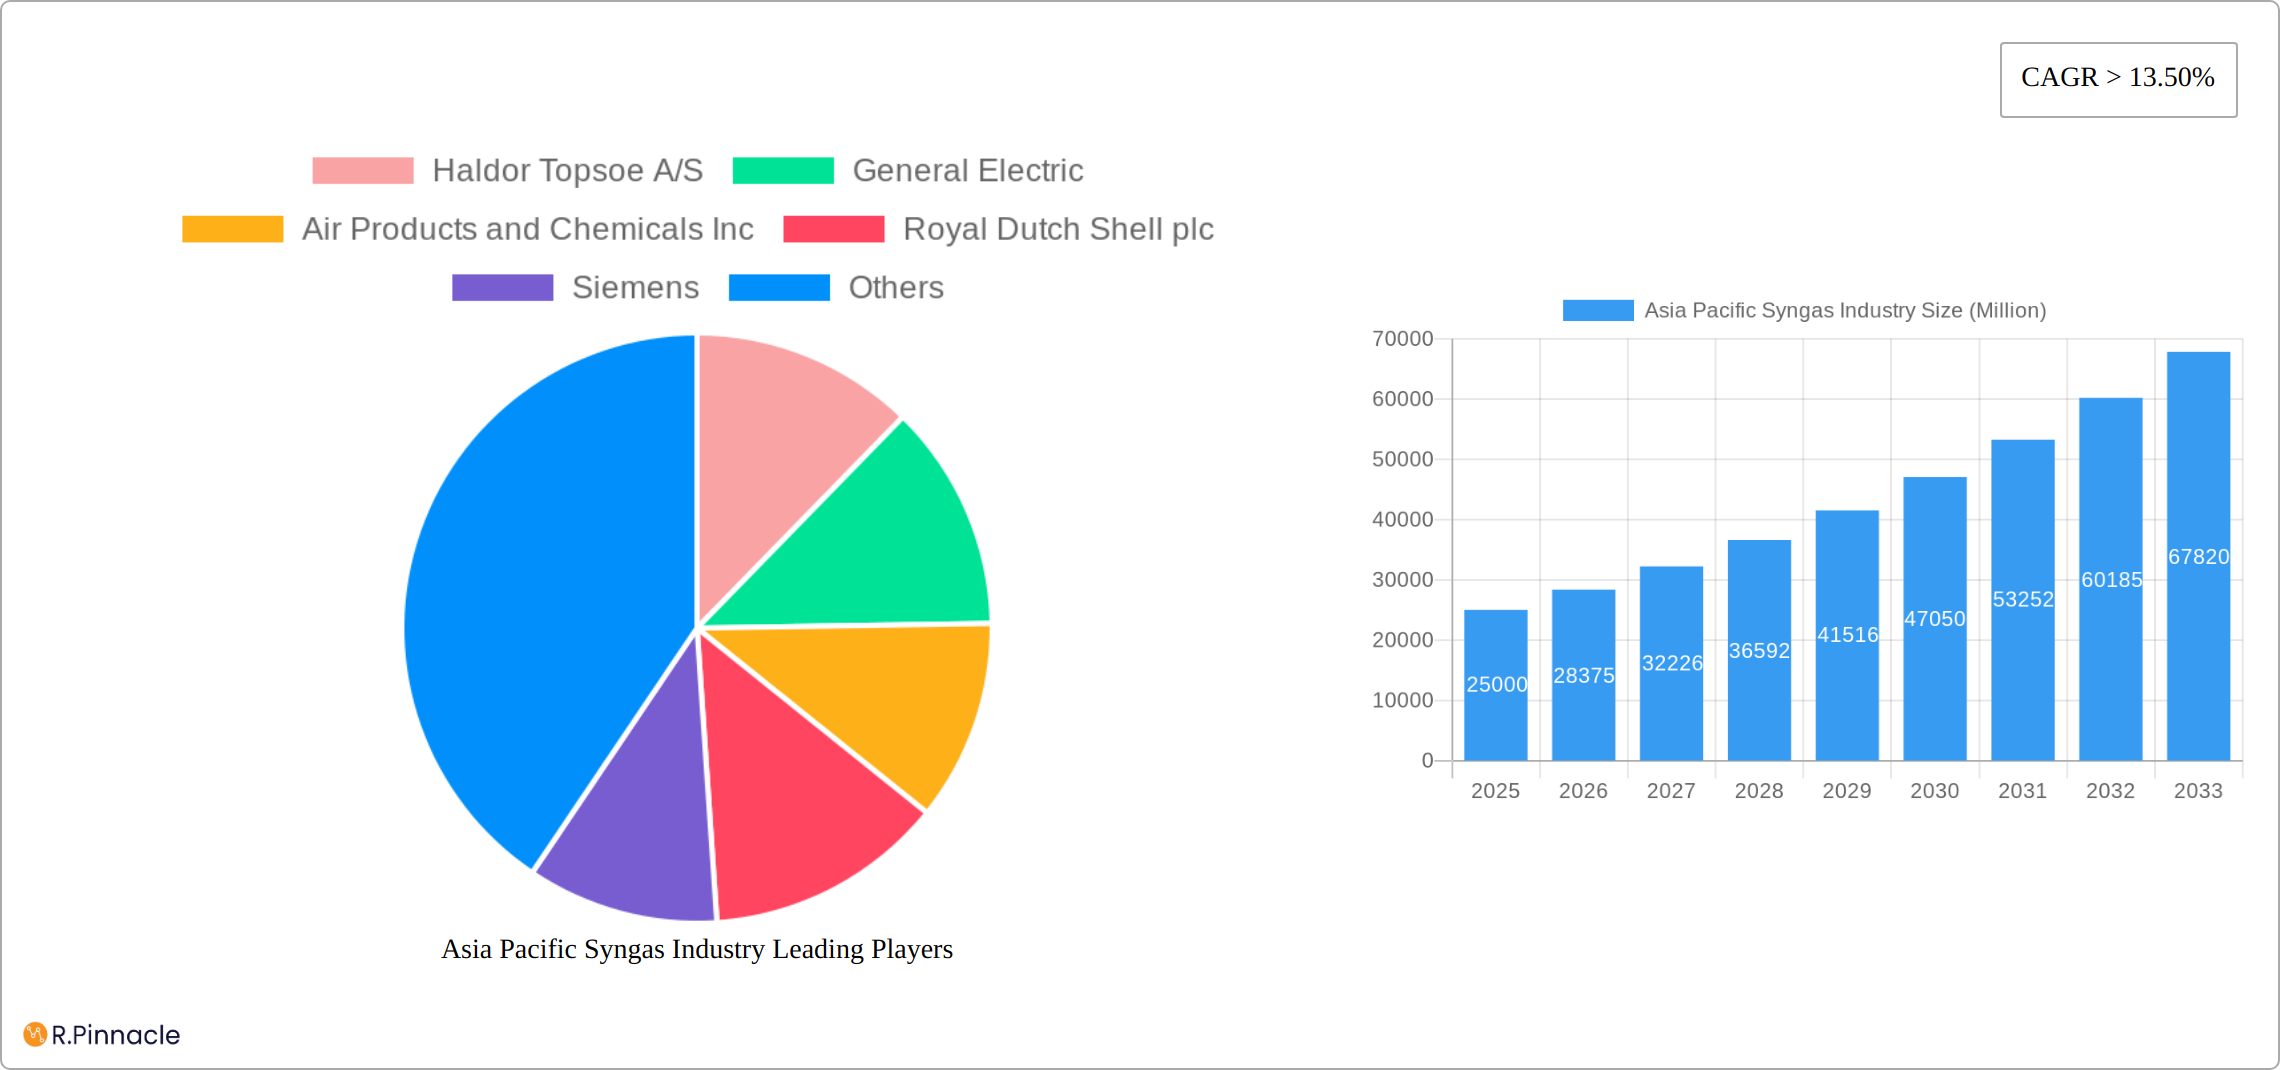
Asia Pacific Syngas Industry Company Market Share
Asia Pacific Syngas Industry Market Report: 2019-2033
This comprehensive report provides an in-depth analysis of the Asia Pacific syngas industry, offering invaluable insights for industry professionals, investors, and strategic decision-makers. Covering the period from 2019 to 2033, with a focus on 2025, this report illuminates market dynamics, growth drivers, challenges, and future opportunities. The report leverages extensive data and analysis to provide a clear understanding of this rapidly evolving sector.
Asia Pacific Syngas Industry Market Structure & Innovation Trends
The Asia Pacific syngas market is characterized by a moderately concentrated structure, with key players such as Haldor Topsoe A/S, General Electric, Air Products and Chemicals Inc, Royal Dutch Shell plc, Siemens, KBR Inc, BASF SE, Sasol, DuPont, Linde plc, SynGas Technology LLC, Air Liquide, BP p l c, and TechnipFMC plc holding significant market share. However, the market also features several smaller, specialized players. The combined market share of the top five players is estimated at xx%, indicating a competitive landscape.
Innovation is driven by the increasing demand for cleaner energy sources and the need for efficient syngas production. Regulatory frameworks, including emission standards and environmental regulations, significantly influence technological advancements and investment decisions. Product substitutes, such as renewable hydrogen, are emerging but currently hold a relatively small market share of xx%.
The end-user demographics are diverse, encompassing power generation, chemical manufacturing, and the burgeoning dimethyl ether (DME) market. M&A activity has been moderate in recent years, with deal values totaling approximately USD xx Million in the period 2019-2024. Notable acquisitions have focused on expanding geographic reach and technological capabilities.
Asia Pacific Syngas Industry Market Dynamics & Trends
The Asia Pacific syngas market is experiencing robust growth, fueled by the region's burgeoning energy demands, rapid industrialization, and government initiatives promoting a cleaner energy transition. Market projections indicate a compound annual growth rate (CAGR) of xx% during the forecast period (2025-2033), culminating in a market valuation of USD xx million by 2033. This significant expansion is driven by several key factors:
- Soaring Energy Demand: The escalating energy requirements of rapidly developing Asian economies are creating a substantial demand for syngas, a versatile and adaptable energy source.
- Chemical Industry Expansion: The chemical industry's heavy reliance on syngas as a crucial feedstock for diverse chemical products significantly boosts market demand.
- Governmental Support and Policy Initiatives: Proactive government policies focused on cleaner energy sources and industrial diversification are stimulating substantial investments in syngas production facilities and infrastructure.
- Technological Advancements and Innovations: Ongoing innovations in gasification technologies, including advancements in biomass gasification, are leading to enhanced efficiency and reduced environmental impact. While some newer technologies face challenges related to cost-effectiveness and scalability, ongoing research and development efforts are addressing these concerns.
The market landscape is undergoing a transformation driven by technological advancements, such as breakthroughs in carbon capture and storage (CCS) technologies. A growing consumer preference for cleaner and more sustainable energy solutions is influencing feedstock choices and production methods across the industry. Competitive dynamics are shaped by factors such as technological leadership, economies of scale, access to essential resources, and strategic partnerships. Market penetration of various syngas applications shows significant variation across different countries within the Asia Pacific region, with China and India currently exhibiting the highest adoption rates.
Dominant Regions & Segments in Asia Pacific Syngas Industry
China and India currently dominate the Asia Pacific syngas market, accounting for over xx% of the total market share in 2025. This dominance is primarily attributed to:
- China: Strong industrial base, robust government support for energy diversification, and substantial investments in infrastructure.
- India: Rapid industrialization, rising energy demand, and government initiatives aimed at promoting domestic energy production.
Among the various segments:
- Feedstock: Coal remains the dominant feedstock, driven by its abundance and relatively low cost. However, natural gas is gaining traction due to its lower emissions and improved technology.
- Technology: Steam reforming currently holds the largest market share due to its established technology and cost-effectiveness. However, advancements in auto-thermal reforming and biomass gasification are gaining momentum.
- Gasifier Type: Entrained flow gasifiers dominate due to their high efficiency and suitability for various feedstocks.
- Application: Power generation remains the largest application area, followed by the chemical industry. The DME market is witnessing rapid growth.
Asia Pacific Syngas Industry Product Innovations
Recent product developments showcase significant advancements in gasification technologies, resulting in improved efficiency, reduced emissions, and the ability to process a wider range of feedstocks, including sustainable biomass sources. The emergence of new syngas applications in the production of liquid fuels and various chemicals is further expanding the market's potential. These innovations offer compelling competitive advantages through improved operational efficiency, reduced production costs, and environmentally friendly solutions. The industry is increasingly focused on developing sustainable and economically viable alternatives to traditional fossil fuel-based processes.
Report Scope & Segmentation Analysis
This report provides a detailed segmentation analysis of the Asia Pacific syngas market across various parameters:
- Feedstock: Coal, Natural Gas, Petroleum, Pet Coke, Biomass (each segment's market size, growth projections, and competitive dynamics are detailed).
- Technology: Steam Reforming, Partial Oxidation, Auto-thermal Reforming, Combined or Two-step Reforming, Biomass Gasification (each segment's market size, growth projections, and competitive dynamics are detailed).
- Gasifier Type: Fixed Bed, Entrained Flow, Fluidized Bed (each segment's market size, growth projections, and competitive dynamics are detailed).
- Application: Power Generation, Chemicals, Dimethyl Ether (DME) (Liquid Fuels, Gaseous Fuels) (each segment's market size, growth projections, and competitive dynamics are detailed).
Each segment's analysis includes market size estimations, growth forecasts, and competitive landscape insights.
Key Drivers of Asia Pacific Syngas Industry Growth
Several factors propel the growth of the Asia Pacific syngas market. Firstly, the region's substantial coal reserves offer a readily available and cost-effective feedstock. Secondly, the burgeoning chemical and power generation sectors drive consistent demand for syngas. Thirdly, supportive government policies, including incentives for renewable energy sources and investments in infrastructure, significantly contribute to market expansion. Finally, continuous technological advancements improve syngas production efficiency and reduce its environmental impact.
Challenges in the Asia Pacific Syngas Industry Sector
The Asia Pacific syngas industry faces several challenges. Stringent environmental regulations and the need to mitigate greenhouse gas emissions necessitate significant investments in emission control technologies. Furthermore, fluctuating feedstock prices and potential supply chain disruptions can impact profitability. Competition from alternative fuels, such as renewable hydrogen, also poses a significant challenge. The overall impact of these challenges is estimated to reduce the market growth rate by xx% in the next five years.
Emerging Opportunities in Asia Pacific Syngas Industry
The Asia Pacific syngas industry presents several promising opportunities for growth and development. The burgeoning interest in blue hydrogen production, with syngas serving as a key feedstock, presents significant potential for expansion. The development and deployment of advanced carbon capture and storage (CCS) technologies are crucial for mitigating emissions and enhancing the industry's environmental sustainability. Moreover, the increasing demand for dimethyl ether (DME) as a cleaner fuel source offers substantial growth prospects. Exploring and utilizing alternative biomass feedstocks can further enhance the industry's sustainability and reduce its reliance on fossil fuels.
Leading Players in the Asia Pacific Syngas Industry Market
- Haldor Topsoe A/S
- General Electric
- Air Products and Chemicals Inc
- Royal Dutch Shell plc
- Siemens
- KBR Inc
- BASF SE
- Sasol
- DuPont
- Linde plc
- SynGas Technology LLC
- Air Liquide
- BP p l c
- TechnipFMC plc
- *List Not Exhaustive
Key Developments in Asia Pacific Syngas Industry
- December 2022: Reliance Industries Ltd. announced plans to produce blue hydrogen at a cost of USD 1.2 to 1.5 per kg, significantly boosting syngas market demand in India.
- December 2022: New Era Cleantech invested USD 2.5 Billion in a coal gasification plant in India, demonstrating diversification into syngas, hydrogen, methanol, and ammonia/urea production.
- September 2023: BASF SE commenced construction of a syngas plant in Zhanjiang, China, scheduled for operation in 2025, representing a substantial expansion of its production capacity.
- [Add more recent developments here with dates and brief descriptions]
Future Outlook for Asia Pacific Syngas Industry Market
The Asia Pacific syngas market is poised for sustained growth, driven by a confluence of factors including rising energy demand, robust industrial expansion, and supportive government policies aimed at promoting clean energy. The increasing adoption of clean energy technologies and advancements in carbon capture and storage (CCS) will significantly shape future market dynamics. Strategic partnerships, substantial investments in research and development, and a focus on sustainable practices will be crucial for industry players to maintain competitiveness and successfully capitalize on emerging opportunities. The market is projected to maintain a steady growth trajectory, with the potential for accelerated expansion in specific market segments.
Asia Pacific Syngas Industry Segmentation
-
1. Feedstock
- 1.1. Coal
- 1.2. Natural Gas
- 1.3. Petroleum
- 1.4. Pet Coke
- 1.5. Biomass
-
2. Technology
- 2.1. Steam Reforming
- 2.2. Partial Oxidation
- 2.3. Auto-thermal Reforming
- 2.4. Combined or Two-step Reforming
- 2.5. Biomass Gasification
-
3. Gasifier Type
- 3.1. Fixed Bed
- 3.2. Entrained Flow
- 3.3. Fluidized Bed
-
4. Application
- 4.1. Power Generation
-
4.2. Chemicals
- 4.2.1. Methanol
- 4.2.2. Ammonia
- 4.2.3. Oxo Chemicals
- 4.2.4. n-Butanol
- 4.2.5. Hydrogen
- 4.2.6. Dimethyl Ether
- 4.3. Liquid Fuels
- 4.4. Gaseous Fuels
-
5. Geography
- 5.1. China
- 5.2. India
- 5.3. Japan
- 5.4. South Korea
- 5.5. Australia & New Zealand
- 5.6. Rest of Asia-Pacific
Asia Pacific Syngas Industry Segmentation By Geography
- 1. China
- 2. India
- 3. Japan
- 4. South Korea
- 5. Australia
- 6. Rest of Asia Pacific
Asia Pacific Syngas Industry Regional Market Share
Geographic Coverage of Asia Pacific Syngas Industry
Asia Pacific Syngas Industry REPORT HIGHLIGHTS
| Aspects | Details |
|---|---|
| Study Period | 2020-2034 |
| Base Year | 2025 |
| Estimated Year | 2026 |
| Forecast Period | 2026-2034 |
| Historical Period | 2020-2025 |
| Growth Rate | CAGR of 6.4% from 2020-2034 |
| Segmentation |
|
Table of Contents
- 1. Introduction
- 1.1. Research Scope
- 1.2. Market Segmentation
- 1.3. Research Objective
- 1.4. Definitions and Assumptions
- 2. Executive Summary
- 2.1. Market Snapshot
- 3. Market Dynamics
- 3.1. Market Drivers
- 3.2. Market Restrains
- 3.3. Market Trends
- 3.4. Market Opportunities
- 4. Market Factor Analysis
- 4.1. Porters Five Forces
- 4.1.1. Bargaining Power of Suppliers
- 4.1.2. Bargaining Power of Buyers
- 4.1.3. Threat of New Entrants
- 4.1.4. Threat of Substitutes
- 4.1.5. Competitive Rivalry
- 4.2. PESTEL analysis
- 4.3. BCG Analysis
- 4.3.1. Stars (High Growth, High Market Share)
- 4.3.2. Cash Cows (Low Growth, High Market Share)
- 4.3.3. Question Mark (High Growth, Low Market Share)
- 4.3.4. Dogs (Low Growth, Low Market Share)
- 4.4. Ansoff Matrix Analysis
- 4.5. Supply Chain Analysis
- 4.6. Regulatory Landscape
- 4.7. Current Market Potential and Opportunity Assessment (TAM–SAM–SOM Framework)
- 4.8. PRI Analyst Note
- 4.1. Porters Five Forces
- 5. Market Analysis, Insights and Forecast 2021-2033
- 5.1. Market Analysis, Insights and Forecast - by Feedstock
- 5.1.1. Coal
- 5.1.2. Natural Gas
- 5.1.3. Petroleum
- 5.1.4. Pet Coke
- 5.1.5. Biomass
- 5.2. Market Analysis, Insights and Forecast - by Technology
- 5.2.1. Steam Reforming
- 5.2.2. Partial Oxidation
- 5.2.3. Auto-thermal Reforming
- 5.2.4. Combined or Two-step Reforming
- 5.2.5. Biomass Gasification
- 5.3. Market Analysis, Insights and Forecast - by Gasifier Type
- 5.3.1. Fixed Bed
- 5.3.2. Entrained Flow
- 5.3.3. Fluidized Bed
- 5.4. Market Analysis, Insights and Forecast - by Application
- 5.4.1. Power Generation
- 5.4.2. Chemicals
- 5.4.2.1. Methanol
- 5.4.2.2. Ammonia
- 5.4.2.3. Oxo Chemicals
- 5.4.2.4. n-Butanol
- 5.4.2.5. Hydrogen
- 5.4.2.6. Dimethyl Ether
- 5.4.3. Liquid Fuels
- 5.4.4. Gaseous Fuels
- 5.5. Market Analysis, Insights and Forecast - by Geography
- 5.5.1. China
- 5.5.2. India
- 5.5.3. Japan
- 5.5.4. South Korea
- 5.5.5. Australia & New Zealand
- 5.5.6. Rest of Asia-Pacific
- 5.6. Market Analysis, Insights and Forecast - by Region
- 5.6.1. China
- 5.6.2. India
- 5.6.3. Japan
- 5.6.4. South Korea
- 5.6.5. Australia
- 5.6.6. Rest of Asia Pacific
- 5.1. Market Analysis, Insights and Forecast - by Feedstock
- 6. Asia Pacific Syngas Industry Analysis, Insights and Forecast, 2021-2033
- 6.1. Market Analysis, Insights and Forecast - by Feedstock
- 6.1.1. Coal
- 6.1.2. Natural Gas
- 6.1.3. Petroleum
- 6.1.4. Pet Coke
- 6.1.5. Biomass
- 6.2. Market Analysis, Insights and Forecast - by Technology
- 6.2.1. Steam Reforming
- 6.2.2. Partial Oxidation
- 6.2.3. Auto-thermal Reforming
- 6.2.4. Combined or Two-step Reforming
- 6.2.5. Biomass Gasification
- 6.3. Market Analysis, Insights and Forecast - by Gasifier Type
- 6.3.1. Fixed Bed
- 6.3.2. Entrained Flow
- 6.3.3. Fluidized Bed
- 6.4. Market Analysis, Insights and Forecast - by Application
- 6.4.1. Power Generation
- 6.4.2. Chemicals
- 6.4.2.1. Methanol
- 6.4.2.2. Ammonia
- 6.4.2.3. Oxo Chemicals
- 6.4.2.4. n-Butanol
- 6.4.2.5. Hydrogen
- 6.4.2.6. Dimethyl Ether
- 6.4.3. Liquid Fuels
- 6.4.4. Gaseous Fuels
- 6.5. Market Analysis, Insights and Forecast - by Geography
- 6.5.1. China
- 6.5.2. India
- 6.5.3. Japan
- 6.5.4. South Korea
- 6.5.5. Australia & New Zealand
- 6.5.6. Rest of Asia-Pacific
- 6.1. Market Analysis, Insights and Forecast - by Feedstock
- 7. China Asia Pacific Syngas Industry Analysis, Insights and Forecast, 2020-2032
- 7.1. Market Analysis, Insights and Forecast - by Feedstock
- 7.1.1. Coal
- 7.1.2. Natural Gas
- 7.1.3. Petroleum
- 7.1.4. Pet Coke
- 7.1.5. Biomass
- 7.2. Market Analysis, Insights and Forecast - by Technology
- 7.2.1. Steam Reforming
- 7.2.2. Partial Oxidation
- 7.2.3. Auto-thermal Reforming
- 7.2.4. Combined or Two-step Reforming
- 7.2.5. Biomass Gasification
- 7.3. Market Analysis, Insights and Forecast - by Gasifier Type
- 7.3.1. Fixed Bed
- 7.3.2. Entrained Flow
- 7.3.3. Fluidized Bed
- 7.4. Market Analysis, Insights and Forecast - by Application
- 7.4.1. Power Generation
- 7.4.2. Chemicals
- 7.4.2.1. Methanol
- 7.4.2.2. Ammonia
- 7.4.2.3. Oxo Chemicals
- 7.4.2.4. n-Butanol
- 7.4.2.5. Hydrogen
- 7.4.2.6. Dimethyl Ether
- 7.4.3. Liquid Fuels
- 7.4.4. Gaseous Fuels
- 7.5. Market Analysis, Insights and Forecast - by Geography
- 7.5.1. China
- 7.5.2. India
- 7.5.3. Japan
- 7.5.4. South Korea
- 7.5.5. Australia & New Zealand
- 7.5.6. Rest of Asia-Pacific
- 7.1. Market Analysis, Insights and Forecast - by Feedstock
- 8. India Asia Pacific Syngas Industry Analysis, Insights and Forecast, 2020-2032
- 8.1. Market Analysis, Insights and Forecast - by Feedstock
- 8.1.1. Coal
- 8.1.2. Natural Gas
- 8.1.3. Petroleum
- 8.1.4. Pet Coke
- 8.1.5. Biomass
- 8.2. Market Analysis, Insights and Forecast - by Technology
- 8.2.1. Steam Reforming
- 8.2.2. Partial Oxidation
- 8.2.3. Auto-thermal Reforming
- 8.2.4. Combined or Two-step Reforming
- 8.2.5. Biomass Gasification
- 8.3. Market Analysis, Insights and Forecast - by Gasifier Type
- 8.3.1. Fixed Bed
- 8.3.2. Entrained Flow
- 8.3.3. Fluidized Bed
- 8.4. Market Analysis, Insights and Forecast - by Application
- 8.4.1. Power Generation
- 8.4.2. Chemicals
- 8.4.2.1. Methanol
- 8.4.2.2. Ammonia
- 8.4.2.3. Oxo Chemicals
- 8.4.2.4. n-Butanol
- 8.4.2.5. Hydrogen
- 8.4.2.6. Dimethyl Ether
- 8.4.3. Liquid Fuels
- 8.4.4. Gaseous Fuels
- 8.5. Market Analysis, Insights and Forecast - by Geography
- 8.5.1. China
- 8.5.2. India
- 8.5.3. Japan
- 8.5.4. South Korea
- 8.5.5. Australia & New Zealand
- 8.5.6. Rest of Asia-Pacific
- 8.1. Market Analysis, Insights and Forecast - by Feedstock
- 9. Japan Asia Pacific Syngas Industry Analysis, Insights and Forecast, 2020-2032
- 9.1. Market Analysis, Insights and Forecast - by Feedstock
- 9.1.1. Coal
- 9.1.2. Natural Gas
- 9.1.3. Petroleum
- 9.1.4. Pet Coke
- 9.1.5. Biomass
- 9.2. Market Analysis, Insights and Forecast - by Technology
- 9.2.1. Steam Reforming
- 9.2.2. Partial Oxidation
- 9.2.3. Auto-thermal Reforming
- 9.2.4. Combined or Two-step Reforming
- 9.2.5. Biomass Gasification
- 9.3. Market Analysis, Insights and Forecast - by Gasifier Type
- 9.3.1. Fixed Bed
- 9.3.2. Entrained Flow
- 9.3.3. Fluidized Bed
- 9.4. Market Analysis, Insights and Forecast - by Application
- 9.4.1. Power Generation
- 9.4.2. Chemicals
- 9.4.2.1. Methanol
- 9.4.2.2. Ammonia
- 9.4.2.3. Oxo Chemicals
- 9.4.2.4. n-Butanol
- 9.4.2.5. Hydrogen
- 9.4.2.6. Dimethyl Ether
- 9.4.3. Liquid Fuels
- 9.4.4. Gaseous Fuels
- 9.5. Market Analysis, Insights and Forecast - by Geography
- 9.5.1. China
- 9.5.2. India
- 9.5.3. Japan
- 9.5.4. South Korea
- 9.5.5. Australia & New Zealand
- 9.5.6. Rest of Asia-Pacific
- 9.1. Market Analysis, Insights and Forecast - by Feedstock
- 10. South Korea Asia Pacific Syngas Industry Analysis, Insights and Forecast, 2020-2032
- 10.1. Market Analysis, Insights and Forecast - by Feedstock
- 10.1.1. Coal
- 10.1.2. Natural Gas
- 10.1.3. Petroleum
- 10.1.4. Pet Coke
- 10.1.5. Biomass
- 10.2. Market Analysis, Insights and Forecast - by Technology
- 10.2.1. Steam Reforming
- 10.2.2. Partial Oxidation
- 10.2.3. Auto-thermal Reforming
- 10.2.4. Combined or Two-step Reforming
- 10.2.5. Biomass Gasification
- 10.3. Market Analysis, Insights and Forecast - by Gasifier Type
- 10.3.1. Fixed Bed
- 10.3.2. Entrained Flow
- 10.3.3. Fluidized Bed
- 10.4. Market Analysis, Insights and Forecast - by Application
- 10.4.1. Power Generation
- 10.4.2. Chemicals
- 10.4.2.1. Methanol
- 10.4.2.2. Ammonia
- 10.4.2.3. Oxo Chemicals
- 10.4.2.4. n-Butanol
- 10.4.2.5. Hydrogen
- 10.4.2.6. Dimethyl Ether
- 10.4.3. Liquid Fuels
- 10.4.4. Gaseous Fuels
- 10.5. Market Analysis, Insights and Forecast - by Geography
- 10.5.1. China
- 10.5.2. India
- 10.5.3. Japan
- 10.5.4. South Korea
- 10.5.5. Australia & New Zealand
- 10.5.6. Rest of Asia-Pacific
- 10.1. Market Analysis, Insights and Forecast - by Feedstock
- 11. Australia Asia Pacific Syngas Industry Analysis, Insights and Forecast, 2020-2032
- 11.1. Market Analysis, Insights and Forecast - by Feedstock
- 11.1.1. Coal
- 11.1.2. Natural Gas
- 11.1.3. Petroleum
- 11.1.4. Pet Coke
- 11.1.5. Biomass
- 11.2. Market Analysis, Insights and Forecast - by Technology
- 11.2.1. Steam Reforming
- 11.2.2. Partial Oxidation
- 11.2.3. Auto-thermal Reforming
- 11.2.4. Combined or Two-step Reforming
- 11.2.5. Biomass Gasification
- 11.3. Market Analysis, Insights and Forecast - by Gasifier Type
- 11.3.1. Fixed Bed
- 11.3.2. Entrained Flow
- 11.3.3. Fluidized Bed
- 11.4. Market Analysis, Insights and Forecast - by Application
- 11.4.1. Power Generation
- 11.4.2. Chemicals
- 11.4.2.1. Methanol
- 11.4.2.2. Ammonia
- 11.4.2.3. Oxo Chemicals
- 11.4.2.4. n-Butanol
- 11.4.2.5. Hydrogen
- 11.4.2.6. Dimethyl Ether
- 11.4.3. Liquid Fuels
- 11.4.4. Gaseous Fuels
- 11.5. Market Analysis, Insights and Forecast - by Geography
- 11.5.1. China
- 11.5.2. India
- 11.5.3. Japan
- 11.5.4. South Korea
- 11.5.5. Australia & New Zealand
- 11.5.6. Rest of Asia-Pacific
- 11.1. Market Analysis, Insights and Forecast - by Feedstock
- 12. Rest of Asia Pacific Asia Pacific Syngas Industry Analysis, Insights and Forecast, 2020-2032
- 12.1. Market Analysis, Insights and Forecast - by Feedstock
- 12.1.1. Coal
- 12.1.2. Natural Gas
- 12.1.3. Petroleum
- 12.1.4. Pet Coke
- 12.1.5. Biomass
- 12.2. Market Analysis, Insights and Forecast - by Technology
- 12.2.1. Steam Reforming
- 12.2.2. Partial Oxidation
- 12.2.3. Auto-thermal Reforming
- 12.2.4. Combined or Two-step Reforming
- 12.2.5. Biomass Gasification
- 12.3. Market Analysis, Insights and Forecast - by Gasifier Type
- 12.3.1. Fixed Bed
- 12.3.2. Entrained Flow
- 12.3.3. Fluidized Bed
- 12.4. Market Analysis, Insights and Forecast - by Application
- 12.4.1. Power Generation
- 12.4.2. Chemicals
- 12.4.2.1. Methanol
- 12.4.2.2. Ammonia
- 12.4.2.3. Oxo Chemicals
- 12.4.2.4. n-Butanol
- 12.4.2.5. Hydrogen
- 12.4.2.6. Dimethyl Ether
- 12.4.3. Liquid Fuels
- 12.4.4. Gaseous Fuels
- 12.5. Market Analysis, Insights and Forecast - by Geography
- 12.5.1. China
- 12.5.2. India
- 12.5.3. Japan
- 12.5.4. South Korea
- 12.5.5. Australia & New Zealand
- 12.5.6. Rest of Asia-Pacific
- 12.1. Market Analysis, Insights and Forecast - by Feedstock
- 13. Competitive Analysis
- 13.1. Company Profiles
- 13.1.1 Haldor Topsoe A/S
- 13.1.1.1. Company Overview
- 13.1.1.2. Products
- 13.1.1.3. Company Financials
- 13.1.1.4. SWOT Analysis
- 13.1.2 General Electric
- 13.1.2.1. Company Overview
- 13.1.2.2. Products
- 13.1.2.3. Company Financials
- 13.1.2.4. SWOT Analysis
- 13.1.3 Air Products and Chemicals Inc
- 13.1.3.1. Company Overview
- 13.1.3.2. Products
- 13.1.3.3. Company Financials
- 13.1.3.4. SWOT Analysis
- 13.1.4 Royal Dutch Shell plc
- 13.1.4.1. Company Overview
- 13.1.4.2. Products
- 13.1.4.3. Company Financials
- 13.1.4.4. SWOT Analysis
- 13.1.5 Siemens
- 13.1.5.1. Company Overview
- 13.1.5.2. Products
- 13.1.5.3. Company Financials
- 13.1.5.4. SWOT Analysis
- 13.1.6 KBR Inc
- 13.1.6.1. Company Overview
- 13.1.6.2. Products
- 13.1.6.3. Company Financials
- 13.1.6.4. SWOT Analysis
- 13.1.7 BASF SE
- 13.1.7.1. Company Overview
- 13.1.7.2. Products
- 13.1.7.3. Company Financials
- 13.1.7.4. SWOT Analysis
- 13.1.8 Sasol
- 13.1.8.1. Company Overview
- 13.1.8.2. Products
- 13.1.8.3. Company Financials
- 13.1.8.4. SWOT Analysis
- 13.1.9 DuPont
- 13.1.9.1. Company Overview
- 13.1.9.2. Products
- 13.1.9.3. Company Financials
- 13.1.9.4. SWOT Analysis
- 13.1.10 Linde plc
- 13.1.10.1. Company Overview
- 13.1.10.2. Products
- 13.1.10.3. Company Financials
- 13.1.10.4. SWOT Analysis
- 13.1.11 SynGas Technology LLC
- 13.1.11.1. Company Overview
- 13.1.11.2. Products
- 13.1.11.3. Company Financials
- 13.1.11.4. SWOT Analysis
- 13.1.12 Air Liquide
- 13.1.12.1. Company Overview
- 13.1.12.2. Products
- 13.1.12.3. Company Financials
- 13.1.12.4. SWOT Analysis
- 13.1.13 BP p l c
- 13.1.13.1. Company Overview
- 13.1.13.2. Products
- 13.1.13.3. Company Financials
- 13.1.13.4. SWOT Analysis
- 13.1.14 TechnipFMC plc*List Not Exhaustive
- 13.1.14.1. Company Overview
- 13.1.14.2. Products
- 13.1.14.3. Company Financials
- 13.1.14.4. SWOT Analysis
- 13.1.1 Haldor Topsoe A/S
- 13.2. Market Entropy
- 13.2.1 Company's Key Areas Served
- 13.2.2 Recent Developments
- 13.3. Company Market Share Analysis 2025
- 13.3.1 Top 5 Companies Market Share Analysis
- 13.3.2 Top 3 Companies Market Share Analysis
- 13.4. List of Potential Customers
- 14. Research Methodology
List of Figures
- Figure 1: Asia Pacific Syngas Industry Revenue Breakdown (billion, %) by Product 2025 & 2033
- Figure 2: Asia Pacific Syngas Industry Share (%) by Company 2025
List of Tables
- Table 1: Asia Pacific Syngas Industry Revenue billion Forecast, by Feedstock 2020 & 2033
- Table 2: Asia Pacific Syngas Industry Volume Million Forecast, by Feedstock 2020 & 2033
- Table 3: Asia Pacific Syngas Industry Revenue billion Forecast, by Technology 2020 & 2033
- Table 4: Asia Pacific Syngas Industry Volume Million Forecast, by Technology 2020 & 2033
- Table 5: Asia Pacific Syngas Industry Revenue billion Forecast, by Gasifier Type 2020 & 2033
- Table 6: Asia Pacific Syngas Industry Volume Million Forecast, by Gasifier Type 2020 & 2033
- Table 7: Asia Pacific Syngas Industry Revenue billion Forecast, by Application 2020 & 2033
- Table 8: Asia Pacific Syngas Industry Volume Million Forecast, by Application 2020 & 2033
- Table 9: Asia Pacific Syngas Industry Revenue billion Forecast, by Geography 2020 & 2033
- Table 10: Asia Pacific Syngas Industry Volume Million Forecast, by Geography 2020 & 2033
- Table 11: Asia Pacific Syngas Industry Revenue billion Forecast, by Region 2020 & 2033
- Table 12: Asia Pacific Syngas Industry Volume Million Forecast, by Region 2020 & 2033
- Table 13: Asia Pacific Syngas Industry Revenue billion Forecast, by Feedstock 2020 & 2033
- Table 14: Asia Pacific Syngas Industry Volume Million Forecast, by Feedstock 2020 & 2033
- Table 15: Asia Pacific Syngas Industry Revenue billion Forecast, by Technology 2020 & 2033
- Table 16: Asia Pacific Syngas Industry Volume Million Forecast, by Technology 2020 & 2033
- Table 17: Asia Pacific Syngas Industry Revenue billion Forecast, by Gasifier Type 2020 & 2033
- Table 18: Asia Pacific Syngas Industry Volume Million Forecast, by Gasifier Type 2020 & 2033
- Table 19: Asia Pacific Syngas Industry Revenue billion Forecast, by Application 2020 & 2033
- Table 20: Asia Pacific Syngas Industry Volume Million Forecast, by Application 2020 & 2033
- Table 21: Asia Pacific Syngas Industry Revenue billion Forecast, by Geography 2020 & 2033
- Table 22: Asia Pacific Syngas Industry Volume Million Forecast, by Geography 2020 & 2033
- Table 23: Asia Pacific Syngas Industry Revenue billion Forecast, by Country 2020 & 2033
- Table 24: Asia Pacific Syngas Industry Volume Million Forecast, by Country 2020 & 2033
- Table 25: Asia Pacific Syngas Industry Revenue billion Forecast, by Feedstock 2020 & 2033
- Table 26: Asia Pacific Syngas Industry Volume Million Forecast, by Feedstock 2020 & 2033
- Table 27: Asia Pacific Syngas Industry Revenue billion Forecast, by Technology 2020 & 2033
- Table 28: Asia Pacific Syngas Industry Volume Million Forecast, by Technology 2020 & 2033
- Table 29: Asia Pacific Syngas Industry Revenue billion Forecast, by Gasifier Type 2020 & 2033
- Table 30: Asia Pacific Syngas Industry Volume Million Forecast, by Gasifier Type 2020 & 2033
- Table 31: Asia Pacific Syngas Industry Revenue billion Forecast, by Application 2020 & 2033
- Table 32: Asia Pacific Syngas Industry Volume Million Forecast, by Application 2020 & 2033
- Table 33: Asia Pacific Syngas Industry Revenue billion Forecast, by Geography 2020 & 2033
- Table 34: Asia Pacific Syngas Industry Volume Million Forecast, by Geography 2020 & 2033
- Table 35: Asia Pacific Syngas Industry Revenue billion Forecast, by Country 2020 & 2033
- Table 36: Asia Pacific Syngas Industry Volume Million Forecast, by Country 2020 & 2033
- Table 37: Asia Pacific Syngas Industry Revenue billion Forecast, by Feedstock 2020 & 2033
- Table 38: Asia Pacific Syngas Industry Volume Million Forecast, by Feedstock 2020 & 2033
- Table 39: Asia Pacific Syngas Industry Revenue billion Forecast, by Technology 2020 & 2033
- Table 40: Asia Pacific Syngas Industry Volume Million Forecast, by Technology 2020 & 2033
- Table 41: Asia Pacific Syngas Industry Revenue billion Forecast, by Gasifier Type 2020 & 2033
- Table 42: Asia Pacific Syngas Industry Volume Million Forecast, by Gasifier Type 2020 & 2033
- Table 43: Asia Pacific Syngas Industry Revenue billion Forecast, by Application 2020 & 2033
- Table 44: Asia Pacific Syngas Industry Volume Million Forecast, by Application 2020 & 2033
- Table 45: Asia Pacific Syngas Industry Revenue billion Forecast, by Geography 2020 & 2033
- Table 46: Asia Pacific Syngas Industry Volume Million Forecast, by Geography 2020 & 2033
- Table 47: Asia Pacific Syngas Industry Revenue billion Forecast, by Country 2020 & 2033
- Table 48: Asia Pacific Syngas Industry Volume Million Forecast, by Country 2020 & 2033
- Table 49: Asia Pacific Syngas Industry Revenue billion Forecast, by Feedstock 2020 & 2033
- Table 50: Asia Pacific Syngas Industry Volume Million Forecast, by Feedstock 2020 & 2033
- Table 51: Asia Pacific Syngas Industry Revenue billion Forecast, by Technology 2020 & 2033
- Table 52: Asia Pacific Syngas Industry Volume Million Forecast, by Technology 2020 & 2033
- Table 53: Asia Pacific Syngas Industry Revenue billion Forecast, by Gasifier Type 2020 & 2033
- Table 54: Asia Pacific Syngas Industry Volume Million Forecast, by Gasifier Type 2020 & 2033
- Table 55: Asia Pacific Syngas Industry Revenue billion Forecast, by Application 2020 & 2033
- Table 56: Asia Pacific Syngas Industry Volume Million Forecast, by Application 2020 & 2033
- Table 57: Asia Pacific Syngas Industry Revenue billion Forecast, by Geography 2020 & 2033
- Table 58: Asia Pacific Syngas Industry Volume Million Forecast, by Geography 2020 & 2033
- Table 59: Asia Pacific Syngas Industry Revenue billion Forecast, by Country 2020 & 2033
- Table 60: Asia Pacific Syngas Industry Volume Million Forecast, by Country 2020 & 2033
- Table 61: Asia Pacific Syngas Industry Revenue billion Forecast, by Feedstock 2020 & 2033
- Table 62: Asia Pacific Syngas Industry Volume Million Forecast, by Feedstock 2020 & 2033
- Table 63: Asia Pacific Syngas Industry Revenue billion Forecast, by Technology 2020 & 2033
- Table 64: Asia Pacific Syngas Industry Volume Million Forecast, by Technology 2020 & 2033
- Table 65: Asia Pacific Syngas Industry Revenue billion Forecast, by Gasifier Type 2020 & 2033
- Table 66: Asia Pacific Syngas Industry Volume Million Forecast, by Gasifier Type 2020 & 2033
- Table 67: Asia Pacific Syngas Industry Revenue billion Forecast, by Application 2020 & 2033
- Table 68: Asia Pacific Syngas Industry Volume Million Forecast, by Application 2020 & 2033
- Table 69: Asia Pacific Syngas Industry Revenue billion Forecast, by Geography 2020 & 2033
- Table 70: Asia Pacific Syngas Industry Volume Million Forecast, by Geography 2020 & 2033
- Table 71: Asia Pacific Syngas Industry Revenue billion Forecast, by Country 2020 & 2033
- Table 72: Asia Pacific Syngas Industry Volume Million Forecast, by Country 2020 & 2033
- Table 73: Asia Pacific Syngas Industry Revenue billion Forecast, by Feedstock 2020 & 2033
- Table 74: Asia Pacific Syngas Industry Volume Million Forecast, by Feedstock 2020 & 2033
- Table 75: Asia Pacific Syngas Industry Revenue billion Forecast, by Technology 2020 & 2033
- Table 76: Asia Pacific Syngas Industry Volume Million Forecast, by Technology 2020 & 2033
- Table 77: Asia Pacific Syngas Industry Revenue billion Forecast, by Gasifier Type 2020 & 2033
- Table 78: Asia Pacific Syngas Industry Volume Million Forecast, by Gasifier Type 2020 & 2033
- Table 79: Asia Pacific Syngas Industry Revenue billion Forecast, by Application 2020 & 2033
- Table 80: Asia Pacific Syngas Industry Volume Million Forecast, by Application 2020 & 2033
- Table 81: Asia Pacific Syngas Industry Revenue billion Forecast, by Geography 2020 & 2033
- Table 82: Asia Pacific Syngas Industry Volume Million Forecast, by Geography 2020 & 2033
- Table 83: Asia Pacific Syngas Industry Revenue billion Forecast, by Country 2020 & 2033
- Table 84: Asia Pacific Syngas Industry Volume Million Forecast, by Country 2020 & 2033
Frequently Asked Questions
1. What is the projected Compound Annual Growth Rate (CAGR) of the Asia Pacific Syngas Industry?
The projected CAGR is approximately 6.4%.
2. Which companies are prominent players in the Asia Pacific Syngas Industry?
Key companies in the market include Haldor Topsoe A/S, General Electric, Air Products and Chemicals Inc, Royal Dutch Shell plc, Siemens, KBR Inc, BASF SE, Sasol, DuPont, Linde plc, SynGas Technology LLC, Air Liquide, BP p l c, TechnipFMC plc*List Not Exhaustive.
3. What are the main segments of the Asia Pacific Syngas Industry?
The market segments include Feedstock, Technology, Gasifier Type, Application, Geography.
4. Can you provide details about the market size?
The market size is estimated to be USD 44.39 billion as of 2022.
5. What are some drivers contributing to market growth?
Feedstock Flexibility for Syngas Production; Growing Demand in the Electricity and Chemical Industries; Increasing Hydrogen Demand for Fertilizers.
6. What are the notable trends driving market growth?
Ammonia Application Segment to Dominate the Market.
7. Are there any restraints impacting market growth?
High Capital Investment and Funding; Other Restraints.
8. Can you provide examples of recent developments in the market?
September 2023: BASF SE initiated the construction of its syngas plant at the Verbund site in Zhanjiang, China. Anticipated to become operational in 2025, this facility marks a strategic move by BASF SE to bolster its syngas production capacity in China.
9. What pricing options are available for accessing the report?
Pricing options include single-user, multi-user, and enterprise licenses priced at USD 4750, USD 5250, and USD 8750 respectively.
10. Is the market size provided in terms of value or volume?
The market size is provided in terms of value, measured in billion and volume, measured in Million.
11. Are there any specific market keywords associated with the report?
Yes, the market keyword associated with the report is "Asia Pacific Syngas Industry," which aids in identifying and referencing the specific market segment covered.
12. How do I determine which pricing option suits my needs best?
The pricing options vary based on user requirements and access needs. Individual users may opt for single-user licenses, while businesses requiring broader access may choose multi-user or enterprise licenses for cost-effective access to the report.
13. Are there any additional resources or data provided in the Asia Pacific Syngas Industry report?
While the report offers comprehensive insights, it's advisable to review the specific contents or supplementary materials provided to ascertain if additional resources or data are available.
14. How can I stay updated on further developments or reports in the Asia Pacific Syngas Industry?
To stay informed about further developments, trends, and reports in the Asia Pacific Syngas Industry, consider subscribing to industry newsletters, following relevant companies and organizations, or regularly checking reputable industry news sources and publications.
Methodology
Step 1 - Identification of Relevant Samples Size from Population Database


Step 2 - Approaches for Defining Global Market Size (Value, Volume* & Price*)

Note*: In applicable scenarios
Step 3 - Data Sources
Primary Research
- Web Analytics
- Survey Reports
- Research Institute
- Latest Research Reports
- Opinion Leaders
Secondary Research
- Annual Reports
- White Paper
- Latest Press Release
- Industry Association
- Paid Database
- Investor Presentations

Step 4 - Data Triangulation
Involves using different sources of information in order to increase the validity of a study
These sources are likely to be stakeholders in a program - participants, other researchers, program staff, other community members, and so on.
Then we put all data in single framework & apply various statistical tools to find out the dynamic on the market.
During the analysis stage, feedback from the stakeholder groups would be compared to determine areas of agreement as well as areas of divergence