

Key Insights
The Automotive Selective Catalytic Reduction (SCR) market is projected for significant growth, fueled by stringent global emission mandates and the expanding deployment of diesel vehicles, especially in commercial transport. This expansion is anticipated to continue through 2033. Key growth catalysts include escalating demand for improved air quality, leading to stricter nitrogen oxide (NOx) emission standards enforced by regulatory bodies worldwide. Consequently, the widespread integration of SCR technology in vehicles is essential for compliance. Technological innovations in catalyst design, enhancing efficiency and cost-effectiveness of SCR systems, further stimulate market expansion. Heavy-duty vehicles, such as trucks and buses, are primary drivers of demand within the automotive sector. Asia Pacific, particularly China and India, demonstrates substantial growth potential, driven by rapid industrialization and increasing vehicle populations. Challenges include the initial investment costs for SCR system integration and the management of ammonia slip. Despite these hurdles, the market outlook is positive, supported by ongoing innovation and governmental initiatives.
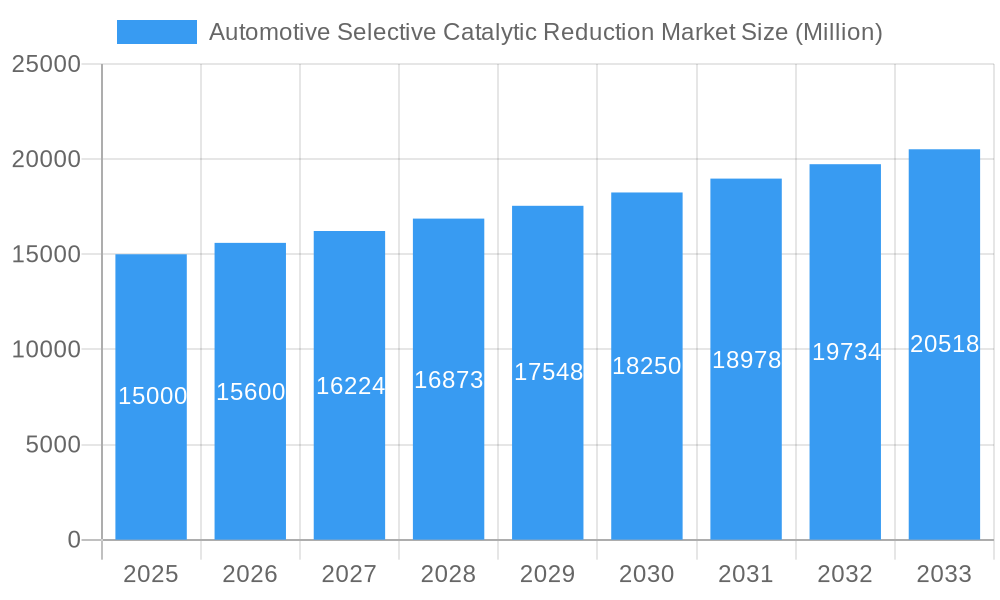
Automotive Selective Catalytic Reduction Market Market Size (In Billion)
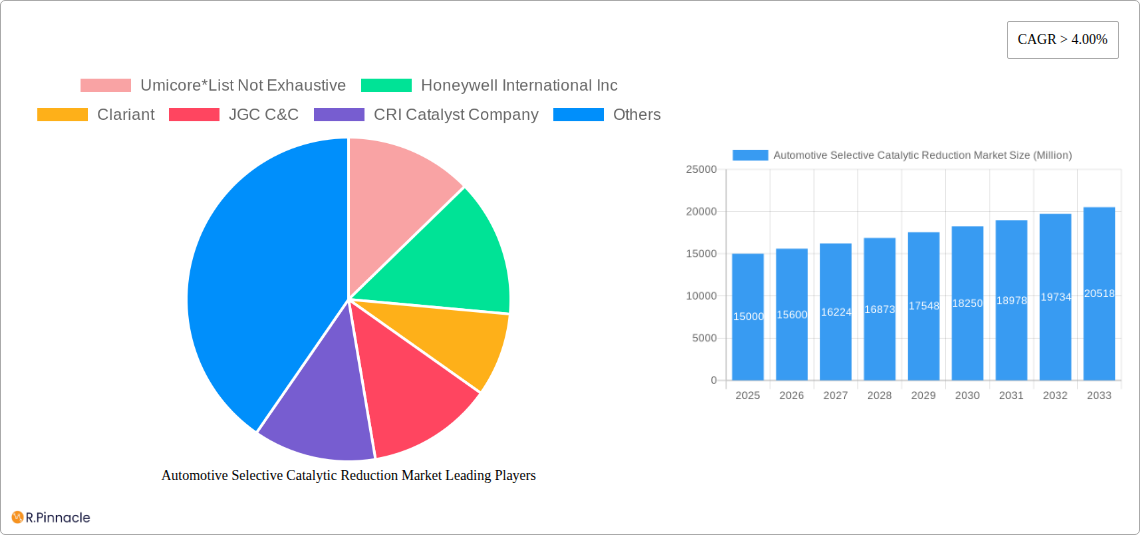
In process type segmentation, Selective Catalytic Reduction (SCR) leads due to its high NOx reduction efficiency. Power generation (non-coal) and industrial sectors are significant application contributors. Honeycomb catalysts command a substantial share within catalyst types, owing to their superior surface area and performance. Leading market participants driving innovation and competition include Umicore, Honeywell, Clariant, and Johnson Matthey. The competitive environment is characterized by ongoing research and development focused on enhancing catalyst durability, minimizing ammonia slip, and reducing the overall cost of SCR systems. The forecast period (2025-2033) indicates sustained market expansion, driven by regulatory pressures, technological advancements, and growing environmental awareness. Future market growth will be significantly influenced by evolving regulatory frameworks and the pace of innovation in SCR system cost reduction and efficiency improvement.
Automotive Selective Catalytic Reduction Market Company Market Share
The Automotive Selective Catalytic Reduction (SCR) market is projected to reach $13.22 billion by 2025, with a Compound Annual Growth Rate (CAGR) of 11.8% during the forecast period (2025-2033). This robust growth is primarily attributed to tightening emission regulations and the increasing adoption of diesel vehicles, particularly in commercial applications.
Automotive Selective Catalytic Reduction Market Report: 2019-2033
This comprehensive report provides an in-depth analysis of the Automotive Selective Catalytic Reduction (SCR) market, offering valuable insights for industry professionals, investors, and stakeholders. Covering the period from 2019 to 2033, with a focus on 2025, this report dissects market dynamics, competitive landscapes, and future growth prospects. The report utilizes rigorous data analysis and expert forecasting to deliver actionable intelligence. The market is projected to reach xx Million by 2033.
Automotive Selective Catalytic Reduction Market Structure & Innovation Trends
This section analyzes the market's competitive landscape, focusing on market concentration, innovation drivers, and regulatory influences shaping the Automotive SCR market. We examine mergers and acquisitions (M&A) activity, assessing their impact on market share and overall dynamics. The study period (2019-2024) reveals a moderately consolidated market with key players holding significant shares, though the exact figures vary based on segment and region. We delve into the factors driving innovation, such as stringent emission regulations, the pursuit of improved fuel efficiency, and the development of advanced catalyst technologies.
- Market Concentration: The market shows a moderate level of concentration, with the top 5 players holding approximately xx% of the global market share in 2024.
- Innovation Drivers: Stringent emission standards (e.g., Euro VII, China VI) are the primary driver, pushing for more efficient and durable SCR systems. Advancements in catalyst materials and system designs contribute significantly.
- Regulatory Frameworks: Government regulations concerning NOx emissions play a crucial role in shaping market growth and technological advancements. Variations in regulations across regions significantly impact market dynamics.
- Product Substitutes: While SCR remains dominant, alternative technologies like selective non-catalytic reduction (SNCR) and other after-treatment systems pose some level of competition. However, SCR's overall effectiveness and maturity make it the preferred solution.
- End-User Demographics: The automotive industry, specifically heavy-duty vehicles and commercial fleets, are the primary end-users, followed by certain off-road applications.
- M&A Activities: Several M&A activities, with deal values totaling approximately xx Million between 2019 and 2024, demonstrate industry consolidation and strategic expansion.
Automotive Selective Catalytic Reduction Market Dynamics & Trends
This section provides a comprehensive overview of market growth drivers, technological advancements, evolving consumer preferences, and the competitive landscape of the Automotive SCR market. We assess the Compound Annual Growth Rate (CAGR) and market penetration rate throughout the forecast period (2025-2033). The market is experiencing robust growth driven by several interconnected factors, including increasingly stringent emission norms, expanding vehicle production, and rising demand from emerging economies.
Technological advancements in catalyst design, material science, and system integration are critical factors influencing market dynamics. The increasing adoption of advanced driver-assistance systems (ADAS) and the shift towards electric and hybrid vehicles also impact the market. Competitive dynamics are characterized by intense rivalry among established players and emerging entrants. The CAGR for the forecast period (2025-2033) is estimated at xx%, driven by factors like increasing adoption of SCR technology in emerging markets and the development of new catalyst formulations. The market penetration rate is expected to reach xx% by 2033.
Dominant Regions & Segments in Automotive Selective Catalytic Reduction Market
This section identifies the leading regions, countries, and market segments within the Automotive SCR market. We analyze key drivers for each segment including process type (Selective Catalytic Reduction, Non-selective Catalytic Reduction, Diesel Particulate Filters, Catalytic Oxidation), application (Power Generation (Excluding Coal based), Coal-based Thermal Power Generation, Industrial), and catalyst type (Honeycomb Catalyst, Plate Catalyst, Corrugated Catalyst).
Leading Regions: North America and Europe currently hold significant market shares due to stringent emission regulations and established automotive industries. Asia-Pacific is showing rapid growth due to expanding automotive production and rising environmental concerns.
Dominant Segments:
- Process Type: Selective Catalytic Reduction (SCR) dominates due to its superior NOx reduction capabilities.
- Application: The automotive industry, particularly heavy-duty vehicles, represents the largest application segment.
- Catalyst Type: Honeycomb catalysts hold a larger market share due to their high surface area and efficient NOx conversion.
Key Drivers (by region and segment):
- North America: Stringent emission standards, robust automotive industry, and technological advancements.
- Europe: Similar to North America, stringent regulations, a large automotive market, and focus on environmental sustainability.
- Asia-Pacific: Rapid economic growth, increasing vehicle production, and growing awareness of environmental issues.
Automotive Selective Catalytic Reduction Market Product Innovations
The Automotive SCR market is characterized by a dynamic landscape of product innovations, driven by the imperative for cleaner emissions and enhanced vehicle performance. Recent advancements are centered on developing next-generation catalyst formulations that exhibit superior NOx reduction efficiency across a wider temperature range, even under challenging operating conditions. This includes the exploration of novel materials such as advanced zeolites and precious metal-free catalysts, aiming to improve durability and reduce reliance on expensive components. System design innovations are focusing on miniaturization and improved integration, enabling seamless fitting into increasingly constrained engine compartments. Furthermore, smarter thermal management strategies and integrated sensor technologies are being developed to optimize the SCR system's operational efficiency and reduce DEF (Diesel Exhaust Fluid) consumption, ultimately leading to lower operating costs for consumers and a reduced environmental footprint.
Report Scope & Segmentation Analysis
This report offers an in-depth analysis of the Automotive SCR market, meticulously segmenting it to provide a comprehensive understanding of its various facets. The segmentation is based on key parameters including process type, application, and catalyst type, offering granular insights into market dynamics and growth trajectories.
-
Process Type: The market is segmented into key emission control processes, including Selective Catalytic Reduction (SCR), Non-selective Catalytic Reduction (NSR), Diesel Particulate Filters (DPF), and Catalytic Oxidation (CO). While SCR currently dominates the market share due to its effectiveness in NOx reduction, DPF systems also hold a significant position. Growth projections are influenced by regional emission standards and the specific technological advantages of each process. The trend towards cleaner diesel technologies is expected to further bolster the growth of SCR and advanced DPF solutions.
-
Application: The SCR market is analyzed across diverse applications such as power generation (excluding coal-based), coal-based thermal power generation, and industrial sectors. However, the automotive industry remains the primary driver of demand, with consistent growth anticipated. Beyond automotive, steady expansion is also projected in the power generation and industrial segments as stricter emission regulations are implemented globally, necessitating the adoption of effective NOx control technologies.
-
Catalyst Type: The segmentation by catalyst type includes Honeycomb Catalysts, Plate Catalysts, and Corrugated Catalysts. Honeycomb catalysts currently command the largest market share due to their well-established performance characteristics and reliability in NOx reduction. However, ongoing research into plate and corrugated catalyst designs aims to offer potential advantages in terms of cost-effectiveness, packaging, and specific application suitability. Market dynamics and future growth prospects are closely tied to the evolution and adoption of these distinct catalyst architectures.
Key Drivers of Automotive Selective Catalytic Reduction Market Growth
The growth of the Automotive SCR market is propelled by several interconnected factors. Stringent government regulations mandating lower NOx emissions are the primary driver, pushing for wider adoption of SCR technologies. The increasing production of heavy-duty vehicles and commercial fleets, along with rising environmental awareness, also contribute to market growth. Advancements in catalyst materials and system designs, aiming for higher efficiency and durability, further fuel market expansion.
Challenges in the Automotive Selective Catalytic Reduction Market Sector
Despite the growth potential, the Automotive SCR market faces several challenges. High initial investment costs for SCR systems can hinder adoption, especially in developing countries. The availability and cost of raw materials used in catalyst production pose potential supply chain issues, impacting production capacity and costs. Furthermore, intense competition among established players and emerging entrants creates pricing pressure. The need for regular maintenance and replacement of SCR components also adds to the operational costs, posing a barrier for some users.
Emerging Opportunities in Automotive Selective Catalytic Reduction Market
The Automotive SCR market is ripe with emerging opportunities, fueled by global sustainability initiatives and technological advancements. A significant avenue lies in the expanding adoption of SCR systems within emerging economies, driven by the implementation of stricter emission mandates and the growing automotive fleet. Furthermore, the continuous development of novel catalyst formulations, focusing on enhanced performance, increased durability, and reduced susceptibility to poisoning, presents substantial opportunities for manufacturers to offer more cost-effective and efficient solutions. The strategic integration of SCR systems with other advanced emission control technologies, such as exhaust gas recirculation (EGR) and exhaust after-treatment systems, promises synergistic benefits, leading to comprehensive emission reduction. The persistent industry focus on minimizing operational costs, particularly in terms of DEF consumption and system maintenance, is also a fertile ground for innovative product development and market expansion.
Leading Players in the Automotive Selective Catalytic Reduction Market Market
- Umicore
- Honeywell International Inc
- Clariant
- JGC C&C
- CRI Catalyst Company
- DCL International Inc
- CDTi Advanced Materials Inc
- Hitachi Zosen Corporation
- CORMETECH
- BASF SE
- Cataler Corporation
- Johnson Matthey
- IBIDEN Porzellanfabrik Frauenthal
- Corning Incorporated
Key Developments in Automotive Selective Catalytic Reduction Market Industry
- January 2023: Umicore launches a new generation of SCR catalysts with enhanced durability.
- June 2022: Honeywell International Inc. announces a strategic partnership to expand its SCR system manufacturing capacity.
- October 2021: Clariant acquires a smaller SCR catalyst manufacturer, expanding its market share.
- (Add further developments with year/month and impact on market dynamics)
Future Outlook for Automotive Selective Catalytic Reduction Market Market
The future outlook for the Automotive SCR market is exceptionally robust and poised for sustained growth. The unwavering commitment of governments worldwide to enforce stringent emission regulations, particularly for nitrogen oxides (NOx), will continue to be the primary catalyst for market expansion. This regulatory push is especially pronounced in developing regions that are rapidly urbanizing and witnessing an increase in vehicle density. Technological advancements are expected to play a pivotal role, with ongoing research and development leading to the creation of more efficient, compact, and cost-effective catalyst materials and SCR system designs. The synergistic integration of SCR technology with other emission control systems will further enhance overall system performance and market penetration. Consequently, the Automotive SCR market is projected to experience significant and consistent growth in the coming years, driven by both regulatory pressures and technological innovation.
Automotive Selective Catalytic Reduction Market Segmentation
-
1. Catalyst Type
- 1.1. Honeycomb Catalyst
- 1.2. Plate Catalyst
- 1.3. Corrugated Catalyst
-
2. Process Type
- 2.1. Selective Catalytic Reduction
- 2.2. Non-selective Catalytic Reduction
- 2.3. Diesel Particulate Filters
- 2.4. Catalytic Oxidation
-
3. Application
- 3.1. Power Generation (Excluding Coal based)
- 3.2. Coal-based Thermal Power Generation
- 3.3. Industrial
Automotive Selective Catalytic Reduction Market Segmentation By Geography
-
1. Asia Pacific
- 1.1. China
- 1.2. India
- 1.3. Japan
- 1.4. South Korea
- 1.5. ASEAN Countries
- 1.6. Rest of Asia Pacific
-
2. North America
- 2.1. United States
- 2.2. Canada
- 2.3. Mexico
-
3. Europe
- 3.1. Germany
- 3.2. United Kingdom
- 3.3. Italy
- 3.4. Russia
- 3.5. Rest of the Europe
-
4. South America
- 4.1. Brazil
- 4.2. Argentina
- 4.3. Rest of South America
-
5. Middle East and Africa
- 5.1. Saudi Arabia
- 5.2. South Africa
- 5.3. Rest of Middle East and Africa
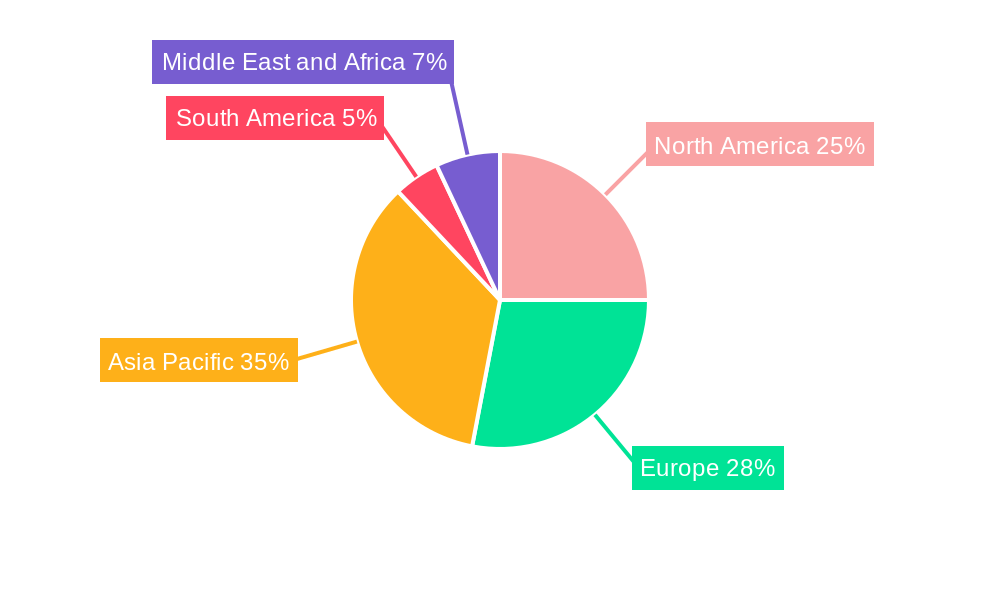
Automotive Selective Catalytic Reduction Market Regional Market Share
Geographic Coverage of Automotive Selective Catalytic Reduction Market
Automotive Selective Catalytic Reduction Market REPORT HIGHLIGHTS
| Aspects | Details |
|---|---|
| Study Period | 2020-2034 |
| Base Year | 2025 |
| Estimated Year | 2026 |
| Forecast Period | 2026-2034 |
| Historical Period | 2020-2025 |
| Growth Rate | CAGR of 11.8% from 2020-2034 |
| Segmentation |
|
Table of Contents
- 1. Introduction
- 1.1. Research Scope
- 1.2. Market Segmentation
- 1.3. Research Objective
- 1.4. Definitions and Assumptions
- 2. Executive Summary
- 2.1. Market Snapshot
- 3. Market Dynamics
- 3.1. Market Drivers
- 3.2. Market Restrains
- 3.3. Market Trends
- 3.4. Market Opportunities
- 4. Market Factor Analysis
- 4.1. Porters Five Forces
- 4.1.1. Bargaining Power of Suppliers
- 4.1.2. Bargaining Power of Buyers
- 4.1.3. Threat of New Entrants
- 4.1.4. Threat of Substitutes
- 4.1.5. Competitive Rivalry
- 4.2. PESTEL analysis
- 4.3. BCG Analysis
- 4.3.1. Stars (High Growth, High Market Share)
- 4.3.2. Cash Cows (Low Growth, High Market Share)
- 4.3.3. Question Mark (High Growth, Low Market Share)
- 4.3.4. Dogs (Low Growth, Low Market Share)
- 4.4. Ansoff Matrix Analysis
- 4.5. Supply Chain Analysis
- 4.6. Regulatory Landscape
- 4.7. Current Market Potential and Opportunity Assessment (TAM–SAM–SOM Framework)
- 4.8. PRI Analyst Note
- 4.1. Porters Five Forces
- 5. Market Analysis, Insights and Forecast 2021-2033
- 5.1. Market Analysis, Insights and Forecast - by Catalyst Type
- 5.1.1. Honeycomb Catalyst
- 5.1.2. Plate Catalyst
- 5.1.3. Corrugated Catalyst
- 5.2. Market Analysis, Insights and Forecast - by Process Type
- 5.2.1. Selective Catalytic Reduction
- 5.2.2. Non-selective Catalytic Reduction
- 5.2.3. Diesel Particulate Filters
- 5.2.4. Catalytic Oxidation
- 5.3. Market Analysis, Insights and Forecast - by Application
- 5.3.1. Power Generation (Excluding Coal based)
- 5.3.2. Coal-based Thermal Power Generation
- 5.3.3. Industrial
- 5.4. Market Analysis, Insights and Forecast - by Region
- 5.4.1. Asia Pacific
- 5.4.2. North America
- 5.4.3. Europe
- 5.4.4. South America
- 5.4.5. Middle East and Africa
- 5.1. Market Analysis, Insights and Forecast - by Catalyst Type
- 6. Global Automotive Selective Catalytic Reduction Market Analysis, Insights and Forecast, 2021-2033
- 6.1. Market Analysis, Insights and Forecast - by Catalyst Type
- 6.1.1. Honeycomb Catalyst
- 6.1.2. Plate Catalyst
- 6.1.3. Corrugated Catalyst
- 6.2. Market Analysis, Insights and Forecast - by Process Type
- 6.2.1. Selective Catalytic Reduction
- 6.2.2. Non-selective Catalytic Reduction
- 6.2.3. Diesel Particulate Filters
- 6.2.4. Catalytic Oxidation
- 6.3. Market Analysis, Insights and Forecast - by Application
- 6.3.1. Power Generation (Excluding Coal based)
- 6.3.2. Coal-based Thermal Power Generation
- 6.3.3. Industrial
- 6.1. Market Analysis, Insights and Forecast - by Catalyst Type
- 7. Asia Pacific Automotive Selective Catalytic Reduction Market Analysis, Insights and Forecast, 2020-2032
- 7.1. Market Analysis, Insights and Forecast - by Catalyst Type
- 7.1.1. Honeycomb Catalyst
- 7.1.2. Plate Catalyst
- 7.1.3. Corrugated Catalyst
- 7.2. Market Analysis, Insights and Forecast - by Process Type
- 7.2.1. Selective Catalytic Reduction
- 7.2.2. Non-selective Catalytic Reduction
- 7.2.3. Diesel Particulate Filters
- 7.2.4. Catalytic Oxidation
- 7.3. Market Analysis, Insights and Forecast - by Application
- 7.3.1. Power Generation (Excluding Coal based)
- 7.3.2. Coal-based Thermal Power Generation
- 7.3.3. Industrial
- 7.1. Market Analysis, Insights and Forecast - by Catalyst Type
- 8. North America Automotive Selective Catalytic Reduction Market Analysis, Insights and Forecast, 2020-2032
- 8.1. Market Analysis, Insights and Forecast - by Catalyst Type
- 8.1.1. Honeycomb Catalyst
- 8.1.2. Plate Catalyst
- 8.1.3. Corrugated Catalyst
- 8.2. Market Analysis, Insights and Forecast - by Process Type
- 8.2.1. Selective Catalytic Reduction
- 8.2.2. Non-selective Catalytic Reduction
- 8.2.3. Diesel Particulate Filters
- 8.2.4. Catalytic Oxidation
- 8.3. Market Analysis, Insights and Forecast - by Application
- 8.3.1. Power Generation (Excluding Coal based)
- 8.3.2. Coal-based Thermal Power Generation
- 8.3.3. Industrial
- 8.1. Market Analysis, Insights and Forecast - by Catalyst Type
- 9. Europe Automotive Selective Catalytic Reduction Market Analysis, Insights and Forecast, 2020-2032
- 9.1. Market Analysis, Insights and Forecast - by Catalyst Type
- 9.1.1. Honeycomb Catalyst
- 9.1.2. Plate Catalyst
- 9.1.3. Corrugated Catalyst
- 9.2. Market Analysis, Insights and Forecast - by Process Type
- 9.2.1. Selective Catalytic Reduction
- 9.2.2. Non-selective Catalytic Reduction
- 9.2.3. Diesel Particulate Filters
- 9.2.4. Catalytic Oxidation
- 9.3. Market Analysis, Insights and Forecast - by Application
- 9.3.1. Power Generation (Excluding Coal based)
- 9.3.2. Coal-based Thermal Power Generation
- 9.3.3. Industrial
- 9.1. Market Analysis, Insights and Forecast - by Catalyst Type
- 10. South America Automotive Selective Catalytic Reduction Market Analysis, Insights and Forecast, 2020-2032
- 10.1. Market Analysis, Insights and Forecast - by Catalyst Type
- 10.1.1. Honeycomb Catalyst
- 10.1.2. Plate Catalyst
- 10.1.3. Corrugated Catalyst
- 10.2. Market Analysis, Insights and Forecast - by Process Type
- 10.2.1. Selective Catalytic Reduction
- 10.2.2. Non-selective Catalytic Reduction
- 10.2.3. Diesel Particulate Filters
- 10.2.4. Catalytic Oxidation
- 10.3. Market Analysis, Insights and Forecast - by Application
- 10.3.1. Power Generation (Excluding Coal based)
- 10.3.2. Coal-based Thermal Power Generation
- 10.3.3. Industrial
- 10.1. Market Analysis, Insights and Forecast - by Catalyst Type
- 11. Middle East and Africa Automotive Selective Catalytic Reduction Market Analysis, Insights and Forecast, 2020-2032
- 11.1. Market Analysis, Insights and Forecast - by Catalyst Type
- 11.1.1. Honeycomb Catalyst
- 11.1.2. Plate Catalyst
- 11.1.3. Corrugated Catalyst
- 11.2. Market Analysis, Insights and Forecast - by Process Type
- 11.2.1. Selective Catalytic Reduction
- 11.2.2. Non-selective Catalytic Reduction
- 11.2.3. Diesel Particulate Filters
- 11.2.4. Catalytic Oxidation
- 11.3. Market Analysis, Insights and Forecast - by Application
- 11.3.1. Power Generation (Excluding Coal based)
- 11.3.2. Coal-based Thermal Power Generation
- 11.3.3. Industrial
- 11.1. Market Analysis, Insights and Forecast - by Catalyst Type
- 12. Competitive Analysis
- 12.1. Company Profiles
- 12.1.1 Umicore*List Not Exhaustive
- 12.1.1.1. Company Overview
- 12.1.1.2. Products
- 12.1.1.3. Company Financials
- 12.1.1.4. SWOT Analysis
- 12.1.2 Honeywell International Inc
- 12.1.2.1. Company Overview
- 12.1.2.2. Products
- 12.1.2.3. Company Financials
- 12.1.2.4. SWOT Analysis
- 12.1.3 Clariant
- 12.1.3.1. Company Overview
- 12.1.3.2. Products
- 12.1.3.3. Company Financials
- 12.1.3.4. SWOT Analysis
- 12.1.4 JGC C&C
- 12.1.4.1. Company Overview
- 12.1.4.2. Products
- 12.1.4.3. Company Financials
- 12.1.4.4. SWOT Analysis
- 12.1.5 CRI Catalyst Company
- 12.1.5.1. Company Overview
- 12.1.5.2. Products
- 12.1.5.3. Company Financials
- 12.1.5.4. SWOT Analysis
- 12.1.6 DCL International Inc
- 12.1.6.1. Company Overview
- 12.1.6.2. Products
- 12.1.6.3. Company Financials
- 12.1.6.4. SWOT Analysis
- 12.1.7 CDTi Advanced Materials Inc
- 12.1.7.1. Company Overview
- 12.1.7.2. Products
- 12.1.7.3. Company Financials
- 12.1.7.4. SWOT Analysis
- 12.1.8 Hitachi Zosen Corporation
- 12.1.8.1. Company Overview
- 12.1.8.2. Products
- 12.1.8.3. Company Financials
- 12.1.8.4. SWOT Analysis
- 12.1.9 CORMETECH
- 12.1.9.1. Company Overview
- 12.1.9.2. Products
- 12.1.9.3. Company Financials
- 12.1.9.4. SWOT Analysis
- 12.1.10 BASF SE
- 12.1.10.1. Company Overview
- 12.1.10.2. Products
- 12.1.10.3. Company Financials
- 12.1.10.4. SWOT Analysis
- 12.1.11 Cataler Corporation
- 12.1.11.1. Company Overview
- 12.1.11.2. Products
- 12.1.11.3. Company Financials
- 12.1.11.4. SWOT Analysis
- 12.1.12 Johnson Matthey
- 12.1.12.1. Company Overview
- 12.1.12.2. Products
- 12.1.12.3. Company Financials
- 12.1.12.4. SWOT Analysis
- 12.1.13 IBIDEN Porzellanfabrik Frauenthal
- 12.1.13.1. Company Overview
- 12.1.13.2. Products
- 12.1.13.3. Company Financials
- 12.1.13.4. SWOT Analysis
- 12.1.14 Corning Incorporated
- 12.1.14.1. Company Overview
- 12.1.14.2. Products
- 12.1.14.3. Company Financials
- 12.1.14.4. SWOT Analysis
- 12.1.1 Umicore*List Not Exhaustive
- 12.2. Market Entropy
- 12.2.1 Company's Key Areas Served
- 12.2.2 Recent Developments
- 12.3. Company Market Share Analysis 2025
- 12.3.1 Top 5 Companies Market Share Analysis
- 12.3.2 Top 3 Companies Market Share Analysis
- 12.4. List of Potential Customers
- 13. Research Methodology
List of Figures
- Figure 1: Global Automotive Selective Catalytic Reduction Market Revenue Breakdown (billion, %) by Region 2025 & 2033
- Figure 2: Asia Pacific Automotive Selective Catalytic Reduction Market Revenue (billion), by Catalyst Type 2025 & 2033
- Figure 3: Asia Pacific Automotive Selective Catalytic Reduction Market Revenue Share (%), by Catalyst Type 2025 & 2033
- Figure 4: Asia Pacific Automotive Selective Catalytic Reduction Market Revenue (billion), by Process Type 2025 & 2033
- Figure 5: Asia Pacific Automotive Selective Catalytic Reduction Market Revenue Share (%), by Process Type 2025 & 2033
- Figure 6: Asia Pacific Automotive Selective Catalytic Reduction Market Revenue (billion), by Application 2025 & 2033
- Figure 7: Asia Pacific Automotive Selective Catalytic Reduction Market Revenue Share (%), by Application 2025 & 2033
- Figure 8: Asia Pacific Automotive Selective Catalytic Reduction Market Revenue (billion), by Country 2025 & 2033
- Figure 9: Asia Pacific Automotive Selective Catalytic Reduction Market Revenue Share (%), by Country 2025 & 2033
- Figure 10: North America Automotive Selective Catalytic Reduction Market Revenue (billion), by Catalyst Type 2025 & 2033
- Figure 11: North America Automotive Selective Catalytic Reduction Market Revenue Share (%), by Catalyst Type 2025 & 2033
- Figure 12: North America Automotive Selective Catalytic Reduction Market Revenue (billion), by Process Type 2025 & 2033
- Figure 13: North America Automotive Selective Catalytic Reduction Market Revenue Share (%), by Process Type 2025 & 2033
- Figure 14: North America Automotive Selective Catalytic Reduction Market Revenue (billion), by Application 2025 & 2033
- Figure 15: North America Automotive Selective Catalytic Reduction Market Revenue Share (%), by Application 2025 & 2033
- Figure 16: North America Automotive Selective Catalytic Reduction Market Revenue (billion), by Country 2025 & 2033
- Figure 17: North America Automotive Selective Catalytic Reduction Market Revenue Share (%), by Country 2025 & 2033
- Figure 18: Europe Automotive Selective Catalytic Reduction Market Revenue (billion), by Catalyst Type 2025 & 2033
- Figure 19: Europe Automotive Selective Catalytic Reduction Market Revenue Share (%), by Catalyst Type 2025 & 2033
- Figure 20: Europe Automotive Selective Catalytic Reduction Market Revenue (billion), by Process Type 2025 & 2033
- Figure 21: Europe Automotive Selective Catalytic Reduction Market Revenue Share (%), by Process Type 2025 & 2033
- Figure 22: Europe Automotive Selective Catalytic Reduction Market Revenue (billion), by Application 2025 & 2033
- Figure 23: Europe Automotive Selective Catalytic Reduction Market Revenue Share (%), by Application 2025 & 2033
- Figure 24: Europe Automotive Selective Catalytic Reduction Market Revenue (billion), by Country 2025 & 2033
- Figure 25: Europe Automotive Selective Catalytic Reduction Market Revenue Share (%), by Country 2025 & 2033
- Figure 26: South America Automotive Selective Catalytic Reduction Market Revenue (billion), by Catalyst Type 2025 & 2033
- Figure 27: South America Automotive Selective Catalytic Reduction Market Revenue Share (%), by Catalyst Type 2025 & 2033
- Figure 28: South America Automotive Selective Catalytic Reduction Market Revenue (billion), by Process Type 2025 & 2033
- Figure 29: South America Automotive Selective Catalytic Reduction Market Revenue Share (%), by Process Type 2025 & 2033
- Figure 30: South America Automotive Selective Catalytic Reduction Market Revenue (billion), by Application 2025 & 2033
- Figure 31: South America Automotive Selective Catalytic Reduction Market Revenue Share (%), by Application 2025 & 2033
- Figure 32: South America Automotive Selective Catalytic Reduction Market Revenue (billion), by Country 2025 & 2033
- Figure 33: South America Automotive Selective Catalytic Reduction Market Revenue Share (%), by Country 2025 & 2033
- Figure 34: Middle East and Africa Automotive Selective Catalytic Reduction Market Revenue (billion), by Catalyst Type 2025 & 2033
- Figure 35: Middle East and Africa Automotive Selective Catalytic Reduction Market Revenue Share (%), by Catalyst Type 2025 & 2033
- Figure 36: Middle East and Africa Automotive Selective Catalytic Reduction Market Revenue (billion), by Process Type 2025 & 2033
- Figure 37: Middle East and Africa Automotive Selective Catalytic Reduction Market Revenue Share (%), by Process Type 2025 & 2033
- Figure 38: Middle East and Africa Automotive Selective Catalytic Reduction Market Revenue (billion), by Application 2025 & 2033
- Figure 39: Middle East and Africa Automotive Selective Catalytic Reduction Market Revenue Share (%), by Application 2025 & 2033
- Figure 40: Middle East and Africa Automotive Selective Catalytic Reduction Market Revenue (billion), by Country 2025 & 2033
- Figure 41: Middle East and Africa Automotive Selective Catalytic Reduction Market Revenue Share (%), by Country 2025 & 2033
List of Tables
- Table 1: Global Automotive Selective Catalytic Reduction Market Revenue billion Forecast, by Catalyst Type 2020 & 2033
- Table 2: Global Automotive Selective Catalytic Reduction Market Revenue billion Forecast, by Process Type 2020 & 2033
- Table 3: Global Automotive Selective Catalytic Reduction Market Revenue billion Forecast, by Application 2020 & 2033
- Table 4: Global Automotive Selective Catalytic Reduction Market Revenue billion Forecast, by Region 2020 & 2033
- Table 5: Global Automotive Selective Catalytic Reduction Market Revenue billion Forecast, by Catalyst Type 2020 & 2033
- Table 6: Global Automotive Selective Catalytic Reduction Market Revenue billion Forecast, by Process Type 2020 & 2033
- Table 7: Global Automotive Selective Catalytic Reduction Market Revenue billion Forecast, by Application 2020 & 2033
- Table 8: Global Automotive Selective Catalytic Reduction Market Revenue billion Forecast, by Country 2020 & 2033
- Table 9: China Automotive Selective Catalytic Reduction Market Revenue (billion) Forecast, by Application 2020 & 2033
- Table 10: India Automotive Selective Catalytic Reduction Market Revenue (billion) Forecast, by Application 2020 & 2033
- Table 11: Japan Automotive Selective Catalytic Reduction Market Revenue (billion) Forecast, by Application 2020 & 2033
- Table 12: South Korea Automotive Selective Catalytic Reduction Market Revenue (billion) Forecast, by Application 2020 & 2033
- Table 13: ASEAN Countries Automotive Selective Catalytic Reduction Market Revenue (billion) Forecast, by Application 2020 & 2033
- Table 14: Rest of Asia Pacific Automotive Selective Catalytic Reduction Market Revenue (billion) Forecast, by Application 2020 & 2033
- Table 15: Global Automotive Selective Catalytic Reduction Market Revenue billion Forecast, by Catalyst Type 2020 & 2033
- Table 16: Global Automotive Selective Catalytic Reduction Market Revenue billion Forecast, by Process Type 2020 & 2033
- Table 17: Global Automotive Selective Catalytic Reduction Market Revenue billion Forecast, by Application 2020 & 2033
- Table 18: Global Automotive Selective Catalytic Reduction Market Revenue billion Forecast, by Country 2020 & 2033
- Table 19: United States Automotive Selective Catalytic Reduction Market Revenue (billion) Forecast, by Application 2020 & 2033
- Table 20: Canada Automotive Selective Catalytic Reduction Market Revenue (billion) Forecast, by Application 2020 & 2033
- Table 21: Mexico Automotive Selective Catalytic Reduction Market Revenue (billion) Forecast, by Application 2020 & 2033
- Table 22: Global Automotive Selective Catalytic Reduction Market Revenue billion Forecast, by Catalyst Type 2020 & 2033
- Table 23: Global Automotive Selective Catalytic Reduction Market Revenue billion Forecast, by Process Type 2020 & 2033
- Table 24: Global Automotive Selective Catalytic Reduction Market Revenue billion Forecast, by Application 2020 & 2033
- Table 25: Global Automotive Selective Catalytic Reduction Market Revenue billion Forecast, by Country 2020 & 2033
- Table 26: Germany Automotive Selective Catalytic Reduction Market Revenue (billion) Forecast, by Application 2020 & 2033
- Table 27: United Kingdom Automotive Selective Catalytic Reduction Market Revenue (billion) Forecast, by Application 2020 & 2033
- Table 28: Italy Automotive Selective Catalytic Reduction Market Revenue (billion) Forecast, by Application 2020 & 2033
- Table 29: Russia Automotive Selective Catalytic Reduction Market Revenue (billion) Forecast, by Application 2020 & 2033
- Table 30: Rest of the Europe Automotive Selective Catalytic Reduction Market Revenue (billion) Forecast, by Application 2020 & 2033
- Table 31: Global Automotive Selective Catalytic Reduction Market Revenue billion Forecast, by Catalyst Type 2020 & 2033
- Table 32: Global Automotive Selective Catalytic Reduction Market Revenue billion Forecast, by Process Type 2020 & 2033
- Table 33: Global Automotive Selective Catalytic Reduction Market Revenue billion Forecast, by Application 2020 & 2033
- Table 34: Global Automotive Selective Catalytic Reduction Market Revenue billion Forecast, by Country 2020 & 2033
- Table 35: Brazil Automotive Selective Catalytic Reduction Market Revenue (billion) Forecast, by Application 2020 & 2033
- Table 36: Argentina Automotive Selective Catalytic Reduction Market Revenue (billion) Forecast, by Application 2020 & 2033
- Table 37: Rest of South America Automotive Selective Catalytic Reduction Market Revenue (billion) Forecast, by Application 2020 & 2033
- Table 38: Global Automotive Selective Catalytic Reduction Market Revenue billion Forecast, by Catalyst Type 2020 & 2033
- Table 39: Global Automotive Selective Catalytic Reduction Market Revenue billion Forecast, by Process Type 2020 & 2033
- Table 40: Global Automotive Selective Catalytic Reduction Market Revenue billion Forecast, by Application 2020 & 2033
- Table 41: Global Automotive Selective Catalytic Reduction Market Revenue billion Forecast, by Country 2020 & 2033
- Table 42: Saudi Arabia Automotive Selective Catalytic Reduction Market Revenue (billion) Forecast, by Application 2020 & 2033
- Table 43: South Africa Automotive Selective Catalytic Reduction Market Revenue (billion) Forecast, by Application 2020 & 2033
- Table 44: Rest of Middle East and Africa Automotive Selective Catalytic Reduction Market Revenue (billion) Forecast, by Application 2020 & 2033
Frequently Asked Questions
1. What is the projected Compound Annual Growth Rate (CAGR) of the Automotive Selective Catalytic Reduction Market?
The projected CAGR is approximately 11.8%.
2. Which companies are prominent players in the Automotive Selective Catalytic Reduction Market?
Key companies in the market include Umicore*List Not Exhaustive, Honeywell International Inc, Clariant, JGC C&C, CRI Catalyst Company, DCL International Inc, CDTi Advanced Materials Inc, Hitachi Zosen Corporation, CORMETECH, BASF SE, Cataler Corporation, Johnson Matthey, IBIDEN Porzellanfabrik Frauenthal, Corning Incorporated.
3. What are the main segments of the Automotive Selective Catalytic Reduction Market?
The market segments include Catalyst Type, Process Type, Application.
4. Can you provide details about the market size?
The market size is estimated to be USD 13.22 billion as of 2022.
5. What are some drivers contributing to market growth?
Increasing Demand due to Stringent Emission Standards of Developed Countries; Increasing Thermal Power Production Capacity in China and India.
6. What are the notable trends driving market growth?
Power Industry to Dominate the Market.
7. Are there any restraints impacting market growth?
Decline in Coal Based Thermal Power Generation in Western European Countries.
8. Can you provide examples of recent developments in the market?
N/A
9. What pricing options are available for accessing the report?
Pricing options include single-user, multi-user, and enterprise licenses priced at USD 4750, USD 5250, and USD 8750 respectively.
10. Is the market size provided in terms of value or volume?
The market size is provided in terms of value, measured in billion.
11. Are there any specific market keywords associated with the report?
Yes, the market keyword associated with the report is "Automotive Selective Catalytic Reduction Market," which aids in identifying and referencing the specific market segment covered.
12. How do I determine which pricing option suits my needs best?
The pricing options vary based on user requirements and access needs. Individual users may opt for single-user licenses, while businesses requiring broader access may choose multi-user or enterprise licenses for cost-effective access to the report.
13. Are there any additional resources or data provided in the Automotive Selective Catalytic Reduction Market report?
While the report offers comprehensive insights, it's advisable to review the specific contents or supplementary materials provided to ascertain if additional resources or data are available.
14. How can I stay updated on further developments or reports in the Automotive Selective Catalytic Reduction Market?
To stay informed about further developments, trends, and reports in the Automotive Selective Catalytic Reduction Market, consider subscribing to industry newsletters, following relevant companies and organizations, or regularly checking reputable industry news sources and publications.
Methodology
Step 1 - Identification of Relevant Samples Size from Population Database


Step 2 - Approaches for Defining Global Market Size (Value, Volume* & Price*)

Note*: In applicable scenarios
Step 3 - Data Sources
Primary Research
- Web Analytics
- Survey Reports
- Research Institute
- Latest Research Reports
- Opinion Leaders
Secondary Research
- Annual Reports
- White Paper
- Latest Press Release
- Industry Association
- Paid Database
- Investor Presentations

Step 4 - Data Triangulation
Involves using different sources of information in order to increase the validity of a study
These sources are likely to be stakeholders in a program - participants, other researchers, program staff, other community members, and so on.
Then we put all data in single framework & apply various statistical tools to find out the dynamic on the market.
During the analysis stage, feedback from the stakeholder groups would be compared to determine areas of agreement as well as areas of divergence