Autonomous Systems Industry to Grow at XX CAGR: Market Size Analysis and Forecasts 2025-2033

Autonomous Systems Industry by Production Analysis, by Consumption Analysis, by Import Market Analysis (Value & Volume), by Export Market Analysis (Value & Volume), by Price Trend Analysis, by North America (United States, Canada, Mexico), by South America (Brazil, Argentina, Rest of South America), by Europe (United Kingdom, Germany, France, Italy, Spain, Russia, Benelux, Nordics, Rest of Europe), by Middle East & Africa (Turkey, Israel, GCC, North Africa, South Africa, Rest of Middle East & Africa), by Asia Pacific (China, India, Japan, South Korea, ASEAN, Oceania, Rest of Asia Pacific) Forecast 2025-2033

Jul 1 2025
Base Year: 2024

234 Pages
Main Logo

Autonomous Systems Industry to Grow at XX CAGR: Market Size Analysis and Forecasts 2025-2033


Home
Industries
Unmanned Systems

Tailored for you

  • In-depth Analysis Tailored to Specified Regions or Segments
  • Company Profiles Customized to User Preferences
  • Comprehensive Insights Focused on Specific Segments or Regions
  • Customized Evaluation of Competitive Landscape to Meet Your Needs
  • Tailored Customization to Address Other Specific Requirements
Ask for customization


Key Insights

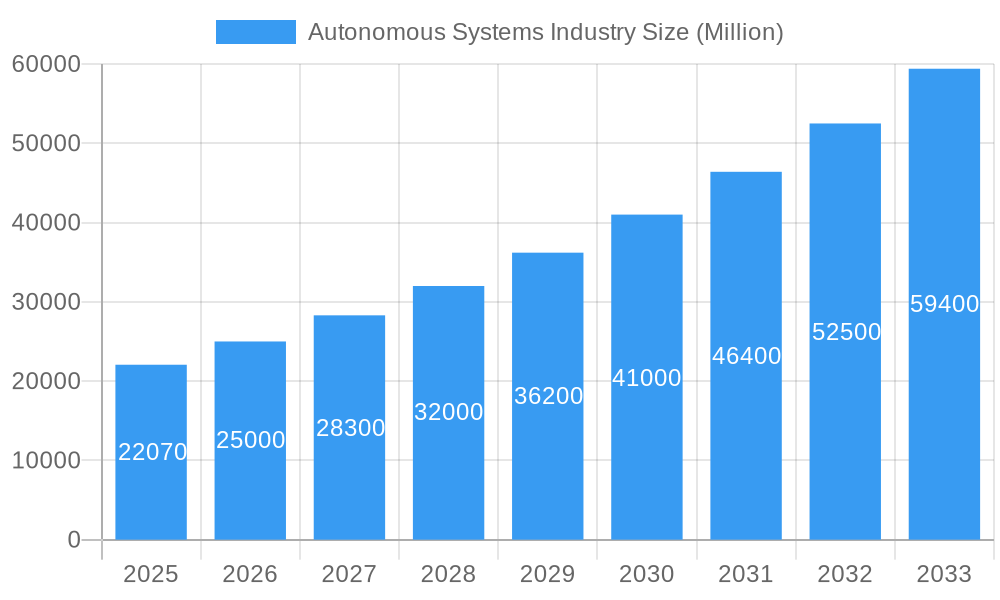
The Autonomous Systems industry, encompassing unmanned aerial, ground, and sea systems, is experiencing robust growth, projected to reach a market size of $22.07 billion in 2025 and exhibiting a Compound Annual Growth Rate (CAGR) of 13.33%. This expansion is fueled by several key drivers. Firstly, increasing demand from military and law enforcement agencies for enhanced surveillance, reconnaissance, and targeted operations is significantly boosting adoption. Secondly, the commercial sector is witnessing rising applications across logistics, infrastructure inspection, agriculture, and environmental monitoring, leading to substantial market penetration. Technological advancements, including improved sensor technology, artificial intelligence, and enhanced autonomy features, are further propelling market growth. While data privacy and security concerns remain a restraint, coupled with regulatory hurdles in certain regions, the overall market trajectory remains positive. The market segmentation reveals strong growth across all segments, with unmanned aerial vehicles (UAVs), particularly large UAVs, currently holding a significant share, driven by their versatility and applicability across various sectors. The North American market, particularly the United States, is currently leading, followed by Europe and the Asia-Pacific region, with China and India showcasing significant potential for future growth. The forecast period of 2025-2033 anticipates continued expansion, driven by consistent technological innovation and increasing adoption across diverse industries.
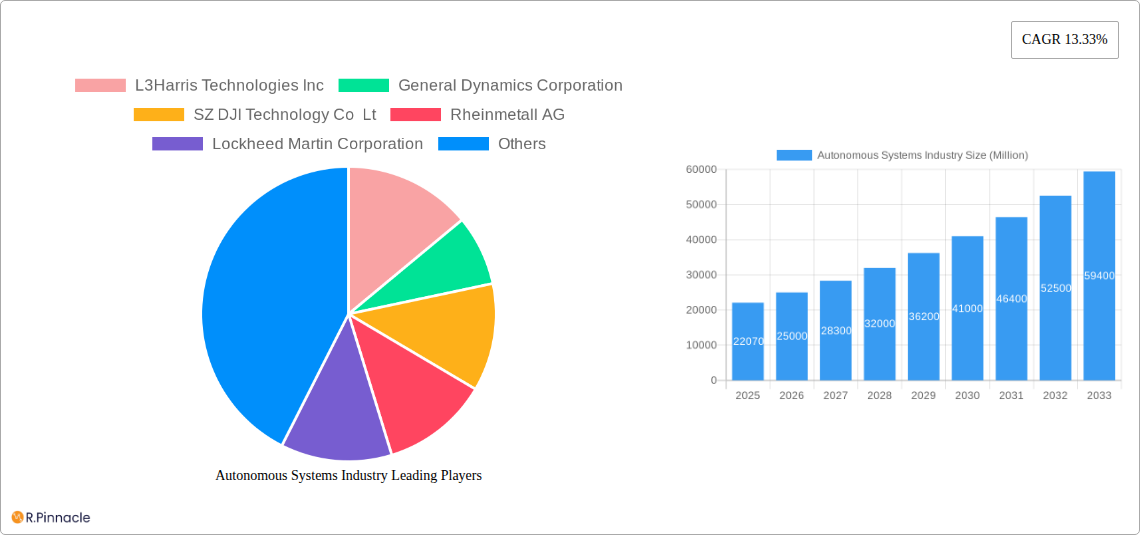
The competitive landscape is characterized by a mix of established defense contractors like Lockheed Martin, Boeing, and General Dynamics, alongside specialized technology companies such as DJI and smaller, innovative players. Strategic partnerships and mergers and acquisitions are anticipated to shape the market dynamics in the coming years, leading to consolidation among key players and the emergence of new technologies. The geographical distribution of market share is expected to evolve, with the Asia-Pacific region potentially closing the gap with North America in the long term, driven by substantial investments in infrastructure and technological advancements. Continued focus on enhancing autonomy, reducing operational costs, and improving reliability will be critical for companies to maintain a competitive edge in this rapidly evolving landscape. The consistent demand for autonomous solutions across various sectors and ongoing technological advancements will solidify the autonomous systems industry's position as a key driver of innovation across numerous sectors in the coming decade.

Autonomous Systems Industry Research Report - Market Size, Growth & Forecast

Autonomous Systems Industry: A Comprehensive Market Report (2019-2033)

This in-depth report provides a comprehensive analysis of the Autonomous Systems industry, offering crucial insights for industry professionals, investors, and strategists. The study period spans from 2019 to 2033, with 2025 serving as both the base and estimated year. The forecast period covers 2025-2033, while the historical period encompasses 2019-2024. The report projects a market valued at xx Million by 2033, showcasing significant growth potential.

Autonomous Systems Industry Market Structure & Innovation Trends

This section analyzes the competitive landscape, innovation drivers, and regulatory environment within the Autonomous Systems market. We delve into market concentration, revealing the market share held by key players like L3Harris Technologies Inc, General Dynamics Corporation, and others. The report examines the influence of mergers and acquisitions (M&A) activities, detailing deal values exceeding xx Million in recent years. Innovation drivers, such as advancements in AI, sensor technology, and communication networks, are assessed alongside their impact on market growth. The report also explores the evolving regulatory frameworks shaping the industry and the presence of substitute products. Finally, the analysis covers end-user demographics and their influence on market demand, providing a holistic view of the industry's structural dynamics.

  • Market Concentration: The market is moderately concentrated, with the top 5 players holding approximately xx% market share in 2025.
  • M&A Activity: The historical period (2019-2024) witnessed M&A activity totaling approximately xx Million, indicating strong consolidation trends.
  • Innovation Drivers: Advancements in AI, sensor technologies, and miniaturization are key innovation drivers.
  • Regulatory Landscape: Varying regulations across different geographies pose both challenges and opportunities.
Autonomous Systems Industry Growth

Autonomous Systems Industry Market Dynamics & Trends

This section explores the dynamic forces shaping the Autonomous Systems market. We analyze market growth drivers, including increasing demand across various sectors (military, commercial, etc.), technological advancements enabling greater autonomy and efficiency, and evolving consumer preferences for sophisticated and user-friendly autonomous systems. The competitive dynamics are examined, considering factors such as pricing strategies, product differentiation, and technological leadership. The report highlights the significant impact of technological disruptions, such as the rise of AI-powered systems and the integration of 5G networks. The Compound Annual Growth Rate (CAGR) and market penetration rates are provided, offering insights into the growth trajectory and market adoption levels of autonomous systems.

Autonomous Systems Industry Growth

Dominant Regions & Segments in Autonomous Systems Industry

This section identifies the leading regions and segments within the Autonomous Systems market. We examine dominance across various segments, including:

  • Hybrid Unmanned Sea Systems: North America is currently leading, driven by strong military spending and technological advancements. Key drivers include government initiatives supporting technological developments and robust maritime infrastructure.

  • Application: The Military and Law Enforcement segment exhibits the highest growth, driven by the demand for enhanced surveillance, reconnaissance, and operational capabilities. Commercial applications are also rapidly expanding due to increased automation requirements across various sectors (e.g., logistics, agriculture).

  • Type: Unmanned Aerial Vehicles (UAVs) currently hold a significant market share, propelled by their wide-ranging applications, including surveillance, mapping, and delivery. Large UAVs and Unmanned Ground Vehicles (UGVs) are showing significant growth potential, driven by technological improvements and expanding applications.

The dominance analysis includes detailed explorations of the contributing factors in each segment and region, providing insights into the underlying forces driving market growth.

Autonomous Systems Industry Product Innovations

Recent years have witnessed a surge in autonomous systems product innovation, characterized by advancements in AI, improved sensor integration, enhanced battery technologies, and more robust communication systems. This has resulted in smaller, more efficient, and more versatile autonomous systems better suited for diverse applications. These innovations are enhancing the capabilities and market fit of autonomous systems across military, commercial, and consumer markets.

Report Scope & Segmentation Analysis

This report provides a granular segmentation analysis of the autonomous systems market, examining the market size, growth projections, and competitive dynamics within each segment. This includes detailed breakdowns by type (Unmanned Aerial Vehicles, Large UAVs, Unmanned Ground Vehicles), application (Military and Law Enforcement, Commercial), and hybrid systems (Unmanned Sea Systems). Each segment's unique growth drivers and challenges are meticulously explored.

Key Drivers of Autonomous Systems Industry Growth

The autonomous systems market is experiencing robust growth driven by several key factors. Technological advancements, particularly in AI, sensor technology, and communication systems, are enabling more sophisticated and capable autonomous systems. Increased government spending on defense and security, coupled with growing commercial demand for automation in various industries (logistics, agriculture, etc.), are major contributors. Furthermore, supportive regulatory frameworks in some regions are facilitating the adoption and deployment of autonomous systems.

Challenges in the Autonomous Systems Industry Sector

Despite significant growth potential, the autonomous systems industry faces several challenges. Regulatory hurdles vary across different geographies, creating complexities for manufacturers and users. Supply chain disruptions can impact production and delivery timelines, causing delays and increased costs. Intense competition among established players and new entrants creates price pressures and necessitates constant innovation to maintain market share.

Emerging Opportunities in Autonomous Systems Industry

The autonomous systems industry presents numerous emerging opportunities. New markets are opening up in sectors such as healthcare, infrastructure inspection, and environmental monitoring. Technological advancements, such as the development of more advanced AI algorithms and improved sensor technologies, promise greater efficiency and functionality. Changing consumer preferences towards automation and convenience are increasing the demand for autonomous systems across diverse applications.

Leading Players in the Autonomous Systems Industry Market

  • L3Harris Technologies Inc
  • General Dynamics Corporation
  • SZ DJI Technology Co Lt
  • Rheinmetall AG
  • Lockheed Martin Corporation
  • Elbit Systems Ltd
  • ECA Group
  • QinetiQ Group
  • BAE Systems PLC
  • Israel Aerospace Industries Ltd
  • Northrop Grumman Corporation
  • Saab AB
  • The Boeing Company
  • Teledyne FLIR LLC

Key Developments in Autonomous Systems Industry Industry

  • 2023: Company X launched a new autonomous drone with enhanced AI capabilities.
  • 2022: A major merger between Company Y and Company Z reshaped the market landscape.
  • 2021: New regulations in Region A impacted the adoption of autonomous vehicles. (Further details on specific developments with precise dates and impacts will be included in the full report)

Future Outlook for Autonomous Systems Industry Market

The autonomous systems market is poised for continued expansion, driven by technological advancements, increased investment, and growing demand across various sectors. Strategic opportunities exist in the development of next-generation autonomous systems with enhanced intelligence, improved reliability, and greater safety features. The integration of autonomous systems into existing infrastructure and workflows will create new markets and expand the potential applications of this rapidly evolving technology. The report offers insights into the major growth accelerators and strategic recommendations for stakeholders to navigate this dynamic market successfully.

Autonomous Systems Industry Segmentation

  • 1. Production Analysis
  • 2. Consumption Analysis
  • 3. Import Market Analysis (Value & Volume)
  • 4. Export Market Analysis (Value & Volume)
  • 5. Price Trend Analysis

Autonomous Systems Industry Segmentation By Geography

  • 1. North America
    • 1.1. United States
    • 1.2. Canada
    • 1.3. Mexico
  • 2. South America
    • 2.1. Brazil
    • 2.2. Argentina
    • 2.3. Rest of South America
  • 3. Europe
    • 3.1. United Kingdom
    • 3.2. Germany
    • 3.3. France
    • 3.4. Italy
    • 3.5. Spain
    • 3.6. Russia
    • 3.7. Benelux
    • 3.8. Nordics
    • 3.9. Rest of Europe
  • 4. Middle East & Africa
    • 4.1. Turkey
    • 4.2. Israel
    • 4.3. GCC
    • 4.4. North Africa
    • 4.5. South Africa
    • 4.6. Rest of Middle East & Africa
  • 5. Asia Pacific
    • 5.1. China
    • 5.2. India
    • 5.3. Japan
    • 5.4. South Korea
    • 5.5. ASEAN
    • 5.6. Oceania
    • 5.7. Rest of Asia Pacific
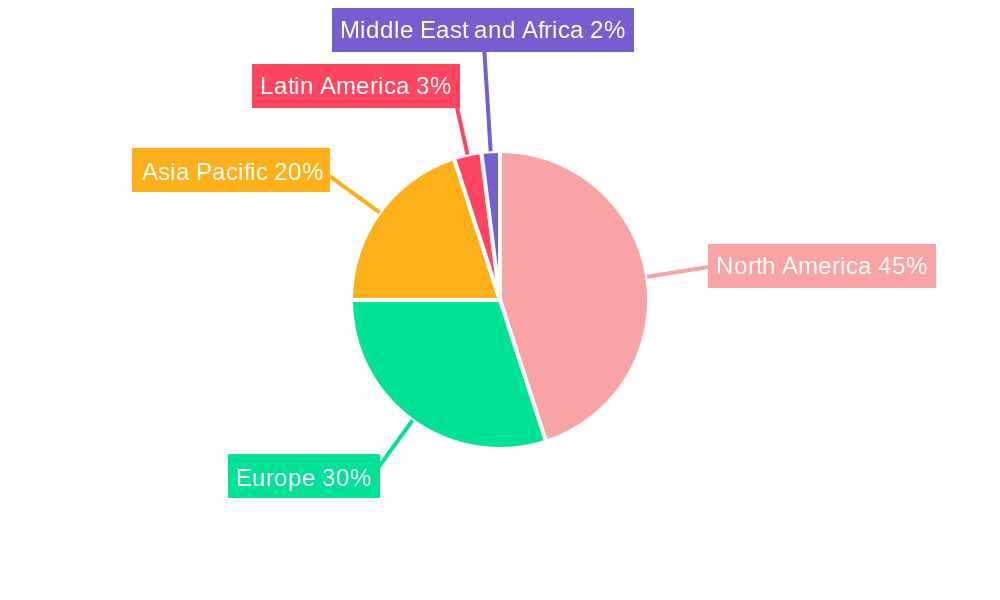
Autonomous Systems Industry Regional Share


Autonomous Systems Industry REPORT HIGHLIGHTS

AspectsDetails
Study Period 2019-2033
Base Year 2024
Estimated Year 2025
Forecast Period2025-2033
Historical Period2019-2024
Growth RateCAGR of 13.33% from 2019-2033
Segmentation
    • By Production Analysis
    • By Consumption Analysis
    • By Import Market Analysis (Value & Volume)
    • By Export Market Analysis (Value & Volume)
    • By Price Trend Analysis
  • By Geography
    • North America
      • United States
      • Canada
      • Mexico
    • South America
      • Brazil
      • Argentina
      • Rest of South America
    • Europe
      • United Kingdom
      • Germany
      • France
      • Italy
      • Spain
      • Russia
      • Benelux
      • Nordics
      • Rest of Europe
    • Middle East & Africa
      • Turkey
      • Israel
      • GCC
      • North Africa
      • South Africa
      • Rest of Middle East & Africa
    • Asia Pacific
      • China
      • India
      • Japan
      • South Korea
      • ASEAN
      • Oceania
      • Rest of Asia Pacific


Table of Contents

  1. 1. Introduction
    • 1.1. Research Scope
    • 1.2. Market Segmentation
    • 1.3. Research Methodology
    • 1.4. Definitions and Assumptions
  2. 2. Executive Summary
    • 2.1. Introduction
  3. 3. Market Dynamics
    • 3.1. Introduction
      • 3.2. Market Drivers
        • 3.2.1. ; Increasing Number Of Air Passengers; Use Of Portable Electronic Devices
      • 3.3. Market Restrains
        • 3.3.1. ; High Cost Of Connectivity Equipments
      • 3.4. Market Trends
        • 3.4.1. The Unmanned Aerial Vehicles Segment to Witness the Highest Growth During the Forecast Period
  4. 4. Market Factor Analysis
    • 4.1. Porters Five Forces
    • 4.2. Supply/Value Chain
    • 4.3. PESTEL analysis
    • 4.4. Market Entropy
    • 4.5. Patent/Trademark Analysis
  5. 5. Global Autonomous Systems Industry Analysis, Insights and Forecast, 2019-2031
    • 5.1. Market Analysis, Insights and Forecast - by Production Analysis
      • 5.2. Market Analysis, Insights and Forecast - by Consumption Analysis
        • 5.3. Market Analysis, Insights and Forecast - by Import Market Analysis (Value & Volume)
          • 5.4. Market Analysis, Insights and Forecast - by Export Market Analysis (Value & Volume)
            • 5.5. Market Analysis, Insights and Forecast - by Price Trend Analysis
              • 5.6. Market Analysis, Insights and Forecast - by Region
                • 5.6.1. North America
                • 5.6.2. South America
                • 5.6.3. Europe
                • 5.6.4. Middle East & Africa
                • 5.6.5. Asia Pacific
            • 6. North America Autonomous Systems Industry Analysis, Insights and Forecast, 2019-2031
              • 6.1. Market Analysis, Insights and Forecast - by Production Analysis
                • 6.2. Market Analysis, Insights and Forecast - by Consumption Analysis
                  • 6.3. Market Analysis, Insights and Forecast - by Import Market Analysis (Value & Volume)
                    • 6.4. Market Analysis, Insights and Forecast - by Export Market Analysis (Value & Volume)
                      • 6.5. Market Analysis, Insights and Forecast - by Price Trend Analysis
                      • 7. South America Autonomous Systems Industry Analysis, Insights and Forecast, 2019-2031
                        • 7.1. Market Analysis, Insights and Forecast - by Production Analysis
                          • 7.2. Market Analysis, Insights and Forecast - by Consumption Analysis
                            • 7.3. Market Analysis, Insights and Forecast - by Import Market Analysis (Value & Volume)
                              • 7.4. Market Analysis, Insights and Forecast - by Export Market Analysis (Value & Volume)
                                • 7.5. Market Analysis, Insights and Forecast - by Price Trend Analysis
                                • 8. Europe Autonomous Systems Industry Analysis, Insights and Forecast, 2019-2031
                                  • 8.1. Market Analysis, Insights and Forecast - by Production Analysis
                                    • 8.2. Market Analysis, Insights and Forecast - by Consumption Analysis
                                      • 8.3. Market Analysis, Insights and Forecast - by Import Market Analysis (Value & Volume)
                                        • 8.4. Market Analysis, Insights and Forecast - by Export Market Analysis (Value & Volume)
                                          • 8.5. Market Analysis, Insights and Forecast - by Price Trend Analysis
                                          • 9. Middle East & Africa Autonomous Systems Industry Analysis, Insights and Forecast, 2019-2031
                                            • 9.1. Market Analysis, Insights and Forecast - by Production Analysis
                                              • 9.2. Market Analysis, Insights and Forecast - by Consumption Analysis
                                                • 9.3. Market Analysis, Insights and Forecast - by Import Market Analysis (Value & Volume)
                                                  • 9.4. Market Analysis, Insights and Forecast - by Export Market Analysis (Value & Volume)
                                                    • 9.5. Market Analysis, Insights and Forecast - by Price Trend Analysis
                                                    • 10. Asia Pacific Autonomous Systems Industry Analysis, Insights and Forecast, 2019-2031
                                                      • 10.1. Market Analysis, Insights and Forecast - by Production Analysis
                                                        • 10.2. Market Analysis, Insights and Forecast - by Consumption Analysis
                                                          • 10.3. Market Analysis, Insights and Forecast - by Import Market Analysis (Value & Volume)
                                                            • 10.4. Market Analysis, Insights and Forecast - by Export Market Analysis (Value & Volume)
                                                              • 10.5. Market Analysis, Insights and Forecast - by Price Trend Analysis
                                                              • 11. North America Autonomous Systems Industry Analysis, Insights and Forecast, 2019-2031
                                                                  • 11.1. Market Analysis, Insights and Forecast - By Country/Sub-region
                                                                    • 11.1.1 United States
                                                                    • 11.1.2 Canada
                                                              • 12. Europe Autonomous Systems Industry Analysis, Insights and Forecast, 2019-2031
                                                                  • 12.1. Market Analysis, Insights and Forecast - By Country/Sub-region
                                                                    • 12.1.1 Germany
                                                                    • 12.1.2 United Kingdom
                                                                    • 12.1.3 France
                                                                    • 12.1.4 Russia
                                                                    • 12.1.5 Rest of Europe
                                                              • 13. Asia Pacific Autonomous Systems Industry Analysis, Insights and Forecast, 2019-2031
                                                                  • 13.1. Market Analysis, Insights and Forecast - By Country/Sub-region
                                                                    • 13.1.1 China
                                                                    • 13.1.2 India
                                                                    • 13.1.3 South Korea
                                                                    • 13.1.4 Japan
                                                                    • 13.1.5 Rest of Asia Pacific
                                                              • 14. Latin America Autonomous Systems Industry Analysis, Insights and Forecast, 2019-2031
                                                                  • 14.1. Market Analysis, Insights and Forecast - By Country/Sub-region
                                                                    • 14.1.1 Brazil
                                                                    • 14.1.2 Rest of Latin America
                                                              • 15. Middle East and Africa Autonomous Systems Industry Analysis, Insights and Forecast, 2019-2031
                                                                  • 15.1. Market Analysis, Insights and Forecast - By Country/Sub-region
                                                                    • 15.1.1 United Arab Emirates
                                                                    • 15.1.2 Saudi Arabia
                                                                    • 15.1.3 Rest of Middle East and Africa
                                                              • 16. Competitive Analysis
                                                                • 16.1. Global Market Share Analysis 2024
                                                                  • 16.2. Company Profiles
                                                                    • 16.2.1 L3Harris Technologies Inc
                                                                      • 16.2.1.1. Overview
                                                                      • 16.2.1.2. Products
                                                                      • 16.2.1.3. SWOT Analysis
                                                                      • 16.2.1.4. Recent Developments
                                                                      • 16.2.1.5. Financials (Based on Availability)
                                                                    • 16.2.2 General Dynamics Corporation
                                                                      • 16.2.2.1. Overview
                                                                      • 16.2.2.2. Products
                                                                      • 16.2.2.3. SWOT Analysis
                                                                      • 16.2.2.4. Recent Developments
                                                                      • 16.2.2.5. Financials (Based on Availability)
                                                                    • 16.2.3 SZ DJI Technology Co Lt
                                                                      • 16.2.3.1. Overview
                                                                      • 16.2.3.2. Products
                                                                      • 16.2.3.3. SWOT Analysis
                                                                      • 16.2.3.4. Recent Developments
                                                                      • 16.2.3.5. Financials (Based on Availability)
                                                                    • 16.2.4 Rheinmetall AG
                                                                      • 16.2.4.1. Overview
                                                                      • 16.2.4.2. Products
                                                                      • 16.2.4.3. SWOT Analysis
                                                                      • 16.2.4.4. Recent Developments
                                                                      • 16.2.4.5. Financials (Based on Availability)
                                                                    • 16.2.5 Lockheed Martin Corporation
                                                                      • 16.2.5.1. Overview
                                                                      • 16.2.5.2. Products
                                                                      • 16.2.5.3. SWOT Analysis
                                                                      • 16.2.5.4. Recent Developments
                                                                      • 16.2.5.5. Financials (Based on Availability)
                                                                    • 16.2.6 Elbit Systems Ltd
                                                                      • 16.2.6.1. Overview
                                                                      • 16.2.6.2. Products
                                                                      • 16.2.6.3. SWOT Analysis
                                                                      • 16.2.6.4. Recent Developments
                                                                      • 16.2.6.5. Financials (Based on Availability)
                                                                    • 16.2.7 ECA Group
                                                                      • 16.2.7.1. Overview
                                                                      • 16.2.7.2. Products
                                                                      • 16.2.7.3. SWOT Analysis
                                                                      • 16.2.7.4. Recent Developments
                                                                      • 16.2.7.5. Financials (Based on Availability)
                                                                    • 16.2.8 QinetiQ Group
                                                                      • 16.2.8.1. Overview
                                                                      • 16.2.8.2. Products
                                                                      • 16.2.8.3. SWOT Analysis
                                                                      • 16.2.8.4. Recent Developments
                                                                      • 16.2.8.5. Financials (Based on Availability)
                                                                    • 16.2.9 BAE Systems PLC
                                                                      • 16.2.9.1. Overview
                                                                      • 16.2.9.2. Products
                                                                      • 16.2.9.3. SWOT Analysis
                                                                      • 16.2.9.4. Recent Developments
                                                                      • 16.2.9.5. Financials (Based on Availability)
                                                                    • 16.2.10 Israel Aerospace Industries Ltd
                                                                      • 16.2.10.1. Overview
                                                                      • 16.2.10.2. Products
                                                                      • 16.2.10.3. SWOT Analysis
                                                                      • 16.2.10.4. Recent Developments
                                                                      • 16.2.10.5. Financials (Based on Availability)
                                                                    • 16.2.11 Northrop Grumman Corporation
                                                                      • 16.2.11.1. Overview
                                                                      • 16.2.11.2. Products
                                                                      • 16.2.11.3. SWOT Analysis
                                                                      • 16.2.11.4. Recent Developments
                                                                      • 16.2.11.5. Financials (Based on Availability)
                                                                    • 16.2.12 Saab AB
                                                                      • 16.2.12.1. Overview
                                                                      • 16.2.12.2. Products
                                                                      • 16.2.12.3. SWOT Analysis
                                                                      • 16.2.12.4. Recent Developments
                                                                      • 16.2.12.5. Financials (Based on Availability)
                                                                    • 16.2.13 The Boeing Company
                                                                      • 16.2.13.1. Overview
                                                                      • 16.2.13.2. Products
                                                                      • 16.2.13.3. SWOT Analysis
                                                                      • 16.2.13.4. Recent Developments
                                                                      • 16.2.13.5. Financials (Based on Availability)
                                                                    • 16.2.14 Teledyne FLIR LLC
                                                                      • 16.2.14.1. Overview
                                                                      • 16.2.14.2. Products
                                                                      • 16.2.14.3. SWOT Analysis
                                                                      • 16.2.14.4. Recent Developments
                                                                      • 16.2.14.5. Financials (Based on Availability)

                                                              List of Figures

                                                              1. Figure 1: Global Autonomous Systems Industry Revenue Breakdown (Million, %) by Region 2024 & 2032
                                                              2. Figure 2: North America Autonomous Systems Industry Revenue (Million), by Country 2024 & 2032
                                                              3. Figure 3: North America Autonomous Systems Industry Revenue Share (%), by Country 2024 & 2032
                                                              4. Figure 4: Europe Autonomous Systems Industry Revenue (Million), by Country 2024 & 2032
                                                              5. Figure 5: Europe Autonomous Systems Industry Revenue Share (%), by Country 2024 & 2032
                                                              6. Figure 6: Asia Pacific Autonomous Systems Industry Revenue (Million), by Country 2024 & 2032
                                                              7. Figure 7: Asia Pacific Autonomous Systems Industry Revenue Share (%), by Country 2024 & 2032
                                                              8. Figure 8: Latin America Autonomous Systems Industry Revenue (Million), by Country 2024 & 2032
                                                              9. Figure 9: Latin America Autonomous Systems Industry Revenue Share (%), by Country 2024 & 2032
                                                              10. Figure 10: Middle East and Africa Autonomous Systems Industry Revenue (Million), by Country 2024 & 2032
                                                              11. Figure 11: Middle East and Africa Autonomous Systems Industry Revenue Share (%), by Country 2024 & 2032
                                                              12. Figure 12: North America Autonomous Systems Industry Revenue (Million), by Production Analysis 2024 & 2032
                                                              13. Figure 13: North America Autonomous Systems Industry Revenue Share (%), by Production Analysis 2024 & 2032
                                                              14. Figure 14: North America Autonomous Systems Industry Revenue (Million), by Consumption Analysis 2024 & 2032
                                                              15. Figure 15: North America Autonomous Systems Industry Revenue Share (%), by Consumption Analysis 2024 & 2032
                                                              16. Figure 16: North America Autonomous Systems Industry Revenue (Million), by Import Market Analysis (Value & Volume) 2024 & 2032
                                                              17. Figure 17: North America Autonomous Systems Industry Revenue Share (%), by Import Market Analysis (Value & Volume) 2024 & 2032
                                                              18. Figure 18: North America Autonomous Systems Industry Revenue (Million), by Export Market Analysis (Value & Volume) 2024 & 2032
                                                              19. Figure 19: North America Autonomous Systems Industry Revenue Share (%), by Export Market Analysis (Value & Volume) 2024 & 2032
                                                              20. Figure 20: North America Autonomous Systems Industry Revenue (Million), by Price Trend Analysis 2024 & 2032
                                                              21. Figure 21: North America Autonomous Systems Industry Revenue Share (%), by Price Trend Analysis 2024 & 2032
                                                              22. Figure 22: North America Autonomous Systems Industry Revenue (Million), by Country 2024 & 2032
                                                              23. Figure 23: North America Autonomous Systems Industry Revenue Share (%), by Country 2024 & 2032
                                                              24. Figure 24: South America Autonomous Systems Industry Revenue (Million), by Production Analysis 2024 & 2032
                                                              25. Figure 25: South America Autonomous Systems Industry Revenue Share (%), by Production Analysis 2024 & 2032
                                                              26. Figure 26: South America Autonomous Systems Industry Revenue (Million), by Consumption Analysis 2024 & 2032
                                                              27. Figure 27: South America Autonomous Systems Industry Revenue Share (%), by Consumption Analysis 2024 & 2032
                                                              28. Figure 28: South America Autonomous Systems Industry Revenue (Million), by Import Market Analysis (Value & Volume) 2024 & 2032
                                                              29. Figure 29: South America Autonomous Systems Industry Revenue Share (%), by Import Market Analysis (Value & Volume) 2024 & 2032
                                                              30. Figure 30: South America Autonomous Systems Industry Revenue (Million), by Export Market Analysis (Value & Volume) 2024 & 2032
                                                              31. Figure 31: South America Autonomous Systems Industry Revenue Share (%), by Export Market Analysis (Value & Volume) 2024 & 2032
                                                              32. Figure 32: South America Autonomous Systems Industry Revenue (Million), by Price Trend Analysis 2024 & 2032
                                                              33. Figure 33: South America Autonomous Systems Industry Revenue Share (%), by Price Trend Analysis 2024 & 2032
                                                              34. Figure 34: South America Autonomous Systems Industry Revenue (Million), by Country 2024 & 2032
                                                              35. Figure 35: South America Autonomous Systems Industry Revenue Share (%), by Country 2024 & 2032
                                                              36. Figure 36: Europe Autonomous Systems Industry Revenue (Million), by Production Analysis 2024 & 2032
                                                              37. Figure 37: Europe Autonomous Systems Industry Revenue Share (%), by Production Analysis 2024 & 2032
                                                              38. Figure 38: Europe Autonomous Systems Industry Revenue (Million), by Consumption Analysis 2024 & 2032
                                                              39. Figure 39: Europe Autonomous Systems Industry Revenue Share (%), by Consumption Analysis 2024 & 2032
                                                              40. Figure 40: Europe Autonomous Systems Industry Revenue (Million), by Import Market Analysis (Value & Volume) 2024 & 2032
                                                              41. Figure 41: Europe Autonomous Systems Industry Revenue Share (%), by Import Market Analysis (Value & Volume) 2024 & 2032
                                                              42. Figure 42: Europe Autonomous Systems Industry Revenue (Million), by Export Market Analysis (Value & Volume) 2024 & 2032
                                                              43. Figure 43: Europe Autonomous Systems Industry Revenue Share (%), by Export Market Analysis (Value & Volume) 2024 & 2032
                                                              44. Figure 44: Europe Autonomous Systems Industry Revenue (Million), by Price Trend Analysis 2024 & 2032
                                                              45. Figure 45: Europe Autonomous Systems Industry Revenue Share (%), by Price Trend Analysis 2024 & 2032
                                                              46. Figure 46: Europe Autonomous Systems Industry Revenue (Million), by Country 2024 & 2032
                                                              47. Figure 47: Europe Autonomous Systems Industry Revenue Share (%), by Country 2024 & 2032
                                                              48. Figure 48: Middle East & Africa Autonomous Systems Industry Revenue (Million), by Production Analysis 2024 & 2032
                                                              49. Figure 49: Middle East & Africa Autonomous Systems Industry Revenue Share (%), by Production Analysis 2024 & 2032
                                                              50. Figure 50: Middle East & Africa Autonomous Systems Industry Revenue (Million), by Consumption Analysis 2024 & 2032
                                                              51. Figure 51: Middle East & Africa Autonomous Systems Industry Revenue Share (%), by Consumption Analysis 2024 & 2032
                                                              52. Figure 52: Middle East & Africa Autonomous Systems Industry Revenue (Million), by Import Market Analysis (Value & Volume) 2024 & 2032
                                                              53. Figure 53: Middle East & Africa Autonomous Systems Industry Revenue Share (%), by Import Market Analysis (Value & Volume) 2024 & 2032
                                                              54. Figure 54: Middle East & Africa Autonomous Systems Industry Revenue (Million), by Export Market Analysis (Value & Volume) 2024 & 2032
                                                              55. Figure 55: Middle East & Africa Autonomous Systems Industry Revenue Share (%), by Export Market Analysis (Value & Volume) 2024 & 2032
                                                              56. Figure 56: Middle East & Africa Autonomous Systems Industry Revenue (Million), by Price Trend Analysis 2024 & 2032
                                                              57. Figure 57: Middle East & Africa Autonomous Systems Industry Revenue Share (%), by Price Trend Analysis 2024 & 2032
                                                              58. Figure 58: Middle East & Africa Autonomous Systems Industry Revenue (Million), by Country 2024 & 2032
                                                              59. Figure 59: Middle East & Africa Autonomous Systems Industry Revenue Share (%), by Country 2024 & 2032
                                                              60. Figure 60: Asia Pacific Autonomous Systems Industry Revenue (Million), by Production Analysis 2024 & 2032
                                                              61. Figure 61: Asia Pacific Autonomous Systems Industry Revenue Share (%), by Production Analysis 2024 & 2032
                                                              62. Figure 62: Asia Pacific Autonomous Systems Industry Revenue (Million), by Consumption Analysis 2024 & 2032
                                                              63. Figure 63: Asia Pacific Autonomous Systems Industry Revenue Share (%), by Consumption Analysis 2024 & 2032
                                                              64. Figure 64: Asia Pacific Autonomous Systems Industry Revenue (Million), by Import Market Analysis (Value & Volume) 2024 & 2032
                                                              65. Figure 65: Asia Pacific Autonomous Systems Industry Revenue Share (%), by Import Market Analysis (Value & Volume) 2024 & 2032
                                                              66. Figure 66: Asia Pacific Autonomous Systems Industry Revenue (Million), by Export Market Analysis (Value & Volume) 2024 & 2032
                                                              67. Figure 67: Asia Pacific Autonomous Systems Industry Revenue Share (%), by Export Market Analysis (Value & Volume) 2024 & 2032
                                                              68. Figure 68: Asia Pacific Autonomous Systems Industry Revenue (Million), by Price Trend Analysis 2024 & 2032
                                                              69. Figure 69: Asia Pacific Autonomous Systems Industry Revenue Share (%), by Price Trend Analysis 2024 & 2032
                                                              70. Figure 70: Asia Pacific Autonomous Systems Industry Revenue (Million), by Country 2024 & 2032
                                                              71. Figure 71: Asia Pacific Autonomous Systems Industry Revenue Share (%), by Country 2024 & 2032

                                                              List of Tables

                                                              1. Table 1: Global Autonomous Systems Industry Revenue Million Forecast, by Region 2019 & 2032
                                                              2. Table 2: Global Autonomous Systems Industry Revenue Million Forecast, by Production Analysis 2019 & 2032
                                                              3. Table 3: Global Autonomous Systems Industry Revenue Million Forecast, by Consumption Analysis 2019 & 2032
                                                              4. Table 4: Global Autonomous Systems Industry Revenue Million Forecast, by Import Market Analysis (Value & Volume) 2019 & 2032
                                                              5. Table 5: Global Autonomous Systems Industry Revenue Million Forecast, by Export Market Analysis (Value & Volume) 2019 & 2032
                                                              6. Table 6: Global Autonomous Systems Industry Revenue Million Forecast, by Price Trend Analysis 2019 & 2032
                                                              7. Table 7: Global Autonomous Systems Industry Revenue Million Forecast, by Region 2019 & 2032
                                                              8. Table 8: Global Autonomous Systems Industry Revenue Million Forecast, by Country 2019 & 2032
                                                              9. Table 9: United States Autonomous Systems Industry Revenue (Million) Forecast, by Application 2019 & 2032
                                                              10. Table 10: Canada Autonomous Systems Industry Revenue (Million) Forecast, by Application 2019 & 2032
                                                              11. Table 11: Global Autonomous Systems Industry Revenue Million Forecast, by Country 2019 & 2032
                                                              12. Table 12: Germany Autonomous Systems Industry Revenue (Million) Forecast, by Application 2019 & 2032
                                                              13. Table 13: United Kingdom Autonomous Systems Industry Revenue (Million) Forecast, by Application 2019 & 2032
                                                              14. Table 14: France Autonomous Systems Industry Revenue (Million) Forecast, by Application 2019 & 2032
                                                              15. Table 15: Russia Autonomous Systems Industry Revenue (Million) Forecast, by Application 2019 & 2032
                                                              16. Table 16: Rest of Europe Autonomous Systems Industry Revenue (Million) Forecast, by Application 2019 & 2032
                                                              17. Table 17: Global Autonomous Systems Industry Revenue Million Forecast, by Country 2019 & 2032
                                                              18. Table 18: China Autonomous Systems Industry Revenue (Million) Forecast, by Application 2019 & 2032
                                                              19. Table 19: India Autonomous Systems Industry Revenue (Million) Forecast, by Application 2019 & 2032
                                                              20. Table 20: South Korea Autonomous Systems Industry Revenue (Million) Forecast, by Application 2019 & 2032
                                                              21. Table 21: Japan Autonomous Systems Industry Revenue (Million) Forecast, by Application 2019 & 2032
                                                              22. Table 22: Rest of Asia Pacific Autonomous Systems Industry Revenue (Million) Forecast, by Application 2019 & 2032
                                                              23. Table 23: Global Autonomous Systems Industry Revenue Million Forecast, by Country 2019 & 2032
                                                              24. Table 24: Brazil Autonomous Systems Industry Revenue (Million) Forecast, by Application 2019 & 2032
                                                              25. Table 25: Rest of Latin America Autonomous Systems Industry Revenue (Million) Forecast, by Application 2019 & 2032
                                                              26. Table 26: Global Autonomous Systems Industry Revenue Million Forecast, by Country 2019 & 2032
                                                              27. Table 27: United Arab Emirates Autonomous Systems Industry Revenue (Million) Forecast, by Application 2019 & 2032
                                                              28. Table 28: Saudi Arabia Autonomous Systems Industry Revenue (Million) Forecast, by Application 2019 & 2032
                                                              29. Table 29: Rest of Middle East and Africa Autonomous Systems Industry Revenue (Million) Forecast, by Application 2019 & 2032
                                                              30. Table 30: Global Autonomous Systems Industry Revenue Million Forecast, by Production Analysis 2019 & 2032
                                                              31. Table 31: Global Autonomous Systems Industry Revenue Million Forecast, by Consumption Analysis 2019 & 2032
                                                              32. Table 32: Global Autonomous Systems Industry Revenue Million Forecast, by Import Market Analysis (Value & Volume) 2019 & 2032
                                                              33. Table 33: Global Autonomous Systems Industry Revenue Million Forecast, by Export Market Analysis (Value & Volume) 2019 & 2032
                                                              34. Table 34: Global Autonomous Systems Industry Revenue Million Forecast, by Price Trend Analysis 2019 & 2032
                                                              35. Table 35: Global Autonomous Systems Industry Revenue Million Forecast, by Country 2019 & 2032
                                                              36. Table 36: United States Autonomous Systems Industry Revenue (Million) Forecast, by Application 2019 & 2032
                                                              37. Table 37: Canada Autonomous Systems Industry Revenue (Million) Forecast, by Application 2019 & 2032
                                                              38. Table 38: Mexico Autonomous Systems Industry Revenue (Million) Forecast, by Application 2019 & 2032
                                                              39. Table 39: Global Autonomous Systems Industry Revenue Million Forecast, by Production Analysis 2019 & 2032
                                                              40. Table 40: Global Autonomous Systems Industry Revenue Million Forecast, by Consumption Analysis 2019 & 2032
                                                              41. Table 41: Global Autonomous Systems Industry Revenue Million Forecast, by Import Market Analysis (Value & Volume) 2019 & 2032
                                                              42. Table 42: Global Autonomous Systems Industry Revenue Million Forecast, by Export Market Analysis (Value & Volume) 2019 & 2032
                                                              43. Table 43: Global Autonomous Systems Industry Revenue Million Forecast, by Price Trend Analysis 2019 & 2032
                                                              44. Table 44: Global Autonomous Systems Industry Revenue Million Forecast, by Country 2019 & 2032
                                                              45. Table 45: Brazil Autonomous Systems Industry Revenue (Million) Forecast, by Application 2019 & 2032
                                                              46. Table 46: Argentina Autonomous Systems Industry Revenue (Million) Forecast, by Application 2019 & 2032
                                                              47. Table 47: Rest of South America Autonomous Systems Industry Revenue (Million) Forecast, by Application 2019 & 2032
                                                              48. Table 48: Global Autonomous Systems Industry Revenue Million Forecast, by Production Analysis 2019 & 2032
                                                              49. Table 49: Global Autonomous Systems Industry Revenue Million Forecast, by Consumption Analysis 2019 & 2032
                                                              50. Table 50: Global Autonomous Systems Industry Revenue Million Forecast, by Import Market Analysis (Value & Volume) 2019 & 2032
                                                              51. Table 51: Global Autonomous Systems Industry Revenue Million Forecast, by Export Market Analysis (Value & Volume) 2019 & 2032
                                                              52. Table 52: Global Autonomous Systems Industry Revenue Million Forecast, by Price Trend Analysis 2019 & 2032
                                                              53. Table 53: Global Autonomous Systems Industry Revenue Million Forecast, by Country 2019 & 2032
                                                              54. Table 54: United Kingdom Autonomous Systems Industry Revenue (Million) Forecast, by Application 2019 & 2032
                                                              55. Table 55: Germany Autonomous Systems Industry Revenue (Million) Forecast, by Application 2019 & 2032
                                                              56. Table 56: France Autonomous Systems Industry Revenue (Million) Forecast, by Application 2019 & 2032
                                                              57. Table 57: Italy Autonomous Systems Industry Revenue (Million) Forecast, by Application 2019 & 2032
                                                              58. Table 58: Spain Autonomous Systems Industry Revenue (Million) Forecast, by Application 2019 & 2032
                                                              59. Table 59: Russia Autonomous Systems Industry Revenue (Million) Forecast, by Application 2019 & 2032
                                                              60. Table 60: Benelux Autonomous Systems Industry Revenue (Million) Forecast, by Application 2019 & 2032
                                                              61. Table 61: Nordics Autonomous Systems Industry Revenue (Million) Forecast, by Application 2019 & 2032
                                                              62. Table 62: Rest of Europe Autonomous Systems Industry Revenue (Million) Forecast, by Application 2019 & 2032
                                                              63. Table 63: Global Autonomous Systems Industry Revenue Million Forecast, by Production Analysis 2019 & 2032
                                                              64. Table 64: Global Autonomous Systems Industry Revenue Million Forecast, by Consumption Analysis 2019 & 2032
                                                              65. Table 65: Global Autonomous Systems Industry Revenue Million Forecast, by Import Market Analysis (Value & Volume) 2019 & 2032
                                                              66. Table 66: Global Autonomous Systems Industry Revenue Million Forecast, by Export Market Analysis (Value & Volume) 2019 & 2032
                                                              67. Table 67: Global Autonomous Systems Industry Revenue Million Forecast, by Price Trend Analysis 2019 & 2032
                                                              68. Table 68: Global Autonomous Systems Industry Revenue Million Forecast, by Country 2019 & 2032
                                                              69. Table 69: Turkey Autonomous Systems Industry Revenue (Million) Forecast, by Application 2019 & 2032
                                                              70. Table 70: Israel Autonomous Systems Industry Revenue (Million) Forecast, by Application 2019 & 2032
                                                              71. Table 71: GCC Autonomous Systems Industry Revenue (Million) Forecast, by Application 2019 & 2032
                                                              72. Table 72: North Africa Autonomous Systems Industry Revenue (Million) Forecast, by Application 2019 & 2032
                                                              73. Table 73: South Africa Autonomous Systems Industry Revenue (Million) Forecast, by Application 2019 & 2032
                                                              74. Table 74: Rest of Middle East & Africa Autonomous Systems Industry Revenue (Million) Forecast, by Application 2019 & 2032
                                                              75. Table 75: Global Autonomous Systems Industry Revenue Million Forecast, by Production Analysis 2019 & 2032
                                                              76. Table 76: Global Autonomous Systems Industry Revenue Million Forecast, by Consumption Analysis 2019 & 2032
                                                              77. Table 77: Global Autonomous Systems Industry Revenue Million Forecast, by Import Market Analysis (Value & Volume) 2019 & 2032
                                                              78. Table 78: Global Autonomous Systems Industry Revenue Million Forecast, by Export Market Analysis (Value & Volume) 2019 & 2032
                                                              79. Table 79: Global Autonomous Systems Industry Revenue Million Forecast, by Price Trend Analysis 2019 & 2032
                                                              80. Table 80: Global Autonomous Systems Industry Revenue Million Forecast, by Country 2019 & 2032
                                                              81. Table 81: China Autonomous Systems Industry Revenue (Million) Forecast, by Application 2019 & 2032
                                                              82. Table 82: India Autonomous Systems Industry Revenue (Million) Forecast, by Application 2019 & 2032
                                                              83. Table 83: Japan Autonomous Systems Industry Revenue (Million) Forecast, by Application 2019 & 2032
                                                              84. Table 84: South Korea Autonomous Systems Industry Revenue (Million) Forecast, by Application 2019 & 2032
                                                              85. Table 85: ASEAN Autonomous Systems Industry Revenue (Million) Forecast, by Application 2019 & 2032
                                                              86. Table 86: Oceania Autonomous Systems Industry Revenue (Million) Forecast, by Application 2019 & 2032
                                                              87. Table 87: Rest of Asia Pacific Autonomous Systems Industry Revenue (Million) Forecast, by Application 2019 & 2032


                                                              Frequently Asked Questions

                                                              1. What is the projected Compound Annual Growth Rate (CAGR) of the Autonomous Systems Industry?

                                                              The projected CAGR is approximately 13.33%.

                                                              2. Which companies are prominent players in the Autonomous Systems Industry?

                                                              Key companies in the market include L3Harris Technologies Inc, General Dynamics Corporation, SZ DJI Technology Co Lt, Rheinmetall AG, Lockheed Martin Corporation, Elbit Systems Ltd, ECA Group, QinetiQ Group, BAE Systems PLC, Israel Aerospace Industries Ltd, Northrop Grumman Corporation, Saab AB, The Boeing Company, Teledyne FLIR LLC.

                                                              3. What are the main segments of the Autonomous Systems Industry?

                                                              The market segments include Production Analysis, Consumption Analysis, Import Market Analysis (Value & Volume), Export Market Analysis (Value & Volume), Price Trend Analysis.

                                                              4. Can you provide details about the market size?

                                                              The market size is estimated to be USD 22.07 Million as of 2022.

                                                              5. What are some drivers contributing to market growth?

                                                              ; Increasing Number Of Air Passengers; Use Of Portable Electronic Devices.

                                                              6. What are the notable trends driving market growth?

                                                              The Unmanned Aerial Vehicles Segment to Witness the Highest Growth During the Forecast Period.

                                                              7. Are there any restraints impacting market growth?

                                                              ; High Cost Of Connectivity Equipments.

                                                              8. Can you provide examples of recent developments in the market?

                                                              N/A

                                                              9. What pricing options are available for accessing the report?

                                                              Pricing options include single-user, multi-user, and enterprise licenses priced at USD 4750, USD 5250, and USD 8750 respectively.

                                                              10. Is the market size provided in terms of value or volume?

                                                              The market size is provided in terms of value, measured in Million.

                                                              11. Are there any specific market keywords associated with the report?

                                                              Yes, the market keyword associated with the report is "Autonomous Systems Industry," which aids in identifying and referencing the specific market segment covered.

                                                              12. How do I determine which pricing option suits my needs best?

                                                              The pricing options vary based on user requirements and access needs. Individual users may opt for single-user licenses, while businesses requiring broader access may choose multi-user or enterprise licenses for cost-effective access to the report.

                                                              13. Are there any additional resources or data provided in the Autonomous Systems Industry report?

                                                              While the report offers comprehensive insights, it's advisable to review the specific contents or supplementary materials provided to ascertain if additional resources or data are available.

                                                              14. How can I stay updated on further developments or reports in the Autonomous Systems Industry?

                                                              To stay informed about further developments, trends, and reports in the Autonomous Systems Industry, consider subscribing to industry newsletters, following relevant companies and organizations, or regularly checking reputable industry news sources and publications.


                                                              Methodology

                                                              Step 1 - Identification of Relevant Samples Size from Population Database

                                                              Step Chart
                                                              Bar Chart
                                                              Method Chart

                                                              Step 2 - Approaches for Defining Global Market Size (Value, Volume* & Price*)

                                                              Approach Chart
                                                              Top-down and bottom-up approaches are used to validate the global market size and estimate the market size for manufactures, regional segments, product, and application.

                                                              Note*: In applicable scenarios

                                                              Step 3 - Data Sources

                                                              Primary Research

                                                              • Web Analytics
                                                              • Survey Reports
                                                              • Research Institute
                                                              • Latest Research Reports
                                                              • Opinion Leaders

                                                              Secondary Research

                                                              • Annual Reports
                                                              • White Paper
                                                              • Latest Press Release
                                                              • Industry Association
                                                              • Paid Database
                                                              • Investor Presentations
                                                              Analyst Chart

                                                              Step 4 - Data Triangulation

                                                              Involves using different sources of information in order to increase the validity of a study

                                                              These sources are likely to be stakeholders in a program - participants, other researchers, program staff, other community members, and so on.

                                                              Then we put all data in single framework & apply various statistical tools to find out the dynamic on the market.

                                                              During the analysis stage, feedback from the stakeholder groups would be compared to determine areas of agreement as well as areas of divergence

                                                              Additionally, after gathering mixed and scattered data from a wide range of sources, data is triangulated and correlated to come up with estimated figures which are further validated through primary mediums or industry experts, opinion leaders.

                                                              About Report Pinnacle

                                                              Report Pinnacle provides top-tier market research, industry intelligence, and actionable insights for finance, technology, healthcare, and consumer sectors. Our reports empower you to make informed decisions and achieve business success.

                                                              Our expert team combines primary research, data analytics, and industry knowledge to deliver insights you can trust. We offer syndicated reports, custom research, and consulting services tailored to your unique business needs.

                                                              At Report Pinnacle, we are committed to quality, transparency, and client satisfaction. Every report is rigorously validated to ensure accuracy and relevance. Our global perspective and local expertise help you understand both broad trends and detailed market shifts.

                                                              Stay ahead with Report Pinnacle. Subscribe to our newsletter for the latest insights and research highlights, and follow us on social media for real-time updates.

                                                              Report Pinnacle – Your Partner for Reaching the Top in Market Intelligence.

                                                              artwork spiralartwork spiralRelated Reports
                                                              artwork underline

                                                              Tactical UAV Market Market Strategies for the Next Decade: 2025-2033

                                                              The Tactical UAV Market is booming, projected to reach $5.47 billion by 2025, with a CAGR of 13.08% through 2033. Driven by defense spending and technological advancements, this report analyzes market trends, key players (Textron, Safran, Lockheed Martin), and regional growth in North America, Europe, and Asia-Pacific. Discover insights into military, law enforcement, and other applications.

                                                              July 2025
                                                              Base Year: 2024
                                                              No Of Pages: 234
                                                              Price: $4750

                                                              Strategic Vision for UAV Navigation Systems Market Industry Trends

                                                              The UAV Navigation Systems market is booming, projected to reach $30 billion by 2033 with a 15.97% CAGR. Explore key drivers, trends, and restraints shaping this dynamic sector, including insights into autonomous, semi-autonomous, and remotely operated UAV navigation systems. Discover leading companies and regional market analysis.

                                                              July 2025
                                                              Base Year: 2024
                                                              No Of Pages: 234
                                                              Price: $4750

                                                              Autonomous Systems Industry to Grow at XX CAGR: Market Size Analysis and Forecasts 2025-2033

                                                              The Autonomous Systems market is booming, projected to reach $22.07B in 2025 with a 13.33% CAGR. Explore key drivers, trends, restraints, and regional market shares for unmanned aerial, ground, and sea systems. Learn about leading companies and future growth projections.

                                                              July 2025
                                                              Base Year: 2024
                                                              No Of Pages: 234
                                                              Price: $4750

                                                              Drone Logistics and Transportation Market 2025-2033: Preparing for Growth and Change

                                                              The Drone Logistics & Transportation market is booming, with a CAGR exceeding 15%! Learn about key drivers, trends, and restraints shaping this rapidly expanding sector, featuring insights into major players like Amazon & UPS, and regional market share analysis. Discover the future of delivery with this comprehensive market overview.

                                                              July 2025
                                                              Base Year: 2024
                                                              No Of Pages: 234
                                                              Price: $4750

                                                              APAC Drone Inspection and Monitoring Market Market’s Technological Evolution: Trends and Analysis 2025-2033

                                                              The APAC drone inspection & monitoring market is booming, with a CAGR exceeding 14%! Discover key trends, regional insights (China, India, Japan), leading companies (DJI, Yuneec), and growth projections to 2033. Learn how drones are transforming construction, agriculture, and energy sectors.

                                                              July 2025
                                                              Base Year: 2024
                                                              No Of Pages: 210
                                                              Price: $4750

                                                              Strategic Drivers of Growth in Buoys And Beacon Market Industry

                                                              Discover the booming Buoys and Beacons market! This in-depth analysis reveals a $102.48M (2025) market growing at a 3.80% CAGR, driven by maritime safety and infrastructure growth. Explore key segments, leading companies, and regional trends shaping this dynamic industry.

                                                              July 2025
                                                              Base Year: 2024
                                                              No Of Pages: 234
                                                              Price: $4750

                                                              Consumer Trends Driving UAV Payload and Subsystems Market Market Growth

                                                              Discover the booming UAV Payload & Subsystems market! This comprehensive analysis reveals a CAGR of 7.38% through 2033, driven by sensor technology advancements, AI integration, and soaring defense spending. Explore key players like Lockheed Martin and DJI, regional trends, and future growth projections.

                                                              June 2025
                                                              Base Year: 2024
                                                              No Of Pages: 234
                                                              Price: $4750

                                                              Fuel Cell UAV Market Competitive Strategies: Trends and Forecasts 2025-2033

                                                              The Fuel Cell UAV market is booming, projected to reach $5.1 billion by 2033 with a 14.36% CAGR. Discover key trends, driving factors, major players (Teledyne, Elbit Systems, Plug Power), and regional market shares in this comprehensive analysis. Learn about the impact of longer flight times, cleaner energy solutions, and technological advancements on this rapidly growing sector.

                                                              June 2025
                                                              Base Year: 2024
                                                              No Of Pages: 234
                                                              Price: $4750

                                                              Analyzing the Future of North America Inspection Drones Industry: Key Trends to 2033

                                                              The North American inspection drone market is booming, with a CAGR exceeding 12%! Discover key trends, market drivers, and leading companies shaping this dynamic industry. Learn about the opportunities and challenges in this rapidly expanding sector.

                                                              June 2025
                                                              Base Year: 2024
                                                              No Of Pages: 234
                                                              Price: $4750

                                                              Stratospheric UAV Payload Technology Industry Dynamics and Forecasts: 2025-2033 Strategic Insights

                                                              The stratospheric UAV payload technology market is booming, projected to reach $4.42 billion by 2025, with a 15.6% CAGR. Discover key drivers, trends, and leading companies shaping this high-growth sector encompassing battery, solar, and fuel-cell technologies. Explore regional market share and future projections.

                                                              June 2025
                                                              Base Year: 2024
                                                              No Of Pages: 234
                                                              Price: $4750

                                                              Autonomous Aircraft Market Competitor Insights: Trends and Opportunities 2025-2033

                                                              The autonomous aircraft market is booming, projected to reach $6.64 billion by 2025 and grow at a CAGR of 17.07% through 2033. Driven by AI, sensor tech, and increasing demand, this report analyzes market segments (fixed-wing, rotary-wing, cargo, passenger), key players (Boeing, Airbus, Lockheed Martin), and regional growth, offering valuable insights for investors and industry professionals.

                                                              June 2025
                                                              Base Year: 2024
                                                              No Of Pages: 234
                                                              Price: $4750

                                                              Exploring Innovations in Unmanned Ground Vehicle Market: Market Dynamics 2025-2033

                                                              The Unmanned Ground Vehicle (UGV) market is booming, with a projected CAGR of 9.77% through 2033. Explore market size, key drivers, trends, restraints, and regional analysis. Discover leading companies and the future of autonomous ground vehicles in military, civil, and commercial applications.

                                                              June 2025
                                                              Base Year: 2024
                                                              No Of Pages: 234
                                                              Price: $4750

                                                              Future Forecasts for Unmanned Aerial Vehicles Market Industry Growth

                                                              The Unmanned Aerial Vehicles (UAV) market is booming, projected to reach $17.31 billion by 2025 with a 13.74% CAGR. Explore key drivers, trends, and restraints shaping this dynamic industry, including military, commercial, and civil applications, across various UAV types and regions. Discover leading companies and regional market share analysis in this comprehensive market report.

                                                              June 2025
                                                              Base Year: 2024
                                                              No Of Pages: 234
                                                              Price: $4750

                                                              Growth Roadmap for Drone Services Market in Europe Market 2025-2033

                                                              Soar into the future with our in-depth analysis of the booming European drone services market. Discover key trends, growth drivers, and leading companies shaping this €500M+ industry, projected to exceed a CAGR of 10% through 2033. Explore market segmentation and regional insights to understand investment opportunities and navigate this exciting landscape.

                                                              June 2025
                                                              Base Year: 2024
                                                              No Of Pages: 234
                                                              Price: $4750

                                                              Autonomous Ships Market Growth Forecast and Consumer Insights

                                                              The autonomous ships market is booming, projected to reach [estimated 2033 market size] by 2033, driven by AI advancements and the need for safer, more efficient shipping. Explore market trends, key players (ABB, Wärtsilä, Kongsberg), and regional insights in this comprehensive analysis.

                                                              June 2025
                                                              Base Year: 2024
                                                              No Of Pages: 234
                                                              Price: $4750

                                                              UTM Market Innovations Shaping Market Growth 2025-2033

                                                              The UTM market is booming, with a 23.5% CAGR projected to 2033. Discover key trends, drivers, and restraints shaping this $0.98 billion (2025) industry, including regional analysis and leading companies like Thales and Airbus. Explore the potential of drone technology in agriculture, logistics, and surveillance.

                                                              June 2025
                                                              Base Year: 2024
                                                              No Of Pages: 234
                                                              Price: $4750

                                                              Military Unmanned Aerial Vehicles Market Decade Long Trends, Analysis and Forecast 2025-2033

                                                              The Military Unmanned Aerial Vehicles (UAV) market is booming, with a CAGR exceeding 4%. This comprehensive analysis explores market size, key drivers (increasing defense budgets, technological advancements), restraints, and regional trends (North America, Europe, Asia-Pacific). Leading companies like Textron, Boeing, and Lockheed Martin are shaping innovation. Discover the future of military UAVs and their impact on global defense strategies.

                                                              June 2025
                                                              Base Year: 2024
                                                              No Of Pages: 234
                                                              Price: $4750

                                                              Autonomous BVLOS Drone Industry Market Overview: Growth and Insights

                                                              The Autonomous BVLOS Drone market is booming, projected to reach $1.06B in 2025 with a 23.26% CAGR. Discover key drivers, trends, and regional insights in this comprehensive market analysis, including leading companies and applications in military, civil & commercial sectors. Explore the future of drone technology and its impact on various industries.

                                                              June 2025
                                                              Base Year: 2024
                                                              No Of Pages: 234
                                                              Price: $4750

                                                              Latin America Small UAV Industry Drivers of Growth: Opportunities to 2033

                                                              Discover the booming Latin American small UAV market! This analysis reveals a \$262.83 million market in 2025, projected to grow at a 14.15% CAGR through 2033. Explore key drivers, trends, and regional insights for Brazil, Mexico, and Argentina's thriving drone sectors. Learn about leading companies and market segmentation in this comprehensive report.

                                                              June 2025
                                                              Base Year: 2024
                                                              No Of Pages: 234
                                                              Price: $4750

                                                              Drone Sensor Market Strategic Dynamics: Competitor Analysis 2025-2033

                                                              The drone sensor market is booming, projected to reach $4.62 billion by 2033, with a CAGR of 22.13%. Discover key trends, drivers, and restraints shaping this rapidly expanding sector, including insights into leading companies and regional market shares. Learn more about the impact of LiDAR, image, and inertial sensors on drone technology.

                                                              June 2025
                                                              Base Year: 2024
                                                              No Of Pages: 234
                                                              Price: $4750
                                                              • Home
                                                              • About Us
                                                              • Industries
                                                                • Aerospace & Defense
                                                                • Agriculture
                                                                • Animal Nutrition & Wellness
                                                                • Automotive
                                                                • Chemicals & Materials
                                                                • Consumer Goods and Services
                                                                • Energy & Power
                                                                • Financial Services and Investment Intelligence
                                                                • Food & Beverage
                                                                • Home and Property Improvement
                                                                • Hospitality and Tourism
                                                                • Logistics
                                                                • Manufacturing Products and Services
                                                                • Packaging
                                                                • Professional and Commercial Services
                                                                • Real Estate and Construction
                                                                • Retail
                                                                • Technology, Media and Telecom
                                                                • Healthcare
                                                              • Services
                                                              • Contact
                                                              Main Logo
                                                              • Home
                                                              • About Us
                                                              • Industries
                                                                • Aerospace & Defense
                                                                • Agriculture
                                                                • Animal Nutrition & Wellness
                                                                • Automotive
                                                                • Chemicals & Materials
                                                                • Consumer Goods and Services
                                                                • Energy & Power
                                                                • Financial Services and Investment Intelligence
                                                                • Food & Beverage
                                                                • Home and Property Improvement
                                                                • Hospitality and Tourism
                                                                • Logistics
                                                                • Manufacturing Products and Services
                                                                • Packaging
                                                                • Professional and Commercial Services
                                                                • Real Estate and Construction
                                                                • Retail
                                                                • Technology, Media and Telecom
                                                                • Healthcare
                                                              • Services
                                                              • Contact
                                                              +17162654855
                                                              [email protected]

                                                              +17162654855

                                                              [email protected]

                                                              Business Address

                                                              Head Office

                                                              Office no. A 5010, fifth floor, Solitaire Business Hub, Near Phoenix mall, Pune, Maharashtra 411014

                                                              Contact Information

                                                              Craig Francis

                                                              Business Development Head

                                                              +17162654855

                                                              [email protected]

                                                              Connect With Us

                                                              Secure Payment Partners

                                                              payment image
                                                              RetailLogisticsPackagingAutomotiveHealthcareAgricultureEnergy & PowerFood & BeverageAerospace & DefenseChemicals & MaterialsHospitality and TourismAnimal Nutrition & WellnessConsumer Goods and ServicesReal Estate and ConstructionHome and Property ImprovementTechnology, Media and TelecomManufacturing Products and ServicesFinancial Services and Investment Intelligence

                                                              © 2025 All rights reserved


                                                              Privacy Policy
                                                              Terms and Conditions
                                                              FAQ