

Key Insights
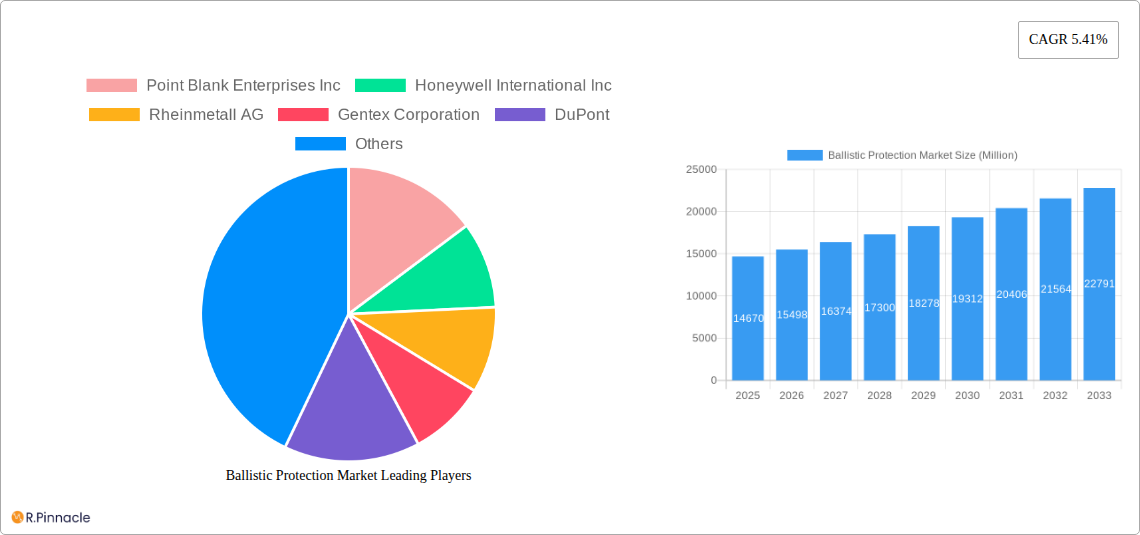
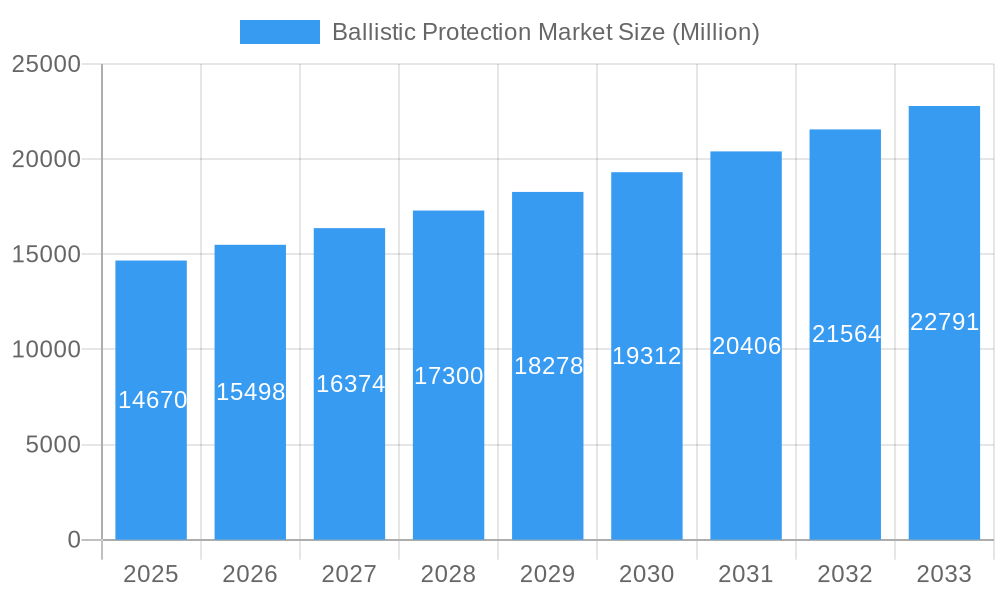
The global ballistic protection market, valued at $14.67 billion in 2025, is projected to experience robust growth, driven by a compound annual growth rate (CAGR) of 5.41% from 2025 to 2033. This expansion is fueled by several key factors. Increasing global terrorism and civil unrest necessitate greater investment in personal and vehicle protection solutions. Furthermore, advancements in materials science are leading to lighter, more flexible, and more effective ballistic protection technologies, expanding market applications across diverse sectors like law enforcement, military, and transportation. The rising demand for sophisticated body armor, especially among law enforcement agencies and military personnel, significantly contributes to market growth. Growth is also spurred by the increasing adoption of ballistic protection in civilian applications, such as armored vehicles for VIP transportation and security services. However, the market faces challenges including the high cost of advanced ballistic materials and the stringent regulatory requirements associated with their manufacturing and deployment.
Ballistic Protection Market Market Size (In Billion)
Geographic segmentation reveals strong growth potential across various regions. North America, particularly the United States, currently dominates the market, owing to its substantial defense spending and robust law enforcement infrastructure. However, the Asia-Pacific region is expected to exhibit significant growth driven by increasing urbanization, rising disposable incomes, and a growing demand for security solutions in developing economies like India and China. Europe's market is relatively mature, but consistent growth is expected, driven by government investments in defense and security. The Middle East and Africa also represent lucrative markets with increasing demand spurred by regional conflicts and security concerns. Market segmentation by application (terrestrial, airborne, marine), technology (soft armor, hard armor), and product type (personal protection equipment, vehicle protection equipment) further refines the market landscape, offering opportunities for specialized product development and targeted marketing strategies. The competitive landscape involves a mix of established multinational corporations and specialized manufacturers, creating a dynamic market environment characterized by innovation and competition.
Ballistic Protection Market Company Market Share
Ballistic Protection Market Report: 2019-2033
This comprehensive report provides an in-depth analysis of the Ballistic Protection Market, offering valuable insights for industry professionals, investors, and strategic decision-makers. Covering the period from 2019 to 2033, with a focus on 2025, this report examines market dynamics, key players, and future trends to illuminate growth opportunities and potential challenges. The market is expected to reach xx Million by 2033.
Ballistic Protection Market Structure & Innovation Trends
The Ballistic Protection Market is characterized by a moderately concentrated landscape with key players holding significant market share. Point Blank Enterprises Inc, Honeywell International Inc, Rheinmetall AG, and Gentex Corporation are among the leading companies, each contributing significantly to the overall market value. Market share data for these companies is currently unavailable, therefore showing xx%. Innovation is a key driver, fueled by advancements in materials science and manufacturing techniques. Stringent regulatory frameworks, particularly within the defense and security sectors, significantly impact product development and adoption. The market also experiences competition from substitute products, such as alternative protective gear and technologies. M&A activities have played a role in shaping the market landscape, although specific deal values remain unavailable for this report(xx Million). End-user demographics are diverse, encompassing military personnel, law enforcement agencies, and civilians.
- Market Concentration: Moderately concentrated, with a few major players dominating.
- Innovation Drivers: Advancements in materials science, manufacturing technologies.
- Regulatory Frameworks: Stringent regulations, particularly in defense and security.
- Product Substitutes: Alternative protective gear and technologies.
- M&A Activities: Significant but specific deal values unavailable (xx Million).
- End-User Demographics: Military, law enforcement, civilians.
Ballistic Protection Market Dynamics & Trends
The Ballistic Protection Market exhibits robust growth, driven by increasing global security concerns and rising demand from military and law enforcement agencies. Technological advancements, such as the development of lighter and more effective materials (as seen with Dyneema SB301), are propelling market expansion. Consumer preference shifts towards advanced protection solutions with enhanced comfort and mobility also contribute to market growth. Competitive dynamics are intense, with companies focusing on innovation, strategic partnerships, and mergers and acquisitions to gain a competitive edge. The Compound Annual Growth Rate (CAGR) for the forecast period (2025-2033) is projected to be xx%. Market penetration is high in developed nations, with significant growth potential in emerging economies.
Dominant Regions & Segments in Ballistic Protection Market
The Terrestrial segment currently dominates the application-based market, driven by the high demand for personal and vehicle protection equipment in various sectors. Within the technology segment, Hard Armor holds a larger market share due to its superior protection capabilities, although Soft Armor is experiencing growth due to advancements in material science leading to lighter and more flexible solutions. The Personal Protection Equipment (PPE) segment dominates the product type category. The North American region holds the largest market share due to high defense spending and strong law enforcement presence.
- Key Drivers for Terrestrial Segment: Growing urbanization, increasing crime rates, and heightened security concerns.
- Key Drivers for Hard Armor Segment: Superior protection, demand from military and law enforcement.
- Key Drivers for PPE Segment: Growing demand from diverse end-users.
- Key Drivers for North American Region: High defense spending, robust law enforcement presence.
Ballistic Protection Market Product Innovations
Recent innovations focus on lighter, more comfortable, and more effective ballistic protection. Dyneema SB301, for example, represents a significant leap in soft armor technology, offering a 10-20% weight reduction. 3D-printed ballistic armor using graphene demonstrates another pathway toward enhanced protection solutions. These innovations cater to the demand for improved performance and user experience, driving market growth and shaping competitive advantages.
Report Scope & Segmentation Analysis
This report segments the Ballistic Protection Market by Application (Terrestrial, Airborne, Marine), Technology (Soft Armor, Hard Armor), and Product Type (Personal Protection Equipment, Vehicle Protection Equipment). Each segment offers unique growth opportunities and competitive dynamics. Growth projections vary depending on the segment, reflecting diverse market trends and adoption rates. Market sizes and competitive landscapes are analyzed for each segment. (Specific data unavailable, using xx as a placeholder).
- Application: Terrestrial, Airborne, Marine (Growth projections: xx%, xx%, xx% respectively).
- Technology: Soft Armor, Hard Armor (Growth projections: xx%, xx% respectively).
- Product Type: Personal Protection Equipment, Vehicle Protection Equipment (Growth projections: xx%, xx% respectively).
Key Drivers of Ballistic Protection Market Growth
Several factors drive the growth of this market, including increased global security concerns, rising demand from military and law enforcement agencies, technological advancements leading to improved materials and designs, and increased government spending on defense and security. The development of lighter and more comfortable ballistic protection solutions also contributes to market growth.
Challenges in the Ballistic Protection Market Sector
Challenges include stringent regulatory requirements impacting product development and adoption, potential supply chain disruptions affecting raw material availability and production costs, and intense competition leading to price pressures. These factors can impact profitability and market expansion. Quantifiable impacts are currently unavailable, represented by xx.
Emerging Opportunities in Ballistic Protection Market
Emerging opportunities include the expansion into new markets, particularly in developing economies, the development of specialized protection solutions for specific threats (e.g., IEDs), and the integration of advanced technologies like sensors and communication systems into ballistic protection equipment.
Leading Players in the Ballistic Protection Market Market
- Point Blank Enterprises Inc
- Honeywell International Inc
- Rheinmetall AG
- Gentex Corporation
- DuPont
- Avon Polymer Products Limited
- Survitec Group Limited
- TenCate Advanced Armor USA Inc
- BAE Systems plc
- Saab AB
Key Developments in Ballistic Protection Market Industry
- October 2023: Dyneema SB301 launch, promising lighter soft armor vests.
- December 2022: Nova Graphene Ballistics announces 3D-printed graphene ballistic armor.
- October 2022: European Defence Agency launches project on advanced metallic materials for ballistic steels.
Future Outlook for Ballistic Protection Market Market
The future outlook for the Ballistic Protection Market is positive, driven by ongoing technological advancements, increased demand from diverse end-users, and growth in key regions. Strategic partnerships and investments in research and development will further shape the market landscape, creating lucrative opportunities for established players and new entrants alike. The market is poised for sustained growth, although specific growth projections are unavailable, represented by xx.
Ballistic Protection Market Segmentation
-
1. Product Type
- 1.1. Personal Protection Equipment
- 1.2. Vehicle Protection Equipment
-
2. Application
- 2.1. Terrestrial
- 2.2. Airborne
- 2.3. Marine
-
3. Technology
- 3.1. Soft Armor
- 3.2. Hard Armor
Ballistic Protection Market Segmentation By Geography
-
1. North America
- 1.1. United States
- 1.2. Canada
-
2. Europe
- 2.1. United Kingdom
- 2.2. France
- 2.3. Germany
- 2.4. Russia
- 2.5. Rest of Europe
-
3. Asia Pacific
- 3.1. China
- 3.2. India
- 3.3. Japan
- 3.4. South Korea
- 3.5. Rest of Asia Pacific
-
4. Latin America
- 4.1. Brazil
- 4.2. Mexico
- 4.3. Rest of Latin America
-
5. Middle East and Africa
- 5.1. Saudi Arabia
- 5.2. United Arab Emirates
- 5.3. Rest of Middle East and Africa
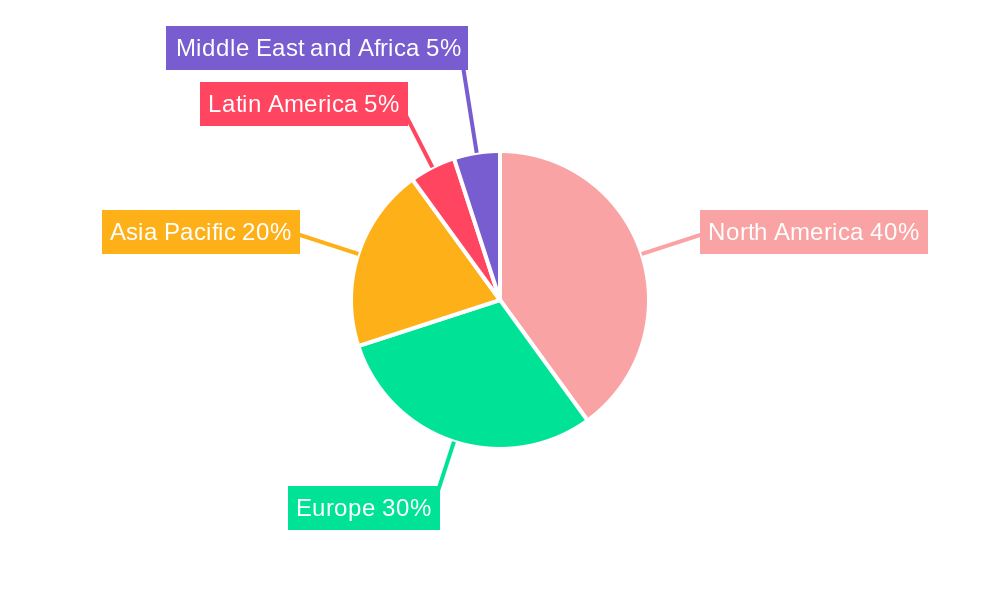
Ballistic Protection Market Regional Market Share
Geographic Coverage of Ballistic Protection Market
Ballistic Protection Market REPORT HIGHLIGHTS
| Aspects | Details |
|---|---|
| Study Period | 2020-2034 |
| Base Year | 2025 |
| Estimated Year | 2026 |
| Forecast Period | 2026-2034 |
| Historical Period | 2020-2025 |
| Growth Rate | CAGR of 5.41% from 2020-2034 |
| Segmentation |
|
Table of Contents
- 1. Introduction
- 1.1. Research Scope
- 1.2. Market Segmentation
- 1.3. Research Objective
- 1.4. Definitions and Assumptions
- 2. Executive Summary
- 2.1. Market Snapshot
- 3. Market Dynamics
- 3.1. Market Drivers
- 3.2. Market Restrains
- 3.3. Market Trends
- 3.4. Market Opportunities
- 4. Market Factor Analysis
- 4.1. Porters Five Forces
- 4.1.1. Bargaining Power of Suppliers
- 4.1.2. Bargaining Power of Buyers
- 4.1.3. Threat of New Entrants
- 4.1.4. Threat of Substitutes
- 4.1.5. Competitive Rivalry
- 4.2. PESTEL analysis
- 4.3. BCG Analysis
- 4.3.1. Stars (High Growth, High Market Share)
- 4.3.2. Cash Cows (Low Growth, High Market Share)
- 4.3.3. Question Mark (High Growth, Low Market Share)
- 4.3.4. Dogs (Low Growth, Low Market Share)
- 4.4. Ansoff Matrix Analysis
- 4.5. Supply Chain Analysis
- 4.6. Regulatory Landscape
- 4.7. Current Market Potential and Opportunity Assessment (TAM–SAM–SOM Framework)
- 4.8. PRI Analyst Note
- 4.1. Porters Five Forces
- 5. Market Analysis, Insights and Forecast 2021-2033
- 5.1. Market Analysis, Insights and Forecast - by Product Type
- 5.1.1. Personal Protection Equipment
- 5.1.2. Vehicle Protection Equipment
- 5.2. Market Analysis, Insights and Forecast - by Application
- 5.2.1. Terrestrial
- 5.2.2. Airborne
- 5.2.3. Marine
- 5.3. Market Analysis, Insights and Forecast - by Technology
- 5.3.1. Soft Armor
- 5.3.2. Hard Armor
- 5.4. Market Analysis, Insights and Forecast - by Region
- 5.4.1. North America
- 5.4.2. Europe
- 5.4.3. Asia Pacific
- 5.4.4. Latin America
- 5.4.5. Middle East and Africa
- 5.1. Market Analysis, Insights and Forecast - by Product Type
- 6. Global Ballistic Protection Market Analysis, Insights and Forecast, 2021-2033
- 6.1. Market Analysis, Insights and Forecast - by Product Type
- 6.1.1. Personal Protection Equipment
- 6.1.2. Vehicle Protection Equipment
- 6.2. Market Analysis, Insights and Forecast - by Application
- 6.2.1. Terrestrial
- 6.2.2. Airborne
- 6.2.3. Marine
- 6.3. Market Analysis, Insights and Forecast - by Technology
- 6.3.1. Soft Armor
- 6.3.2. Hard Armor
- 6.1. Market Analysis, Insights and Forecast - by Product Type
- 7. North America Ballistic Protection Market Analysis, Insights and Forecast, 2020-2032
- 7.1. Market Analysis, Insights and Forecast - by Product Type
- 7.1.1. Personal Protection Equipment
- 7.1.2. Vehicle Protection Equipment
- 7.2. Market Analysis, Insights and Forecast - by Application
- 7.2.1. Terrestrial
- 7.2.2. Airborne
- 7.2.3. Marine
- 7.3. Market Analysis, Insights and Forecast - by Technology
- 7.3.1. Soft Armor
- 7.3.2. Hard Armor
- 7.1. Market Analysis, Insights and Forecast - by Product Type
- 8. Europe Ballistic Protection Market Analysis, Insights and Forecast, 2020-2032
- 8.1. Market Analysis, Insights and Forecast - by Product Type
- 8.1.1. Personal Protection Equipment
- 8.1.2. Vehicle Protection Equipment
- 8.2. Market Analysis, Insights and Forecast - by Application
- 8.2.1. Terrestrial
- 8.2.2. Airborne
- 8.2.3. Marine
- 8.3. Market Analysis, Insights and Forecast - by Technology
- 8.3.1. Soft Armor
- 8.3.2. Hard Armor
- 8.1. Market Analysis, Insights and Forecast - by Product Type
- 9. Asia Pacific Ballistic Protection Market Analysis, Insights and Forecast, 2020-2032
- 9.1. Market Analysis, Insights and Forecast - by Product Type
- 9.1.1. Personal Protection Equipment
- 9.1.2. Vehicle Protection Equipment
- 9.2. Market Analysis, Insights and Forecast - by Application
- 9.2.1. Terrestrial
- 9.2.2. Airborne
- 9.2.3. Marine
- 9.3. Market Analysis, Insights and Forecast - by Technology
- 9.3.1. Soft Armor
- 9.3.2. Hard Armor
- 9.1. Market Analysis, Insights and Forecast - by Product Type
- 10. Latin America Ballistic Protection Market Analysis, Insights and Forecast, 2020-2032
- 10.1. Market Analysis, Insights and Forecast - by Product Type
- 10.1.1. Personal Protection Equipment
- 10.1.2. Vehicle Protection Equipment
- 10.2. Market Analysis, Insights and Forecast - by Application
- 10.2.1. Terrestrial
- 10.2.2. Airborne
- 10.2.3. Marine
- 10.3. Market Analysis, Insights and Forecast - by Technology
- 10.3.1. Soft Armor
- 10.3.2. Hard Armor
- 10.1. Market Analysis, Insights and Forecast - by Product Type
- 11. Middle East and Africa Ballistic Protection Market Analysis, Insights and Forecast, 2020-2032
- 11.1. Market Analysis, Insights and Forecast - by Product Type
- 11.1.1. Personal Protection Equipment
- 11.1.2. Vehicle Protection Equipment
- 11.2. Market Analysis, Insights and Forecast - by Application
- 11.2.1. Terrestrial
- 11.2.2. Airborne
- 11.2.3. Marine
- 11.3. Market Analysis, Insights and Forecast - by Technology
- 11.3.1. Soft Armor
- 11.3.2. Hard Armor
- 11.1. Market Analysis, Insights and Forecast - by Product Type
- 12. Competitive Analysis
- 12.1. Company Profiles
- 12.1.1 Point Blank Enterprises Inc
- 12.1.1.1. Company Overview
- 12.1.1.2. Products
- 12.1.1.3. Company Financials
- 12.1.1.4. SWOT Analysis
- 12.1.2 Honeywell International Inc
- 12.1.2.1. Company Overview
- 12.1.2.2. Products
- 12.1.2.3. Company Financials
- 12.1.2.4. SWOT Analysis
- 12.1.3 Rheinmetall AG
- 12.1.3.1. Company Overview
- 12.1.3.2. Products
- 12.1.3.3. Company Financials
- 12.1.3.4. SWOT Analysis
- 12.1.4 Gentex Corporation
- 12.1.4.1. Company Overview
- 12.1.4.2. Products
- 12.1.4.3. Company Financials
- 12.1.4.4. SWOT Analysis
- 12.1.5 DuPont
- 12.1.5.1. Company Overview
- 12.1.5.2. Products
- 12.1.5.3. Company Financials
- 12.1.5.4. SWOT Analysis
- 12.1.6 Avon Polymer Products Limited
- 12.1.6.1. Company Overview
- 12.1.6.2. Products
- 12.1.6.3. Company Financials
- 12.1.6.4. SWOT Analysis
- 12.1.7 Survitec Group Limited
- 12.1.7.1. Company Overview
- 12.1.7.2. Products
- 12.1.7.3. Company Financials
- 12.1.7.4. SWOT Analysis
- 12.1.8 TenCate Advanced Armor USA Inc
- 12.1.8.1. Company Overview
- 12.1.8.2. Products
- 12.1.8.3. Company Financials
- 12.1.8.4. SWOT Analysis
- 12.1.9 BAE Systems plc
- 12.1.9.1. Company Overview
- 12.1.9.2. Products
- 12.1.9.3. Company Financials
- 12.1.9.4. SWOT Analysis
- 12.1.10 Saab AB
- 12.1.10.1. Company Overview
- 12.1.10.2. Products
- 12.1.10.3. Company Financials
- 12.1.10.4. SWOT Analysis
- 12.1.1 Point Blank Enterprises Inc
- 12.2. Market Entropy
- 12.2.1 Company's Key Areas Served
- 12.2.2 Recent Developments
- 12.3. Company Market Share Analysis 2025
- 12.3.1 Top 5 Companies Market Share Analysis
- 12.3.2 Top 3 Companies Market Share Analysis
- 12.4. List of Potential Customers
- 13. Research Methodology
List of Figures
- Figure 1: Global Ballistic Protection Market Revenue Breakdown (Million, %) by Region 2025 & 2033
- Figure 2: North America Ballistic Protection Market Revenue (Million), by Product Type 2025 & 2033
- Figure 3: North America Ballistic Protection Market Revenue Share (%), by Product Type 2025 & 2033
- Figure 4: North America Ballistic Protection Market Revenue (Million), by Application 2025 & 2033
- Figure 5: North America Ballistic Protection Market Revenue Share (%), by Application 2025 & 2033
- Figure 6: North America Ballistic Protection Market Revenue (Million), by Technology 2025 & 2033
- Figure 7: North America Ballistic Protection Market Revenue Share (%), by Technology 2025 & 2033
- Figure 8: North America Ballistic Protection Market Revenue (Million), by Country 2025 & 2033
- Figure 9: North America Ballistic Protection Market Revenue Share (%), by Country 2025 & 2033
- Figure 10: Europe Ballistic Protection Market Revenue (Million), by Product Type 2025 & 2033
- Figure 11: Europe Ballistic Protection Market Revenue Share (%), by Product Type 2025 & 2033
- Figure 12: Europe Ballistic Protection Market Revenue (Million), by Application 2025 & 2033
- Figure 13: Europe Ballistic Protection Market Revenue Share (%), by Application 2025 & 2033
- Figure 14: Europe Ballistic Protection Market Revenue (Million), by Technology 2025 & 2033
- Figure 15: Europe Ballistic Protection Market Revenue Share (%), by Technology 2025 & 2033
- Figure 16: Europe Ballistic Protection Market Revenue (Million), by Country 2025 & 2033
- Figure 17: Europe Ballistic Protection Market Revenue Share (%), by Country 2025 & 2033
- Figure 18: Asia Pacific Ballistic Protection Market Revenue (Million), by Product Type 2025 & 2033
- Figure 19: Asia Pacific Ballistic Protection Market Revenue Share (%), by Product Type 2025 & 2033
- Figure 20: Asia Pacific Ballistic Protection Market Revenue (Million), by Application 2025 & 2033
- Figure 21: Asia Pacific Ballistic Protection Market Revenue Share (%), by Application 2025 & 2033
- Figure 22: Asia Pacific Ballistic Protection Market Revenue (Million), by Technology 2025 & 2033
- Figure 23: Asia Pacific Ballistic Protection Market Revenue Share (%), by Technology 2025 & 2033
- Figure 24: Asia Pacific Ballistic Protection Market Revenue (Million), by Country 2025 & 2033
- Figure 25: Asia Pacific Ballistic Protection Market Revenue Share (%), by Country 2025 & 2033
- Figure 26: Latin America Ballistic Protection Market Revenue (Million), by Product Type 2025 & 2033
- Figure 27: Latin America Ballistic Protection Market Revenue Share (%), by Product Type 2025 & 2033
- Figure 28: Latin America Ballistic Protection Market Revenue (Million), by Application 2025 & 2033
- Figure 29: Latin America Ballistic Protection Market Revenue Share (%), by Application 2025 & 2033
- Figure 30: Latin America Ballistic Protection Market Revenue (Million), by Technology 2025 & 2033
- Figure 31: Latin America Ballistic Protection Market Revenue Share (%), by Technology 2025 & 2033
- Figure 32: Latin America Ballistic Protection Market Revenue (Million), by Country 2025 & 2033
- Figure 33: Latin America Ballistic Protection Market Revenue Share (%), by Country 2025 & 2033
- Figure 34: Middle East and Africa Ballistic Protection Market Revenue (Million), by Product Type 2025 & 2033
- Figure 35: Middle East and Africa Ballistic Protection Market Revenue Share (%), by Product Type 2025 & 2033
- Figure 36: Middle East and Africa Ballistic Protection Market Revenue (Million), by Application 2025 & 2033
- Figure 37: Middle East and Africa Ballistic Protection Market Revenue Share (%), by Application 2025 & 2033
- Figure 38: Middle East and Africa Ballistic Protection Market Revenue (Million), by Technology 2025 & 2033
- Figure 39: Middle East and Africa Ballistic Protection Market Revenue Share (%), by Technology 2025 & 2033
- Figure 40: Middle East and Africa Ballistic Protection Market Revenue (Million), by Country 2025 & 2033
- Figure 41: Middle East and Africa Ballistic Protection Market Revenue Share (%), by Country 2025 & 2033
List of Tables
- Table 1: Global Ballistic Protection Market Revenue Million Forecast, by Product Type 2020 & 2033
- Table 2: Global Ballistic Protection Market Revenue Million Forecast, by Application 2020 & 2033
- Table 3: Global Ballistic Protection Market Revenue Million Forecast, by Technology 2020 & 2033
- Table 4: Global Ballistic Protection Market Revenue Million Forecast, by Region 2020 & 2033
- Table 5: Global Ballistic Protection Market Revenue Million Forecast, by Product Type 2020 & 2033
- Table 6: Global Ballistic Protection Market Revenue Million Forecast, by Application 2020 & 2033
- Table 7: Global Ballistic Protection Market Revenue Million Forecast, by Technology 2020 & 2033
- Table 8: Global Ballistic Protection Market Revenue Million Forecast, by Country 2020 & 2033
- Table 9: United States Ballistic Protection Market Revenue (Million) Forecast, by Application 2020 & 2033
- Table 10: Canada Ballistic Protection Market Revenue (Million) Forecast, by Application 2020 & 2033
- Table 11: Global Ballistic Protection Market Revenue Million Forecast, by Product Type 2020 & 2033
- Table 12: Global Ballistic Protection Market Revenue Million Forecast, by Application 2020 & 2033
- Table 13: Global Ballistic Protection Market Revenue Million Forecast, by Technology 2020 & 2033
- Table 14: Global Ballistic Protection Market Revenue Million Forecast, by Country 2020 & 2033
- Table 15: United Kingdom Ballistic Protection Market Revenue (Million) Forecast, by Application 2020 & 2033
- Table 16: France Ballistic Protection Market Revenue (Million) Forecast, by Application 2020 & 2033
- Table 17: Germany Ballistic Protection Market Revenue (Million) Forecast, by Application 2020 & 2033
- Table 18: Russia Ballistic Protection Market Revenue (Million) Forecast, by Application 2020 & 2033
- Table 19: Rest of Europe Ballistic Protection Market Revenue (Million) Forecast, by Application 2020 & 2033
- Table 20: Global Ballistic Protection Market Revenue Million Forecast, by Product Type 2020 & 2033
- Table 21: Global Ballistic Protection Market Revenue Million Forecast, by Application 2020 & 2033
- Table 22: Global Ballistic Protection Market Revenue Million Forecast, by Technology 2020 & 2033
- Table 23: Global Ballistic Protection Market Revenue Million Forecast, by Country 2020 & 2033
- Table 24: China Ballistic Protection Market Revenue (Million) Forecast, by Application 2020 & 2033
- Table 25: India Ballistic Protection Market Revenue (Million) Forecast, by Application 2020 & 2033
- Table 26: Japan Ballistic Protection Market Revenue (Million) Forecast, by Application 2020 & 2033
- Table 27: South Korea Ballistic Protection Market Revenue (Million) Forecast, by Application 2020 & 2033
- Table 28: Rest of Asia Pacific Ballistic Protection Market Revenue (Million) Forecast, by Application 2020 & 2033
- Table 29: Global Ballistic Protection Market Revenue Million Forecast, by Product Type 2020 & 2033
- Table 30: Global Ballistic Protection Market Revenue Million Forecast, by Application 2020 & 2033
- Table 31: Global Ballistic Protection Market Revenue Million Forecast, by Technology 2020 & 2033
- Table 32: Global Ballistic Protection Market Revenue Million Forecast, by Country 2020 & 2033
- Table 33: Brazil Ballistic Protection Market Revenue (Million) Forecast, by Application 2020 & 2033
- Table 34: Mexico Ballistic Protection Market Revenue (Million) Forecast, by Application 2020 & 2033
- Table 35: Rest of Latin America Ballistic Protection Market Revenue (Million) Forecast, by Application 2020 & 2033
- Table 36: Global Ballistic Protection Market Revenue Million Forecast, by Product Type 2020 & 2033
- Table 37: Global Ballistic Protection Market Revenue Million Forecast, by Application 2020 & 2033
- Table 38: Global Ballistic Protection Market Revenue Million Forecast, by Technology 2020 & 2033
- Table 39: Global Ballistic Protection Market Revenue Million Forecast, by Country 2020 & 2033
- Table 40: Saudi Arabia Ballistic Protection Market Revenue (Million) Forecast, by Application 2020 & 2033
- Table 41: United Arab Emirates Ballistic Protection Market Revenue (Million) Forecast, by Application 2020 & 2033
- Table 42: Rest of Middle East and Africa Ballistic Protection Market Revenue (Million) Forecast, by Application 2020 & 2033
Frequently Asked Questions
1. What is the projected Compound Annual Growth Rate (CAGR) of the Ballistic Protection Market?
The projected CAGR is approximately 5.41%.
2. Which companies are prominent players in the Ballistic Protection Market?
Key companies in the market include Point Blank Enterprises Inc, Honeywell International Inc, Rheinmetall AG, Gentex Corporation, DuPont, Avon Polymer Products Limited, Survitec Group Limited, TenCate Advanced Armor USA Inc, BAE Systems plc, Saab AB.
3. What are the main segments of the Ballistic Protection Market?
The market segments include Product Type, Application, Technology.
4. Can you provide details about the market size?
The market size is estimated to be USD 14.67 Million as of 2022.
5. What are some drivers contributing to market growth?
N/A
6. What are the notable trends driving market growth?
Vehicle Protection Equipment Segment Is Expected to Witness Significant Growth During the Forecast Period.
7. Are there any restraints impacting market growth?
N/A
8. Can you provide examples of recent developments in the market?
October 2023: Dyneema, a part of Avient Corporation, a leading provider of specialty and sustainable material solutions, launched a next-generation unidirectional (UD) material innovation based on its third-generation fiber named Dyneema SB301. This material is envisioned to enable body armor manufacturers to design soft armor vests 10–20% lighter than previous protective solutions.
9. What pricing options are available for accessing the report?
Pricing options include single-user, multi-user, and enterprise licenses priced at USD 4750, USD 5250, and USD 8750 respectively.
10. Is the market size provided in terms of value or volume?
The market size is provided in terms of value, measured in Million.
11. Are there any specific market keywords associated with the report?
Yes, the market keyword associated with the report is "Ballistic Protection Market," which aids in identifying and referencing the specific market segment covered.
12. How do I determine which pricing option suits my needs best?
The pricing options vary based on user requirements and access needs. Individual users may opt for single-user licenses, while businesses requiring broader access may choose multi-user or enterprise licenses for cost-effective access to the report.
13. Are there any additional resources or data provided in the Ballistic Protection Market report?
While the report offers comprehensive insights, it's advisable to review the specific contents or supplementary materials provided to ascertain if additional resources or data are available.
14. How can I stay updated on further developments or reports in the Ballistic Protection Market?
To stay informed about further developments, trends, and reports in the Ballistic Protection Market, consider subscribing to industry newsletters, following relevant companies and organizations, or regularly checking reputable industry news sources and publications.
Methodology
Step 1 - Identification of Relevant Samples Size from Population Database


Step 2 - Approaches for Defining Global Market Size (Value, Volume* & Price*)

Note*: In applicable scenarios
Step 3 - Data Sources
Primary Research
- Web Analytics
- Survey Reports
- Research Institute
- Latest Research Reports
- Opinion Leaders
Secondary Research
- Annual Reports
- White Paper
- Latest Press Release
- Industry Association
- Paid Database
- Investor Presentations

Step 4 - Data Triangulation
Involves using different sources of information in order to increase the validity of a study
These sources are likely to be stakeholders in a program - participants, other researchers, program staff, other community members, and so on.
Then we put all data in single framework & apply various statistical tools to find out the dynamic on the market.
During the analysis stage, feedback from the stakeholder groups would be compared to determine areas of agreement as well as areas of divergence