

Key Insights
The global beryllium market, projected to reach $231.5 million by 2033, is forecast to expand at a compound annual growth rate (CAGR) of 6.8% from a base year of 2025. This robust growth trajectory is primarily propelled by escalating demand across critical industries. The aerospace and defense sector remains a key driver, leveraging beryllium's exceptional strength-to-weight ratio, stiffness, and thermal stability for high-performance applications. The automotive industry is also a significant contributor, adopting beryllium for lightweighting to boost fuel efficiency and performance. Moreover, the burgeoning electronics and telecommunications sectors are integrating beryllium into advanced devices for its superior electrical conductivity and thermal management properties. While the healthcare sector's contribution is smaller, it is also growing with specialized medical device applications. However, challenges persist, including the high cost of beryllium extraction and processing, inherent toxicity, and stringent environmental regulations. Strategic advancements in extraction, processing, and safety protocols will be vital for unlocking the market's full potential.
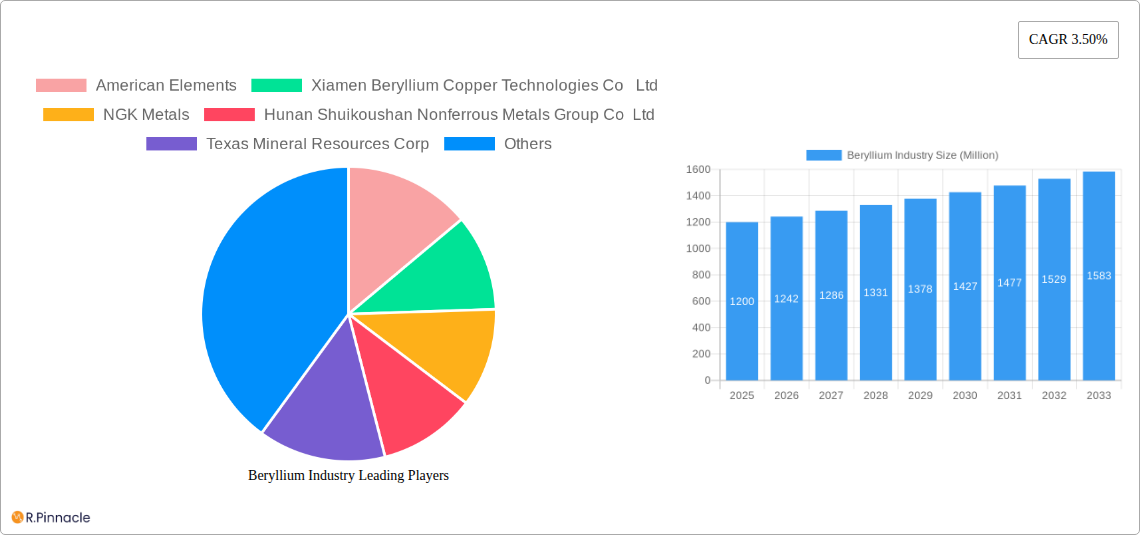
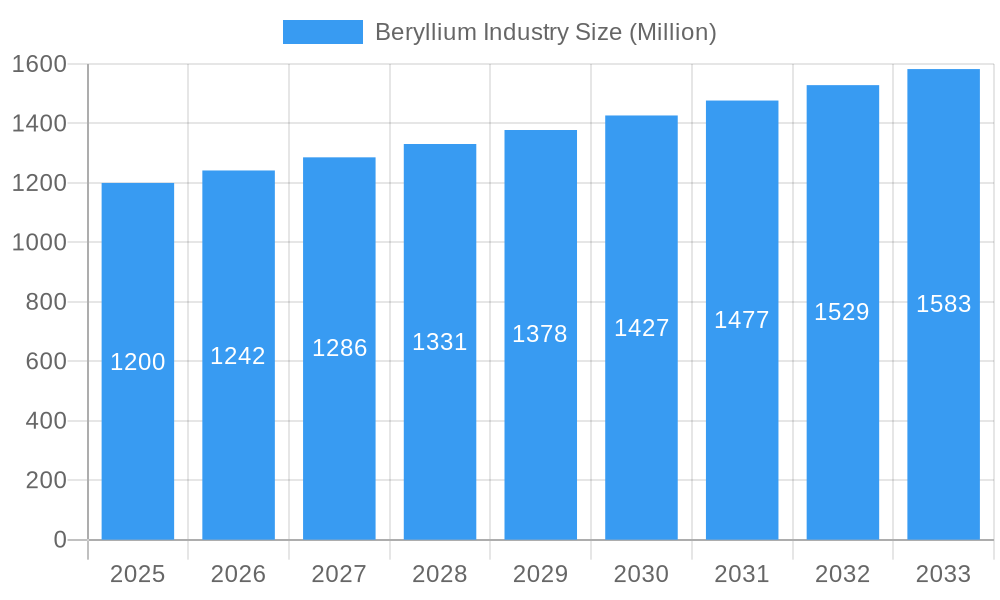
Beryllium Industry Market Size (In Million)
The beryllium market is segmented by end-user industry, including industrial components, automotive, healthcare, aerospace & defense, oil & gas, electronics & telecommunication, and others. Product types encompass alloys, metals, ceramics, and others. The aerospace and defense sector is expected to retain its leading position, while the electronics and telecommunication segment is poised for the highest growth rate. Regionally, North America and the Asia Pacific currently dominate market share, driven by robust industrial activity and technological innovation. Emerging economies within the Asia Pacific, notably China and India, are anticipated to exhibit significant growth in beryllium demand due to infrastructure development and expanding manufacturing bases. The competitive landscape features established and emerging players, with strategic alliances, acquisitions, and technological innovations influencing market dynamics. Continuous exploration and development of beryllium resources are crucial for sustaining market growth and ensuring supply chain stability.
Beryllium Industry Company Market Share
Beryllium Industry Market Report: 2019-2033
This comprehensive report provides an in-depth analysis of the global beryllium industry, offering invaluable insights for industry professionals, investors, and strategic decision-makers. Covering the period from 2019 to 2033, with a focus on 2025, this report meticulously examines market dynamics, key players, and future growth opportunities. The report projects a market size of xx Million by 2033, exhibiting a CAGR of xx% during the forecast period (2025-2033).
Beryllium Industry Market Structure & Innovation Trends
This section analyzes the competitive landscape of the beryllium industry, encompassing market concentration, innovation drivers, regulatory frameworks, substitute products, end-user demographics, and mergers & acquisitions (M&A) activities. The global beryllium market exhibits a moderately concentrated structure, with key players like Materion Corporation and IBC Advanced Alloys holding significant market share (estimated at xx% and xx% respectively in 2025). Innovation is driven by the need for lighter, stronger, and more heat-resistant materials in high-tech applications. Regulatory frameworks, particularly concerning environmental and health regulations surrounding beryllium's toxicity, significantly impact market dynamics. The substitution of beryllium with alternative materials in certain applications poses a challenge. M&A activities in the sector have been relatively low in recent years, with total deal values reaching approximately xx Million during the historical period (2019-2024), however, we project an increase to xx Million by 2033.
Beryllium Industry Market Dynamics & Trends
The global beryllium market is experiencing significant growth driven by increasing demand from various end-user industries, including aerospace & defense, electronics, and automotive. Technological advancements, such as the development of novel beryllium alloys with enhanced properties, further fuel market expansion. Consumer preference for lightweight and high-performance products is a key factor driving demand. However, the market faces challenges from price volatility and the inherent toxicity of beryllium, necessitating stringent safety regulations. Competitive dynamics are shaped by the limited number of major players and their ongoing efforts to enhance product offerings and expand into new markets. The market's growth is estimated at a CAGR of xx% from 2019 to 2024, with market penetration in key sectors (e.g., aerospace) expected to reach xx% by 2033.
Dominant Regions & Segments in Beryllium Industry
The aerospace and defense sector is the leading end-user industry for beryllium, driven by its unique properties in high-performance applications. North America holds a significant market share due to its robust aerospace industry. The Alloys segment dominates in terms of product type, owing to the widespread use of beryllium alloys in diverse applications.
- Key Drivers for North America: Strong aerospace & defense industry, robust R&D investments, supportive government policies.
- Key Drivers for Alloys Segment: Superior material properties, wider application range compared to other product forms.
Detailed analysis reveals that while other regions like Asia-Pacific are demonstrating strong growth potential, North America remains the dominant region due to its established industrial base and technological leadership. The market is expected to be further segmented by specific applications within each end-user industry, leading to diverse growth trajectories for various segments.
Beryllium Industry Product Innovations
Recent innovations in beryllium materials focus on enhancing their properties, such as improved strength, machinability, and resistance to high temperatures. These advancements cater to the specific needs of various applications, leading to enhanced performance and competitiveness. For instance, the development of new beryllium alloys with optimized compositions is addressing previous limitations related to processing and material durability. This translates to improved market penetration across various sectors, driving growth in the overall beryllium market.
Report Scope & Segmentation Analysis
This report comprehensively segments the beryllium market based on end-user industry (Industrial Components, Automotive, Healthcare, Aerospace & Defense, Oil & Gas, Electronics & Telecommunication, Other) and product type (Alloys, Metals, Ceramics, Other). Each segment’s growth projections are analyzed based on historical data and future market trends. For example, the Aerospace and Defense segment is projected to experience robust growth due to increased demand for lightweight and high-strength materials in aircraft and missile systems. Market size for each segment is detailed in the full report and competition within each segment is analyzed through market share and strategic moves by key players.
Key Drivers of Beryllium Industry Growth
The beryllium industry's growth is propelled by several key factors. Technological advancements constantly enhance beryllium's capabilities, making it ideal for demanding applications in aerospace, electronics, and other sectors. The rising demand for lightweight and high-performance materials across diverse industries is a major driver. Government support and investments in research and development further stimulate growth. Finally, favorable economic conditions in many key markets contribute to increased production and consumption of beryllium products.
Challenges in the Beryllium Industry Sector
The beryllium industry faces significant challenges, including the inherent toxicity of beryllium, necessitating strict safety regulations and increasing production costs. Supply chain vulnerabilities and fluctuating raw material prices also pose risks. Competition from alternative materials, such as composites and advanced ceramics, is intense, resulting in price pressure and market share erosion for beryllium. These factors limit the industry's growth potential and require strategic adaptation by market participants.
Emerging Opportunities in Beryllium Industry
Emerging opportunities lie in the development of advanced beryllium alloys tailored for specific applications, such as next-generation aerospace components and high-frequency electronics. Expansion into new markets, particularly in emerging economies with growing industrialization, presents significant growth potential. The adoption of sustainable manufacturing processes and the development of recycling technologies can address environmental concerns and boost market acceptance.
Leading Players in the Beryllium Industry Market
- American Elements
- Xiamen Beryllium Copper Technologies Co Ltd
- NGK Metals
- Hunan Shuikoushan Nonferrous Metals Group Co Ltd
- Texas Mineral Resources Corp
- Belmont Metals
- Tropag Oscar H Ritter Nachf GmbH
- National Atomic Company Kazatomprom
- IBC Advanced Alloys
- Materion Corporation
- American Beryllia Inc
Key Developments in Beryllium Industry
- July 2022: Materion Corporation and Kairos Power jointly commissioned a Molten Salt Purification Plant (MSPP) for Flibe production, solidifying Materion's position as a key supplier in nuclear energy.
- April 2022: IBC Advanced Alloys launched copper alloy casting at its expanded facility, significantly increasing its production capacity.
Future Outlook for Beryllium Industry Market
The future of the beryllium industry is promising, driven by continued innovation, increasing demand from high-growth sectors, and the potential for new applications. Strategic investments in R&D and the adoption of sustainable practices will be crucial for ensuring long-term market success. The industry’s growth is projected to accelerate in the coming years, creating significant opportunities for key players and new entrants.
Beryllium Industry Segmentation
-
1. Product Type
- 1.1. Alloys
- 1.2. Metals
- 1.3. Ceramics
- 1.4. Other Product Types
-
2. End-user Industry
- 2.1. Industrial Components
- 2.2. Automotive
- 2.3. Healthcare
- 2.4. Aerospace and Defense
- 2.5. Oil and Gas
- 2.6. Electronics and Telecommunication
- 2.7. Other End-user Industries
Beryllium Industry Segmentation By Geography
-
1. Asia Pacific
- 1.1. China
- 1.2. India
- 1.3. Japan
- 1.4. South Korea
- 1.5. Malaysia
- 1.6. Thailand
- 1.7. Indonesia
- 1.8. Vietnam
- 1.9. Rest of Asia Pacific
-
2. North America
- 2.1. United States
- 2.2. Canada
- 2.3. Mexico
-
3. Europe
- 3.1. Germany
- 3.2. United Kingdom
- 3.3. France
- 3.4. Italy
- 3.5. Spain
- 3.6. NORDIC Countries
- 3.7. Turkey
- 3.8. Russia
- 3.9. Rest of Europe
-
4. South America
- 4.1. Brazil
- 4.2. Argentina
- 4.3. Colombia
- 4.4. Rest of South America
-
5. Middle East and Africa
- 5.1. Saudi Arabia
- 5.2. Qatar
- 5.3. United Arab Emirates
- 5.4. Nigeria
- 5.5. Egypt
- 5.6. South Africa
- 5.7. Rest of Middle East and Africa
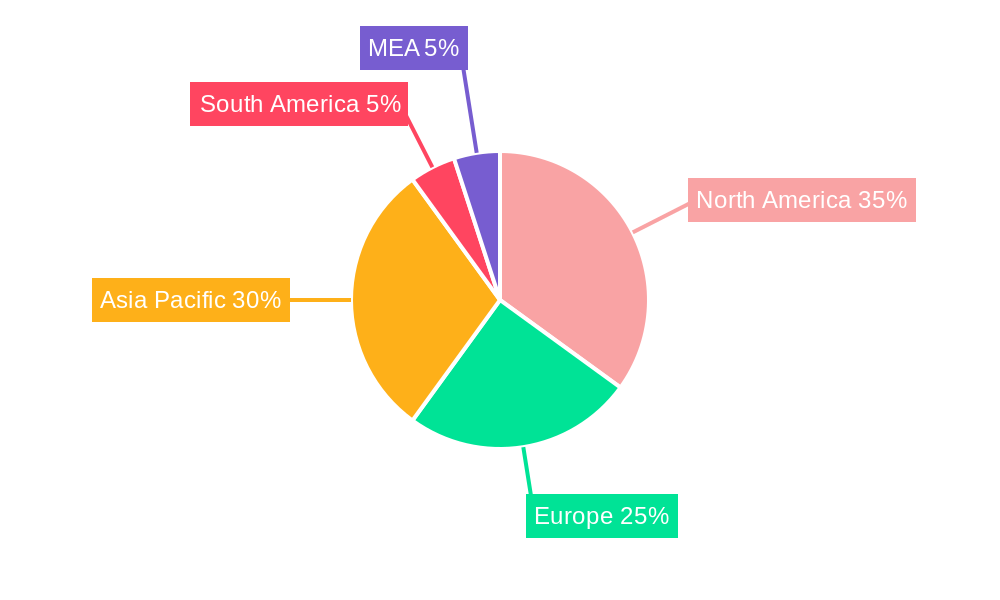
Beryllium Industry Regional Market Share
Geographic Coverage of Beryllium Industry
Beryllium Industry REPORT HIGHLIGHTS
| Aspects | Details |
|---|---|
| Study Period | 2020-2034 |
| Base Year | 2025 |
| Estimated Year | 2026 |
| Forecast Period | 2026-2034 |
| Historical Period | 2020-2025 |
| Growth Rate | CAGR of 6.8% from 2020-2034 |
| Segmentation |
|
Table of Contents
- 1. Introduction
- 1.1. Research Scope
- 1.2. Market Segmentation
- 1.3. Research Objective
- 1.4. Definitions and Assumptions
- 2. Executive Summary
- 2.1. Market Snapshot
- 3. Market Dynamics
- 3.1. Market Drivers
- 3.2. Market Restrains
- 3.3. Market Trends
- 3.4. Market Opportunities
- 4. Market Factor Analysis
- 4.1. Porters Five Forces
- 4.1.1. Bargaining Power of Suppliers
- 4.1.2. Bargaining Power of Buyers
- 4.1.3. Threat of New Entrants
- 4.1.4. Threat of Substitutes
- 4.1.5. Competitive Rivalry
- 4.2. PESTEL analysis
- 4.3. BCG Analysis
- 4.3.1. Stars (High Growth, High Market Share)
- 4.3.2. Cash Cows (Low Growth, High Market Share)
- 4.3.3. Question Mark (High Growth, Low Market Share)
- 4.3.4. Dogs (Low Growth, Low Market Share)
- 4.4. Ansoff Matrix Analysis
- 4.5. Supply Chain Analysis
- 4.6. Regulatory Landscape
- 4.7. Current Market Potential and Opportunity Assessment (TAM–SAM–SOM Framework)
- 4.8. PRI Analyst Note
- 4.1. Porters Five Forces
- 5. Market Analysis, Insights and Forecast 2021-2033
- 5.1. Market Analysis, Insights and Forecast - by Product Type
- 5.1.1. Alloys
- 5.1.2. Metals
- 5.1.3. Ceramics
- 5.1.4. Other Product Types
- 5.2. Market Analysis, Insights and Forecast - by End-user Industry
- 5.2.1. Industrial Components
- 5.2.2. Automotive
- 5.2.3. Healthcare
- 5.2.4. Aerospace and Defense
- 5.2.5. Oil and Gas
- 5.2.6. Electronics and Telecommunication
- 5.2.7. Other End-user Industries
- 5.3. Market Analysis, Insights and Forecast - by Region
- 5.3.1. Asia Pacific
- 5.3.2. North America
- 5.3.3. Europe
- 5.3.4. South America
- 5.3.5. Middle East and Africa
- 5.1. Market Analysis, Insights and Forecast - by Product Type
- 6. Global Beryllium Industry Analysis, Insights and Forecast, 2021-2033
- 6.1. Market Analysis, Insights and Forecast - by Product Type
- 6.1.1. Alloys
- 6.1.2. Metals
- 6.1.3. Ceramics
- 6.1.4. Other Product Types
- 6.2. Market Analysis, Insights and Forecast - by End-user Industry
- 6.2.1. Industrial Components
- 6.2.2. Automotive
- 6.2.3. Healthcare
- 6.2.4. Aerospace and Defense
- 6.2.5. Oil and Gas
- 6.2.6. Electronics and Telecommunication
- 6.2.7. Other End-user Industries
- 6.1. Market Analysis, Insights and Forecast - by Product Type
- 7. Asia Pacific Beryllium Industry Analysis, Insights and Forecast, 2020-2032
- 7.1. Market Analysis, Insights and Forecast - by Product Type
- 7.1.1. Alloys
- 7.1.2. Metals
- 7.1.3. Ceramics
- 7.1.4. Other Product Types
- 7.2. Market Analysis, Insights and Forecast - by End-user Industry
- 7.2.1. Industrial Components
- 7.2.2. Automotive
- 7.2.3. Healthcare
- 7.2.4. Aerospace and Defense
- 7.2.5. Oil and Gas
- 7.2.6. Electronics and Telecommunication
- 7.2.7. Other End-user Industries
- 7.1. Market Analysis, Insights and Forecast - by Product Type
- 8. North America Beryllium Industry Analysis, Insights and Forecast, 2020-2032
- 8.1. Market Analysis, Insights and Forecast - by Product Type
- 8.1.1. Alloys
- 8.1.2. Metals
- 8.1.3. Ceramics
- 8.1.4. Other Product Types
- 8.2. Market Analysis, Insights and Forecast - by End-user Industry
- 8.2.1. Industrial Components
- 8.2.2. Automotive
- 8.2.3. Healthcare
- 8.2.4. Aerospace and Defense
- 8.2.5. Oil and Gas
- 8.2.6. Electronics and Telecommunication
- 8.2.7. Other End-user Industries
- 8.1. Market Analysis, Insights and Forecast - by Product Type
- 9. Europe Beryllium Industry Analysis, Insights and Forecast, 2020-2032
- 9.1. Market Analysis, Insights and Forecast - by Product Type
- 9.1.1. Alloys
- 9.1.2. Metals
- 9.1.3. Ceramics
- 9.1.4. Other Product Types
- 9.2. Market Analysis, Insights and Forecast - by End-user Industry
- 9.2.1. Industrial Components
- 9.2.2. Automotive
- 9.2.3. Healthcare
- 9.2.4. Aerospace and Defense
- 9.2.5. Oil and Gas
- 9.2.6. Electronics and Telecommunication
- 9.2.7. Other End-user Industries
- 9.1. Market Analysis, Insights and Forecast - by Product Type
- 10. South America Beryllium Industry Analysis, Insights and Forecast, 2020-2032
- 10.1. Market Analysis, Insights and Forecast - by Product Type
- 10.1.1. Alloys
- 10.1.2. Metals
- 10.1.3. Ceramics
- 10.1.4. Other Product Types
- 10.2. Market Analysis, Insights and Forecast - by End-user Industry
- 10.2.1. Industrial Components
- 10.2.2. Automotive
- 10.2.3. Healthcare
- 10.2.4. Aerospace and Defense
- 10.2.5. Oil and Gas
- 10.2.6. Electronics and Telecommunication
- 10.2.7. Other End-user Industries
- 10.1. Market Analysis, Insights and Forecast - by Product Type
- 11. Middle East and Africa Beryllium Industry Analysis, Insights and Forecast, 2020-2032
- 11.1. Market Analysis, Insights and Forecast - by Product Type
- 11.1.1. Alloys
- 11.1.2. Metals
- 11.1.3. Ceramics
- 11.1.4. Other Product Types
- 11.2. Market Analysis, Insights and Forecast - by End-user Industry
- 11.2.1. Industrial Components
- 11.2.2. Automotive
- 11.2.3. Healthcare
- 11.2.4. Aerospace and Defense
- 11.2.5. Oil and Gas
- 11.2.6. Electronics and Telecommunication
- 11.2.7. Other End-user Industries
- 11.1. Market Analysis, Insights and Forecast - by Product Type
- 12. Competitive Analysis
- 12.1. Company Profiles
- 12.1.1 American Elements
- 12.1.1.1. Company Overview
- 12.1.1.2. Products
- 12.1.1.3. Company Financials
- 12.1.1.4. SWOT Analysis
- 12.1.2 Xiamen Beryllium Copper Technologies Co Ltd
- 12.1.2.1. Company Overview
- 12.1.2.2. Products
- 12.1.2.3. Company Financials
- 12.1.2.4. SWOT Analysis
- 12.1.3 NGK Metals
- 12.1.3.1. Company Overview
- 12.1.3.2. Products
- 12.1.3.3. Company Financials
- 12.1.3.4. SWOT Analysis
- 12.1.4 Hunan Shuikoushan Nonferrous Metals Group Co Ltd
- 12.1.4.1. Company Overview
- 12.1.4.2. Products
- 12.1.4.3. Company Financials
- 12.1.4.4. SWOT Analysis
- 12.1.5 Texas Mineral Resources Corp
- 12.1.5.1. Company Overview
- 12.1.5.2. Products
- 12.1.5.3. Company Financials
- 12.1.5.4. SWOT Analysis
- 12.1.6 Belmont Metals
- 12.1.6.1. Company Overview
- 12.1.6.2. Products
- 12.1.6.3. Company Financials
- 12.1.6.4. SWOT Analysis
- 12.1.7 Tropag Oscar H Ritter Nachf GmbH
- 12.1.7.1. Company Overview
- 12.1.7.2. Products
- 12.1.7.3. Company Financials
- 12.1.7.4. SWOT Analysis
- 12.1.8 National Atomic Company Kazatomprom
- 12.1.8.1. Company Overview
- 12.1.8.2. Products
- 12.1.8.3. Company Financials
- 12.1.8.4. SWOT Analysis
- 12.1.9 IBC Advanced Alloys
- 12.1.9.1. Company Overview
- 12.1.9.2. Products
- 12.1.9.3. Company Financials
- 12.1.9.4. SWOT Analysis
- 12.1.10 Materion Corporation
- 12.1.10.1. Company Overview
- 12.1.10.2. Products
- 12.1.10.3. Company Financials
- 12.1.10.4. SWOT Analysis
- 12.1.11 American Beryllia Inc
- 12.1.11.1. Company Overview
- 12.1.11.2. Products
- 12.1.11.3. Company Financials
- 12.1.11.4. SWOT Analysis
- 12.1.1 American Elements
- 12.2. Market Entropy
- 12.2.1 Company's Key Areas Served
- 12.2.2 Recent Developments
- 12.3. Company Market Share Analysis 2025
- 12.3.1 Top 5 Companies Market Share Analysis
- 12.3.2 Top 3 Companies Market Share Analysis
- 12.4. List of Potential Customers
- 13. Research Methodology
List of Figures
- Figure 1: Global Beryllium Industry Revenue Breakdown (million, %) by Region 2025 & 2033
- Figure 2: Global Beryllium Industry Volume Breakdown (K Tons, %) by Region 2025 & 2033
- Figure 3: Asia Pacific Beryllium Industry Revenue (million), by Product Type 2025 & 2033
- Figure 4: Asia Pacific Beryllium Industry Volume (K Tons), by Product Type 2025 & 2033
- Figure 5: Asia Pacific Beryllium Industry Revenue Share (%), by Product Type 2025 & 2033
- Figure 6: Asia Pacific Beryllium Industry Volume Share (%), by Product Type 2025 & 2033
- Figure 7: Asia Pacific Beryllium Industry Revenue (million), by End-user Industry 2025 & 2033
- Figure 8: Asia Pacific Beryllium Industry Volume (K Tons), by End-user Industry 2025 & 2033
- Figure 9: Asia Pacific Beryllium Industry Revenue Share (%), by End-user Industry 2025 & 2033
- Figure 10: Asia Pacific Beryllium Industry Volume Share (%), by End-user Industry 2025 & 2033
- Figure 11: Asia Pacific Beryllium Industry Revenue (million), by Country 2025 & 2033
- Figure 12: Asia Pacific Beryllium Industry Volume (K Tons), by Country 2025 & 2033
- Figure 13: Asia Pacific Beryllium Industry Revenue Share (%), by Country 2025 & 2033
- Figure 14: Asia Pacific Beryllium Industry Volume Share (%), by Country 2025 & 2033
- Figure 15: North America Beryllium Industry Revenue (million), by Product Type 2025 & 2033
- Figure 16: North America Beryllium Industry Volume (K Tons), by Product Type 2025 & 2033
- Figure 17: North America Beryllium Industry Revenue Share (%), by Product Type 2025 & 2033
- Figure 18: North America Beryllium Industry Volume Share (%), by Product Type 2025 & 2033
- Figure 19: North America Beryllium Industry Revenue (million), by End-user Industry 2025 & 2033
- Figure 20: North America Beryllium Industry Volume (K Tons), by End-user Industry 2025 & 2033
- Figure 21: North America Beryllium Industry Revenue Share (%), by End-user Industry 2025 & 2033
- Figure 22: North America Beryllium Industry Volume Share (%), by End-user Industry 2025 & 2033
- Figure 23: North America Beryllium Industry Revenue (million), by Country 2025 & 2033
- Figure 24: North America Beryllium Industry Volume (K Tons), by Country 2025 & 2033
- Figure 25: North America Beryllium Industry Revenue Share (%), by Country 2025 & 2033
- Figure 26: North America Beryllium Industry Volume Share (%), by Country 2025 & 2033
- Figure 27: Europe Beryllium Industry Revenue (million), by Product Type 2025 & 2033
- Figure 28: Europe Beryllium Industry Volume (K Tons), by Product Type 2025 & 2033
- Figure 29: Europe Beryllium Industry Revenue Share (%), by Product Type 2025 & 2033
- Figure 30: Europe Beryllium Industry Volume Share (%), by Product Type 2025 & 2033
- Figure 31: Europe Beryllium Industry Revenue (million), by End-user Industry 2025 & 2033
- Figure 32: Europe Beryllium Industry Volume (K Tons), by End-user Industry 2025 & 2033
- Figure 33: Europe Beryllium Industry Revenue Share (%), by End-user Industry 2025 & 2033
- Figure 34: Europe Beryllium Industry Volume Share (%), by End-user Industry 2025 & 2033
- Figure 35: Europe Beryllium Industry Revenue (million), by Country 2025 & 2033
- Figure 36: Europe Beryllium Industry Volume (K Tons), by Country 2025 & 2033
- Figure 37: Europe Beryllium Industry Revenue Share (%), by Country 2025 & 2033
- Figure 38: Europe Beryllium Industry Volume Share (%), by Country 2025 & 2033
- Figure 39: South America Beryllium Industry Revenue (million), by Product Type 2025 & 2033
- Figure 40: South America Beryllium Industry Volume (K Tons), by Product Type 2025 & 2033
- Figure 41: South America Beryllium Industry Revenue Share (%), by Product Type 2025 & 2033
- Figure 42: South America Beryllium Industry Volume Share (%), by Product Type 2025 & 2033
- Figure 43: South America Beryllium Industry Revenue (million), by End-user Industry 2025 & 2033
- Figure 44: South America Beryllium Industry Volume (K Tons), by End-user Industry 2025 & 2033
- Figure 45: South America Beryllium Industry Revenue Share (%), by End-user Industry 2025 & 2033
- Figure 46: South America Beryllium Industry Volume Share (%), by End-user Industry 2025 & 2033
- Figure 47: South America Beryllium Industry Revenue (million), by Country 2025 & 2033
- Figure 48: South America Beryllium Industry Volume (K Tons), by Country 2025 & 2033
- Figure 49: South America Beryllium Industry Revenue Share (%), by Country 2025 & 2033
- Figure 50: South America Beryllium Industry Volume Share (%), by Country 2025 & 2033
- Figure 51: Middle East and Africa Beryllium Industry Revenue (million), by Product Type 2025 & 2033
- Figure 52: Middle East and Africa Beryllium Industry Volume (K Tons), by Product Type 2025 & 2033
- Figure 53: Middle East and Africa Beryllium Industry Revenue Share (%), by Product Type 2025 & 2033
- Figure 54: Middle East and Africa Beryllium Industry Volume Share (%), by Product Type 2025 & 2033
- Figure 55: Middle East and Africa Beryllium Industry Revenue (million), by End-user Industry 2025 & 2033
- Figure 56: Middle East and Africa Beryllium Industry Volume (K Tons), by End-user Industry 2025 & 2033
- Figure 57: Middle East and Africa Beryllium Industry Revenue Share (%), by End-user Industry 2025 & 2033
- Figure 58: Middle East and Africa Beryllium Industry Volume Share (%), by End-user Industry 2025 & 2033
- Figure 59: Middle East and Africa Beryllium Industry Revenue (million), by Country 2025 & 2033
- Figure 60: Middle East and Africa Beryllium Industry Volume (K Tons), by Country 2025 & 2033
- Figure 61: Middle East and Africa Beryllium Industry Revenue Share (%), by Country 2025 & 2033
- Figure 62: Middle East and Africa Beryllium Industry Volume Share (%), by Country 2025 & 2033
List of Tables
- Table 1: Global Beryllium Industry Revenue million Forecast, by Product Type 2020 & 2033
- Table 2: Global Beryllium Industry Volume K Tons Forecast, by Product Type 2020 & 2033
- Table 3: Global Beryllium Industry Revenue million Forecast, by End-user Industry 2020 & 2033
- Table 4: Global Beryllium Industry Volume K Tons Forecast, by End-user Industry 2020 & 2033
- Table 5: Global Beryllium Industry Revenue million Forecast, by Region 2020 & 2033
- Table 6: Global Beryllium Industry Volume K Tons Forecast, by Region 2020 & 2033
- Table 7: Global Beryllium Industry Revenue million Forecast, by Product Type 2020 & 2033
- Table 8: Global Beryllium Industry Volume K Tons Forecast, by Product Type 2020 & 2033
- Table 9: Global Beryllium Industry Revenue million Forecast, by End-user Industry 2020 & 2033
- Table 10: Global Beryllium Industry Volume K Tons Forecast, by End-user Industry 2020 & 2033
- Table 11: Global Beryllium Industry Revenue million Forecast, by Country 2020 & 2033
- Table 12: Global Beryllium Industry Volume K Tons Forecast, by Country 2020 & 2033
- Table 13: China Beryllium Industry Revenue (million) Forecast, by Application 2020 & 2033
- Table 14: China Beryllium Industry Volume (K Tons) Forecast, by Application 2020 & 2033
- Table 15: India Beryllium Industry Revenue (million) Forecast, by Application 2020 & 2033
- Table 16: India Beryllium Industry Volume (K Tons) Forecast, by Application 2020 & 2033
- Table 17: Japan Beryllium Industry Revenue (million) Forecast, by Application 2020 & 2033
- Table 18: Japan Beryllium Industry Volume (K Tons) Forecast, by Application 2020 & 2033
- Table 19: South Korea Beryllium Industry Revenue (million) Forecast, by Application 2020 & 2033
- Table 20: South Korea Beryllium Industry Volume (K Tons) Forecast, by Application 2020 & 2033
- Table 21: Malaysia Beryllium Industry Revenue (million) Forecast, by Application 2020 & 2033
- Table 22: Malaysia Beryllium Industry Volume (K Tons) Forecast, by Application 2020 & 2033
- Table 23: Thailand Beryllium Industry Revenue (million) Forecast, by Application 2020 & 2033
- Table 24: Thailand Beryllium Industry Volume (K Tons) Forecast, by Application 2020 & 2033
- Table 25: Indonesia Beryllium Industry Revenue (million) Forecast, by Application 2020 & 2033
- Table 26: Indonesia Beryllium Industry Volume (K Tons) Forecast, by Application 2020 & 2033
- Table 27: Vietnam Beryllium Industry Revenue (million) Forecast, by Application 2020 & 2033
- Table 28: Vietnam Beryllium Industry Volume (K Tons) Forecast, by Application 2020 & 2033
- Table 29: Rest of Asia Pacific Beryllium Industry Revenue (million) Forecast, by Application 2020 & 2033
- Table 30: Rest of Asia Pacific Beryllium Industry Volume (K Tons) Forecast, by Application 2020 & 2033
- Table 31: Global Beryllium Industry Revenue million Forecast, by Product Type 2020 & 2033
- Table 32: Global Beryllium Industry Volume K Tons Forecast, by Product Type 2020 & 2033
- Table 33: Global Beryllium Industry Revenue million Forecast, by End-user Industry 2020 & 2033
- Table 34: Global Beryllium Industry Volume K Tons Forecast, by End-user Industry 2020 & 2033
- Table 35: Global Beryllium Industry Revenue million Forecast, by Country 2020 & 2033
- Table 36: Global Beryllium Industry Volume K Tons Forecast, by Country 2020 & 2033
- Table 37: United States Beryllium Industry Revenue (million) Forecast, by Application 2020 & 2033
- Table 38: United States Beryllium Industry Volume (K Tons) Forecast, by Application 2020 & 2033
- Table 39: Canada Beryllium Industry Revenue (million) Forecast, by Application 2020 & 2033
- Table 40: Canada Beryllium Industry Volume (K Tons) Forecast, by Application 2020 & 2033
- Table 41: Mexico Beryllium Industry Revenue (million) Forecast, by Application 2020 & 2033
- Table 42: Mexico Beryllium Industry Volume (K Tons) Forecast, by Application 2020 & 2033
- Table 43: Global Beryllium Industry Revenue million Forecast, by Product Type 2020 & 2033
- Table 44: Global Beryllium Industry Volume K Tons Forecast, by Product Type 2020 & 2033
- Table 45: Global Beryllium Industry Revenue million Forecast, by End-user Industry 2020 & 2033
- Table 46: Global Beryllium Industry Volume K Tons Forecast, by End-user Industry 2020 & 2033
- Table 47: Global Beryllium Industry Revenue million Forecast, by Country 2020 & 2033
- Table 48: Global Beryllium Industry Volume K Tons Forecast, by Country 2020 & 2033
- Table 49: Germany Beryllium Industry Revenue (million) Forecast, by Application 2020 & 2033
- Table 50: Germany Beryllium Industry Volume (K Tons) Forecast, by Application 2020 & 2033
- Table 51: United Kingdom Beryllium Industry Revenue (million) Forecast, by Application 2020 & 2033
- Table 52: United Kingdom Beryllium Industry Volume (K Tons) Forecast, by Application 2020 & 2033
- Table 53: France Beryllium Industry Revenue (million) Forecast, by Application 2020 & 2033
- Table 54: France Beryllium Industry Volume (K Tons) Forecast, by Application 2020 & 2033
- Table 55: Italy Beryllium Industry Revenue (million) Forecast, by Application 2020 & 2033
- Table 56: Italy Beryllium Industry Volume (K Tons) Forecast, by Application 2020 & 2033
- Table 57: Spain Beryllium Industry Revenue (million) Forecast, by Application 2020 & 2033
- Table 58: Spain Beryllium Industry Volume (K Tons) Forecast, by Application 2020 & 2033
- Table 59: NORDIC Countries Beryllium Industry Revenue (million) Forecast, by Application 2020 & 2033
- Table 60: NORDIC Countries Beryllium Industry Volume (K Tons) Forecast, by Application 2020 & 2033
- Table 61: Turkey Beryllium Industry Revenue (million) Forecast, by Application 2020 & 2033
- Table 62: Turkey Beryllium Industry Volume (K Tons) Forecast, by Application 2020 & 2033
- Table 63: Russia Beryllium Industry Revenue (million) Forecast, by Application 2020 & 2033
- Table 64: Russia Beryllium Industry Volume (K Tons) Forecast, by Application 2020 & 2033
- Table 65: Rest of Europe Beryllium Industry Revenue (million) Forecast, by Application 2020 & 2033
- Table 66: Rest of Europe Beryllium Industry Volume (K Tons) Forecast, by Application 2020 & 2033
- Table 67: Global Beryllium Industry Revenue million Forecast, by Product Type 2020 & 2033
- Table 68: Global Beryllium Industry Volume K Tons Forecast, by Product Type 2020 & 2033
- Table 69: Global Beryllium Industry Revenue million Forecast, by End-user Industry 2020 & 2033
- Table 70: Global Beryllium Industry Volume K Tons Forecast, by End-user Industry 2020 & 2033
- Table 71: Global Beryllium Industry Revenue million Forecast, by Country 2020 & 2033
- Table 72: Global Beryllium Industry Volume K Tons Forecast, by Country 2020 & 2033
- Table 73: Brazil Beryllium Industry Revenue (million) Forecast, by Application 2020 & 2033
- Table 74: Brazil Beryllium Industry Volume (K Tons) Forecast, by Application 2020 & 2033
- Table 75: Argentina Beryllium Industry Revenue (million) Forecast, by Application 2020 & 2033
- Table 76: Argentina Beryllium Industry Volume (K Tons) Forecast, by Application 2020 & 2033
- Table 77: Colombia Beryllium Industry Revenue (million) Forecast, by Application 2020 & 2033
- Table 78: Colombia Beryllium Industry Volume (K Tons) Forecast, by Application 2020 & 2033
- Table 79: Rest of South America Beryllium Industry Revenue (million) Forecast, by Application 2020 & 2033
- Table 80: Rest of South America Beryllium Industry Volume (K Tons) Forecast, by Application 2020 & 2033
- Table 81: Global Beryllium Industry Revenue million Forecast, by Product Type 2020 & 2033
- Table 82: Global Beryllium Industry Volume K Tons Forecast, by Product Type 2020 & 2033
- Table 83: Global Beryllium Industry Revenue million Forecast, by End-user Industry 2020 & 2033
- Table 84: Global Beryllium Industry Volume K Tons Forecast, by End-user Industry 2020 & 2033
- Table 85: Global Beryllium Industry Revenue million Forecast, by Country 2020 & 2033
- Table 86: Global Beryllium Industry Volume K Tons Forecast, by Country 2020 & 2033
- Table 87: Saudi Arabia Beryllium Industry Revenue (million) Forecast, by Application 2020 & 2033
- Table 88: Saudi Arabia Beryllium Industry Volume (K Tons) Forecast, by Application 2020 & 2033
- Table 89: Qatar Beryllium Industry Revenue (million) Forecast, by Application 2020 & 2033
- Table 90: Qatar Beryllium Industry Volume (K Tons) Forecast, by Application 2020 & 2033
- Table 91: United Arab Emirates Beryllium Industry Revenue (million) Forecast, by Application 2020 & 2033
- Table 92: United Arab Emirates Beryllium Industry Volume (K Tons) Forecast, by Application 2020 & 2033
- Table 93: Nigeria Beryllium Industry Revenue (million) Forecast, by Application 2020 & 2033
- Table 94: Nigeria Beryllium Industry Volume (K Tons) Forecast, by Application 2020 & 2033
- Table 95: Egypt Beryllium Industry Revenue (million) Forecast, by Application 2020 & 2033
- Table 96: Egypt Beryllium Industry Volume (K Tons) Forecast, by Application 2020 & 2033
- Table 97: South Africa Beryllium Industry Revenue (million) Forecast, by Application 2020 & 2033
- Table 98: South Africa Beryllium Industry Volume (K Tons) Forecast, by Application 2020 & 2033
- Table 99: Rest of Middle East and Africa Beryllium Industry Revenue (million) Forecast, by Application 2020 & 2033
- Table 100: Rest of Middle East and Africa Beryllium Industry Volume (K Tons) Forecast, by Application 2020 & 2033
Frequently Asked Questions
1. What is the projected Compound Annual Growth Rate (CAGR) of the Beryllium Industry?
The projected CAGR is approximately 6.8%.
2. Which companies are prominent players in the Beryllium Industry?
Key companies in the market include American Elements, Xiamen Beryllium Copper Technologies Co Ltd , NGK Metals, Hunan Shuikoushan Nonferrous Metals Group Co Ltd, Texas Mineral Resources Corp, Belmont Metals, Tropag Oscar H Ritter Nachf GmbH, National Atomic Company Kazatomprom, IBC Advanced Alloys, Materion Corporation, American Beryllia Inc.
3. What are the main segments of the Beryllium Industry?
The market segments include Product Type, End-user Industry.
4. Can you provide details about the market size?
The market size is estimated to be USD 231.5 million as of 2022.
5. What are some drivers contributing to market growth?
Extensive Usage of Beryllium Alloys in Aerospace and Military Applications; Increasing Usage in Medical Equipment Owing to its Superior Properties.
6. What are the notable trends driving market growth?
Automotive Segment to Drive the Market Growth.
7. Are there any restraints impacting market growth?
Competition from Potential Alternatives.
8. Can you provide examples of recent developments in the market?
July 2022: Materion Corporation jointly commissioned a Molten Salt Purification Plant (MSPP) with Kairos Power at Materion's location in Elmore, Ohio, for the commercial production of Flibe, a molten salt coolant used in nuclear energy production. Materion is the only domestic supplier of the beryllium fluoride component for Flibe, a key component of this energy solution.
9. What pricing options are available for accessing the report?
Pricing options include single-user, multi-user, and enterprise licenses priced at USD 4750, USD 5250, and USD 8750 respectively.
10. Is the market size provided in terms of value or volume?
The market size is provided in terms of value, measured in million and volume, measured in K Tons.
11. Are there any specific market keywords associated with the report?
Yes, the market keyword associated with the report is "Beryllium Industry," which aids in identifying and referencing the specific market segment covered.
12. How do I determine which pricing option suits my needs best?
The pricing options vary based on user requirements and access needs. Individual users may opt for single-user licenses, while businesses requiring broader access may choose multi-user or enterprise licenses for cost-effective access to the report.
13. Are there any additional resources or data provided in the Beryllium Industry report?
While the report offers comprehensive insights, it's advisable to review the specific contents or supplementary materials provided to ascertain if additional resources or data are available.
14. How can I stay updated on further developments or reports in the Beryllium Industry?
To stay informed about further developments, trends, and reports in the Beryllium Industry, consider subscribing to industry newsletters, following relevant companies and organizations, or regularly checking reputable industry news sources and publications.
Methodology
Step 1 - Identification of Relevant Samples Size from Population Database


Step 2 - Approaches for Defining Global Market Size (Value, Volume* & Price*)

Note*: In applicable scenarios
Step 3 - Data Sources
Primary Research
- Web Analytics
- Survey Reports
- Research Institute
- Latest Research Reports
- Opinion Leaders
Secondary Research
- Annual Reports
- White Paper
- Latest Press Release
- Industry Association
- Paid Database
- Investor Presentations

Step 4 - Data Triangulation
Involves using different sources of information in order to increase the validity of a study
These sources are likely to be stakeholders in a program - participants, other researchers, program staff, other community members, and so on.
Then we put all data in single framework & apply various statistical tools to find out the dynamic on the market.
During the analysis stage, feedback from the stakeholder groups would be compared to determine areas of agreement as well as areas of divergence