

Key Insights
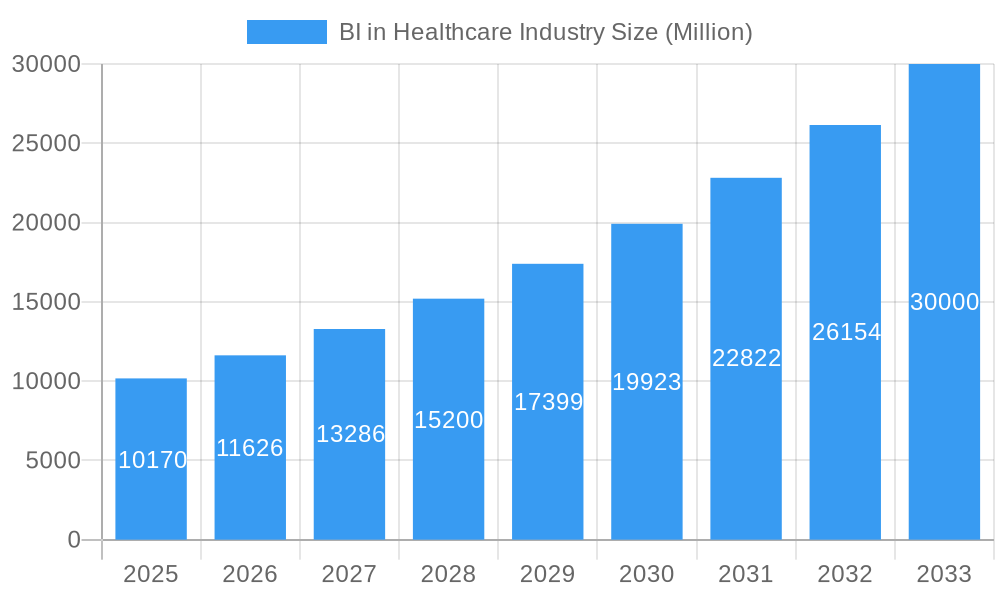
The Business Intelligence (BI) in Healthcare market is experiencing robust growth, projected to reach $10.17 billion in 2025 and exhibiting a Compound Annual Growth Rate (CAGR) of 14.41% from 2025 to 2033. This expansion is driven by several key factors. The increasing need for data-driven decision-making within healthcare organizations, fueled by the rising volume of patient data and the imperative for improved operational efficiency, is a primary driver. Furthermore, advancements in cloud computing, big data analytics, and artificial intelligence (AI) are enabling the development of sophisticated BI solutions that offer valuable insights into patient care, financial performance, and operational bottlenecks. The shift towards value-based care models further incentivizes the adoption of BI tools to track and improve key performance indicators (KPIs) related to patient outcomes and cost management. The market's segmentation reveals strong demand across various components (software and services), delivery modes (cloud-based, on-premise, and hybrid), applications (financial, clinical, and patient care analysis), and end-users (payers and providers). North America currently holds a significant market share, driven by early adoption and advanced technological infrastructure, but growth in Asia-Pacific and other regions is expected to accelerate in the coming years due to increasing healthcare investments and digital transformation initiatives.
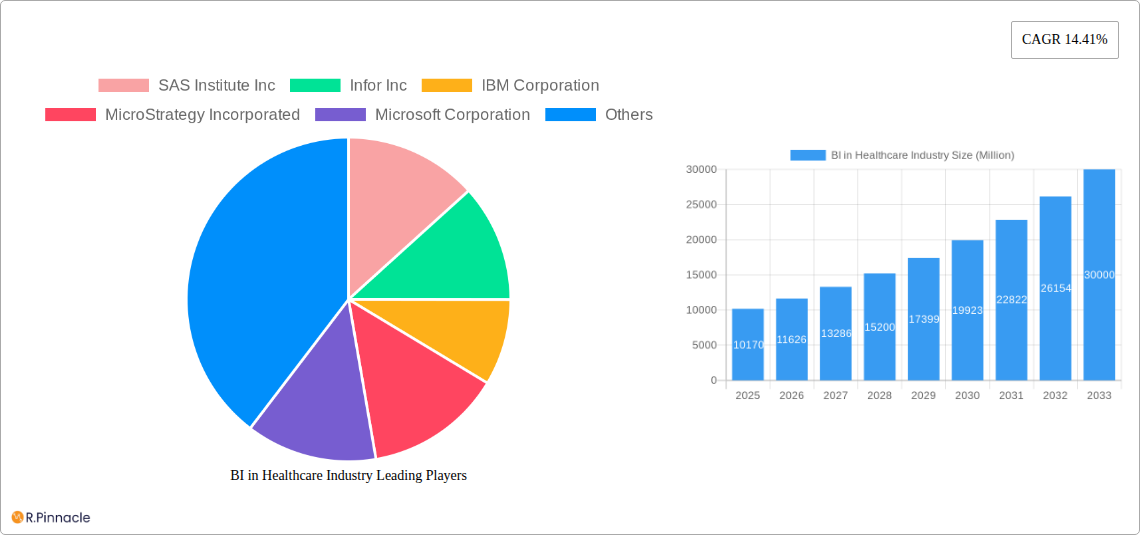
BI in Healthcare Industry Market Size (In Billion)
The competitive landscape is populated by a mix of established players like SAS, IBM, and Microsoft, alongside specialized healthcare BI providers such as CareCloud and Epic Systems. This competition fuels innovation and drives down costs, making BI solutions more accessible to a wider range of healthcare organizations. However, challenges remain, including data security concerns, the need for robust data integration capabilities, and the complexity of implementing and maintaining BI systems. Overcoming these hurdles through industry collaboration, regulatory compliance, and user-friendly interfaces will be crucial for continued market growth and the successful adoption of BI in transforming healthcare delivery. Future growth will be significantly influenced by the increasing adoption of AI-powered analytics, the integration of wearable health technologies, and the development of interoperable data exchange standards.
BI in Healthcare Industry Company Market Share
BI in Healthcare Industry Market Report: 2019-2033
This comprehensive report provides a detailed analysis of the Business Intelligence (BI) market in the healthcare industry, projecting a robust growth trajectory. Valued at $XX Million in 2025, the market is poised to reach $XX Million by 2033, exhibiting a CAGR of XX% during the forecast period (2025-2033). This report covers the historical period (2019-2024), with 2025 serving as the base year and the study period spanning 2019-2033. It offers invaluable insights for healthcare providers, payers, technology vendors, and investors seeking to navigate this dynamic market.
BI in Healthcare Industry Market Structure & Innovation Trends
The healthcare BI market exhibits moderate concentration, with key players like SAS Institute Inc, Infor Inc, IBM Corporation, MicroStrategy Incorporated, and Microsoft Corporation holding significant market share. However, several niche players and startups are also contributing to innovation. Market share is dynamically changing due to ongoing mergers and acquisitions (M&A) activity. For example, Oracle Corporation's acquisition of Cerner Corporation (June 2022) significantly altered the competitive landscape, potentially valuing over $XX Million.
Innovation is driven by increasing demand for data-driven decision-making, improving patient outcomes, reducing costs, and complying with regulatory frameworks like HIPAA. Product substitutes, such as basic reporting tools and spreadsheets, are being replaced by sophisticated BI solutions offering advanced analytics and visualization capabilities. End-user demographics are shifting towards a greater adoption of cloud-based solutions, especially among smaller healthcare providers.
- Market Concentration: Moderately concentrated, with top 5 players holding approximately XX% market share in 2025.
- M&A Activity: Significant activity observed, with deals valued at over $XX Million in the past few years. Oracle's acquisition of Cerner is a prime example.
- Regulatory Frameworks: HIPAA compliance is a crucial driver of BI adoption.
- Innovation Drivers: Demand for data-driven decision-making, cost reduction, improved patient outcomes.
BI in Healthcare Industry Market Dynamics & Trends
The healthcare BI market is experiencing substantial growth, driven by several key factors. The rising volume of healthcare data, coupled with the need for advanced analytics to extract meaningful insights, is a major driver. Technological disruptions, such as the rise of cloud computing, AI, and machine learning, are transforming the capabilities of BI solutions. Consumer preferences are shifting towards personalized and proactive healthcare, requiring more sophisticated data analysis. Furthermore, competitive dynamics are pushing vendors to continually innovate and offer more comprehensive and user-friendly solutions.
Market penetration is increasing, particularly in developed countries with advanced healthcare infrastructure. The market is witnessing a shift from on-premise to cloud-based BI deployments, driven by scalability, cost-effectiveness, and accessibility. The CAGR for the forecast period is estimated at XX%, indicating substantial growth potential.
Dominant Regions & Segments in BI in Healthcare Industry
The North American region dominates the healthcare BI market, driven by high healthcare expenditure, advanced healthcare infrastructure, and early adoption of advanced technologies. Within the segments:
- By Component: The software segment holds the largest market share due to the high demand for sophisticated analytics and visualization tools. The services segment is experiencing significant growth, driven by the need for implementation, customization, and ongoing support.
- By Mode of Delivery: Cloud-based models are witnessing the fastest growth, driven by scalability, accessibility, and cost-effectiveness. However, on-premise deployments still hold significant market share in larger healthcare organizations.
- By Application: Clinical data analysis is the largest application segment, followed by financial analysis and patient care analysis.
- By End User: Healthcare providers constitute the largest end-user segment, followed by payers.
Key Drivers:
- North America: High healthcare expenditure, advanced infrastructure, early technology adoption.
- Cloud-based Models: Scalability, cost-effectiveness, accessibility.
- Clinical Data Analysis: Growing demand for improved patient outcomes and operational efficiency.
BI in Healthcare Industry Product Innovations
Recent product innovations focus on enhancing the usability, scalability, and analytical capabilities of BI solutions. The integration of AI and machine learning is enabling predictive analytics, helping healthcare providers to anticipate and address potential issues proactively. Cloud-based solutions are becoming increasingly sophisticated, offering features like self-service analytics and mobile accessibility. These innovations are improving market fit by addressing the specific needs of diverse healthcare stakeholders, enabling better decision-making, and improving overall healthcare efficiency.
Report Scope & Segmentation Analysis
This report provides a detailed segmentation analysis of the healthcare BI market, broken down by component (software, services), mode of delivery (on-premise, hybrid, cloud-based), application (financial, clinical, patient care, other), and end-user (payers, providers, other). Each segment's growth projections, market sizes, and competitive dynamics are thoroughly analyzed. For instance, the cloud-based segment projects XX% growth, while the clinical data analysis application shows XX% growth. The competitive landscape within each segment is analyzed, considering factors such as market share, pricing strategies, and innovation levels.
Key Drivers of BI in Healthcare Industry Growth
Several factors are driving the growth of the healthcare BI market. Technological advancements, such as the development of sophisticated analytics tools and cloud-based platforms, are enabling more efficient data analysis and better decision-making. Economic factors, such as increasing healthcare expenditure and the need to optimize costs, are also driving adoption. Regulatory changes, such as the increasing emphasis on data privacy and security, are pushing healthcare organizations to implement robust BI solutions that comply with these regulations.
Challenges in the BI in Healthcare Industry Sector
The healthcare BI market faces several challenges. Data security and privacy concerns are paramount, requiring robust security measures to protect sensitive patient information. The complexity of healthcare data and the need for specialized expertise can hinder adoption, especially among smaller healthcare providers. The high cost of implementing and maintaining BI solutions can be a barrier for some organizations. Furthermore, integrating BI solutions with existing healthcare IT systems can be challenging and time-consuming. These challenges have resulted in a slower-than-expected adoption rate in certain segments, impacting the overall market growth by approximately XX% in 2024.
Emerging Opportunities in BI in Healthcare Industry
Emerging opportunities exist in areas such as predictive analytics, personalized medicine, and remote patient monitoring. The increasing availability of big data and the development of advanced analytics techniques are creating opportunities for new applications and services. The growing adoption of telehealth and remote healthcare is driving the need for BI solutions that can support remote patient care. These opportunities represent significant potential for growth in the coming years.
Leading Players in the BI in Healthcare Industry Market
- SAS Institute Inc
- Infor Inc
- IBM Corporation
- MicroStrategy Incorporated
- Microsoft Corporation
- CareCloud Inc
- EPIC SYSTEMS
- QlikTech International AB
- Information Builders
- Oracle Corporation
- Salesforce
- Sisense Inc
- Domo Inc
- SAP SE
Key Developments in BI in Healthcare Industry Industry
- June 2022: Oracle Corporation completed its acquisition of Cerner Corporation, significantly impacting the market consolidation and competitive landscape.
- January 2022: PINC AI launched INsights, a self-service healthcare analytics platform, expanding access to data-driven insights for healthcare providers.
- January 2022: CareCloud Inc. launched PrecisionBI Lite, extending the reach of its BI platform to smaller healthcare practices.
These developments highlight the ongoing innovation and consolidation within the healthcare BI market.
Future Outlook for BI in Healthcare Industry Market
The future outlook for the healthcare BI market is positive, driven by the continued growth of healthcare data, technological advancements, and increasing demand for data-driven decision-making. Opportunities exist in developing AI-powered predictive analytics, expanding the use of cloud-based solutions, and creating more user-friendly and accessible BI tools. Strategic partnerships between technology vendors and healthcare providers will be crucial for driving market growth and adoption. The market is expected to witness substantial growth over the next decade, driven by these key accelerators.
BI in Healthcare Industry Segmentation
-
1. Component
- 1.1. Software
- 1.2. Services
-
2. Mode of Delivery
- 2.1. On-premise Model
- 2.2. Hybrid Model
- 2.3. Cloud-based Model
-
3. Application
- 3.1. Financial Analysis
- 3.2. Clinical Data Analysis
- 3.3. Patient Care Analysis
- 3.4. Other Applications
-
4. End User
- 4.1. Payers
- 4.2. Healthcare Providers
- 4.3. Other End Users
BI in Healthcare Industry Segmentation By Geography
-
1. North America
- 1.1. United States
- 1.2. Canada
- 1.3. Mexico
-
2. Europe
- 2.1. Germany
- 2.2. United Kingdom
- 2.3. France
- 2.4. Italy
- 2.5. Spain
- 2.6. Rest of Europe
-
3. Asia Pacific
- 3.1. China
- 3.2. Japan
- 3.3. India
- 3.4. Australia
- 3.5. South Korea
- 3.6. Rest of Asia Pacific
-
4. Middle East and Africa
- 4.1. GCC
- 4.2. South Africa
- 4.3. Rest of Middle East and Africa
-
5. South America
- 5.1. Brazil
- 5.2. Argentina
- 5.3. Rest of South America
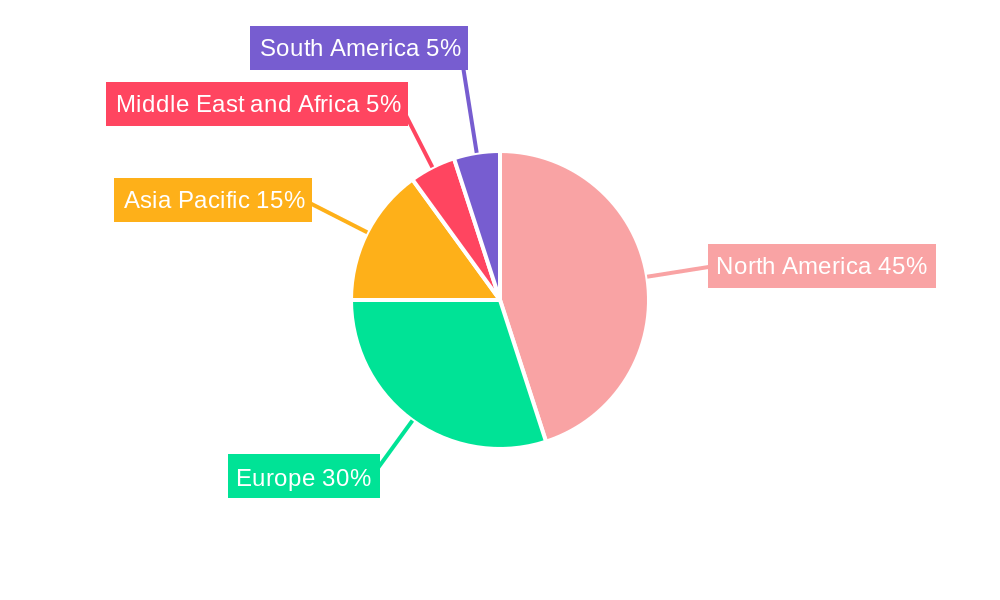
BI in Healthcare Industry Regional Market Share
Geographic Coverage of BI in Healthcare Industry
BI in Healthcare Industry REPORT HIGHLIGHTS
| Aspects | Details |
|---|---|
| Study Period | 2020-2034 |
| Base Year | 2025 |
| Estimated Year | 2026 |
| Forecast Period | 2026-2034 |
| Historical Period | 2020-2025 |
| Growth Rate | CAGR of 14.41% from 2020-2034 |
| Segmentation |
|
Table of Contents
- 1. Introduction
- 1.1. Research Scope
- 1.2. Market Segmentation
- 1.3. Research Objective
- 1.4. Definitions and Assumptions
- 2. Executive Summary
- 2.1. Market Snapshot
- 3. Market Dynamics
- 3.1. Market Drivers
- 3.2. Market Restrains
- 3.3. Market Trends
- 3.4. Market Opportunities
- 4. Market Factor Analysis
- 4.1. Porters Five Forces
- 4.1.1. Bargaining Power of Suppliers
- 4.1.2. Bargaining Power of Buyers
- 4.1.3. Threat of New Entrants
- 4.1.4. Threat of Substitutes
- 4.1.5. Competitive Rivalry
- 4.2. PESTEL analysis
- 4.3. BCG Analysis
- 4.3.1. Stars (High Growth, High Market Share)
- 4.3.2. Cash Cows (Low Growth, High Market Share)
- 4.3.3. Question Mark (High Growth, Low Market Share)
- 4.3.4. Dogs (Low Growth, Low Market Share)
- 4.4. Ansoff Matrix Analysis
- 4.5. Supply Chain Analysis
- 4.6. Regulatory Landscape
- 4.7. Current Market Potential and Opportunity Assessment (TAM–SAM–SOM Framework)
- 4.8. PRI Analyst Note
- 4.1. Porters Five Forces
- 5. Market Analysis, Insights and Forecast 2021-2033
- 5.1. Market Analysis, Insights and Forecast - by Component
- 5.1.1. Software
- 5.1.2. Services
- 5.2. Market Analysis, Insights and Forecast - by Mode of Delivery
- 5.2.1. On-premise Model
- 5.2.2. Hybrid Model
- 5.2.3. Cloud-based Model
- 5.3. Market Analysis, Insights and Forecast - by Application
- 5.3.1. Financial Analysis
- 5.3.2. Clinical Data Analysis
- 5.3.3. Patient Care Analysis
- 5.3.4. Other Applications
- 5.4. Market Analysis, Insights and Forecast - by End User
- 5.4.1. Payers
- 5.4.2. Healthcare Providers
- 5.4.3. Other End Users
- 5.5. Market Analysis, Insights and Forecast - by Region
- 5.5.1. North America
- 5.5.2. Europe
- 5.5.3. Asia Pacific
- 5.5.4. Middle East and Africa
- 5.5.5. South America
- 5.1. Market Analysis, Insights and Forecast - by Component
- 6. Global BI in Healthcare Industry Analysis, Insights and Forecast, 2021-2033
- 6.1. Market Analysis, Insights and Forecast - by Component
- 6.1.1. Software
- 6.1.2. Services
- 6.2. Market Analysis, Insights and Forecast - by Mode of Delivery
- 6.2.1. On-premise Model
- 6.2.2. Hybrid Model
- 6.2.3. Cloud-based Model
- 6.3. Market Analysis, Insights and Forecast - by Application
- 6.3.1. Financial Analysis
- 6.3.2. Clinical Data Analysis
- 6.3.3. Patient Care Analysis
- 6.3.4. Other Applications
- 6.4. Market Analysis, Insights and Forecast - by End User
- 6.4.1. Payers
- 6.4.2. Healthcare Providers
- 6.4.3. Other End Users
- 6.1. Market Analysis, Insights and Forecast - by Component
- 7. North America BI in Healthcare Industry Analysis, Insights and Forecast, 2020-2032
- 7.1. Market Analysis, Insights and Forecast - by Component
- 7.1.1. Software
- 7.1.2. Services
- 7.2. Market Analysis, Insights and Forecast - by Mode of Delivery
- 7.2.1. On-premise Model
- 7.2.2. Hybrid Model
- 7.2.3. Cloud-based Model
- 7.3. Market Analysis, Insights and Forecast - by Application
- 7.3.1. Financial Analysis
- 7.3.2. Clinical Data Analysis
- 7.3.3. Patient Care Analysis
- 7.3.4. Other Applications
- 7.4. Market Analysis, Insights and Forecast - by End User
- 7.4.1. Payers
- 7.4.2. Healthcare Providers
- 7.4.3. Other End Users
- 7.1. Market Analysis, Insights and Forecast - by Component
- 8. Europe BI in Healthcare Industry Analysis, Insights and Forecast, 2020-2032
- 8.1. Market Analysis, Insights and Forecast - by Component
- 8.1.1. Software
- 8.1.2. Services
- 8.2. Market Analysis, Insights and Forecast - by Mode of Delivery
- 8.2.1. On-premise Model
- 8.2.2. Hybrid Model
- 8.2.3. Cloud-based Model
- 8.3. Market Analysis, Insights and Forecast - by Application
- 8.3.1. Financial Analysis
- 8.3.2. Clinical Data Analysis
- 8.3.3. Patient Care Analysis
- 8.3.4. Other Applications
- 8.4. Market Analysis, Insights and Forecast - by End User
- 8.4.1. Payers
- 8.4.2. Healthcare Providers
- 8.4.3. Other End Users
- 8.1. Market Analysis, Insights and Forecast - by Component
- 9. Asia Pacific BI in Healthcare Industry Analysis, Insights and Forecast, 2020-2032
- 9.1. Market Analysis, Insights and Forecast - by Component
- 9.1.1. Software
- 9.1.2. Services
- 9.2. Market Analysis, Insights and Forecast - by Mode of Delivery
- 9.2.1. On-premise Model
- 9.2.2. Hybrid Model
- 9.2.3. Cloud-based Model
- 9.3. Market Analysis, Insights and Forecast - by Application
- 9.3.1. Financial Analysis
- 9.3.2. Clinical Data Analysis
- 9.3.3. Patient Care Analysis
- 9.3.4. Other Applications
- 9.4. Market Analysis, Insights and Forecast - by End User
- 9.4.1. Payers
- 9.4.2. Healthcare Providers
- 9.4.3. Other End Users
- 9.1. Market Analysis, Insights and Forecast - by Component
- 10. Middle East and Africa BI in Healthcare Industry Analysis, Insights and Forecast, 2020-2032
- 10.1. Market Analysis, Insights and Forecast - by Component
- 10.1.1. Software
- 10.1.2. Services
- 10.2. Market Analysis, Insights and Forecast - by Mode of Delivery
- 10.2.1. On-premise Model
- 10.2.2. Hybrid Model
- 10.2.3. Cloud-based Model
- 10.3. Market Analysis, Insights and Forecast - by Application
- 10.3.1. Financial Analysis
- 10.3.2. Clinical Data Analysis
- 10.3.3. Patient Care Analysis
- 10.3.4. Other Applications
- 10.4. Market Analysis, Insights and Forecast - by End User
- 10.4.1. Payers
- 10.4.2. Healthcare Providers
- 10.4.3. Other End Users
- 10.1. Market Analysis, Insights and Forecast - by Component
- 11. South America BI in Healthcare Industry Analysis, Insights and Forecast, 2020-2032
- 11.1. Market Analysis, Insights and Forecast - by Component
- 11.1.1. Software
- 11.1.2. Services
- 11.2. Market Analysis, Insights and Forecast - by Mode of Delivery
- 11.2.1. On-premise Model
- 11.2.2. Hybrid Model
- 11.2.3. Cloud-based Model
- 11.3. Market Analysis, Insights and Forecast - by Application
- 11.3.1. Financial Analysis
- 11.3.2. Clinical Data Analysis
- 11.3.3. Patient Care Analysis
- 11.3.4. Other Applications
- 11.4. Market Analysis, Insights and Forecast - by End User
- 11.4.1. Payers
- 11.4.2. Healthcare Providers
- 11.4.3. Other End Users
- 11.1. Market Analysis, Insights and Forecast - by Component
- 12. Competitive Analysis
- 12.1. Company Profiles
- 12.1.1 SAS Institute Inc
- 12.1.1.1. Company Overview
- 12.1.1.2. Products
- 12.1.1.3. Company Financials
- 12.1.1.4. SWOT Analysis
- 12.1.2 Infor Inc
- 12.1.2.1. Company Overview
- 12.1.2.2. Products
- 12.1.2.3. Company Financials
- 12.1.2.4. SWOT Analysis
- 12.1.3 IBM Corporation
- 12.1.3.1. Company Overview
- 12.1.3.2. Products
- 12.1.3.3. Company Financials
- 12.1.3.4. SWOT Analysis
- 12.1.4 MicroStrategy Incorporated
- 12.1.4.1. Company Overview
- 12.1.4.2. Products
- 12.1.4.3. Company Financials
- 12.1.4.4. SWOT Analysis
- 12.1.5 Microsoft Corporation
- 12.1.5.1. Company Overview
- 12.1.5.2. Products
- 12.1.5.3. Company Financials
- 12.1.5.4. SWOT Analysis
- 12.1.6 CareCloud Inc
- 12.1.6.1. Company Overview
- 12.1.6.2. Products
- 12.1.6.3. Company Financials
- 12.1.6.4. SWOT Analysis
- 12.1.7 EPIC SYSTEMS
- 12.1.7.1. Company Overview
- 12.1.7.2. Products
- 12.1.7.3. Company Financials
- 12.1.7.4. SWOT Analysis
- 12.1.8 QlikTech International AB
- 12.1.8.1. Company Overview
- 12.1.8.2. Products
- 12.1.8.3. Company Financials
- 12.1.8.4. SWOT Analysis
- 12.1.9 Information Builders
- 12.1.9.1. Company Overview
- 12.1.9.2. Products
- 12.1.9.3. Company Financials
- 12.1.9.4. SWOT Analysis
- 12.1.10 Oracle Corporation
- 12.1.10.1. Company Overview
- 12.1.10.2. Products
- 12.1.10.3. Company Financials
- 12.1.10.4. SWOT Analysis
- 12.1.11 Salesforce
- 12.1.11.1. Company Overview
- 12.1.11.2. Products
- 12.1.11.3. Company Financials
- 12.1.11.4. SWOT Analysis
- 12.1.12 Sisense Inc
- 12.1.12.1. Company Overview
- 12.1.12.2. Products
- 12.1.12.3. Company Financials
- 12.1.12.4. SWOT Analysis
- 12.1.13 Domo Inc
- 12.1.13.1. Company Overview
- 12.1.13.2. Products
- 12.1.13.3. Company Financials
- 12.1.13.4. SWOT Analysis
- 12.1.14 SAP SE
- 12.1.14.1. Company Overview
- 12.1.14.2. Products
- 12.1.14.3. Company Financials
- 12.1.14.4. SWOT Analysis
- 12.1.1 SAS Institute Inc
- 12.2. Market Entropy
- 12.2.1 Company's Key Areas Served
- 12.2.2 Recent Developments
- 12.3. Company Market Share Analysis 2025
- 12.3.1 Top 5 Companies Market Share Analysis
- 12.3.2 Top 3 Companies Market Share Analysis
- 12.4. List of Potential Customers
- 13. Research Methodology
List of Figures
- Figure 1: Global BI in Healthcare Industry Revenue Breakdown (Million, %) by Region 2025 & 2033
- Figure 2: Global BI in Healthcare Industry Volume Breakdown (K Unit, %) by Region 2025 & 2033
- Figure 3: North America BI in Healthcare Industry Revenue (Million), by Component 2025 & 2033
- Figure 4: North America BI in Healthcare Industry Volume (K Unit), by Component 2025 & 2033
- Figure 5: North America BI in Healthcare Industry Revenue Share (%), by Component 2025 & 2033
- Figure 6: North America BI in Healthcare Industry Volume Share (%), by Component 2025 & 2033
- Figure 7: North America BI in Healthcare Industry Revenue (Million), by Mode of Delivery 2025 & 2033
- Figure 8: North America BI in Healthcare Industry Volume (K Unit), by Mode of Delivery 2025 & 2033
- Figure 9: North America BI in Healthcare Industry Revenue Share (%), by Mode of Delivery 2025 & 2033
- Figure 10: North America BI in Healthcare Industry Volume Share (%), by Mode of Delivery 2025 & 2033
- Figure 11: North America BI in Healthcare Industry Revenue (Million), by Application 2025 & 2033
- Figure 12: North America BI in Healthcare Industry Volume (K Unit), by Application 2025 & 2033
- Figure 13: North America BI in Healthcare Industry Revenue Share (%), by Application 2025 & 2033
- Figure 14: North America BI in Healthcare Industry Volume Share (%), by Application 2025 & 2033
- Figure 15: North America BI in Healthcare Industry Revenue (Million), by End User 2025 & 2033
- Figure 16: North America BI in Healthcare Industry Volume (K Unit), by End User 2025 & 2033
- Figure 17: North America BI in Healthcare Industry Revenue Share (%), by End User 2025 & 2033
- Figure 18: North America BI in Healthcare Industry Volume Share (%), by End User 2025 & 2033
- Figure 19: North America BI in Healthcare Industry Revenue (Million), by Country 2025 & 2033
- Figure 20: North America BI in Healthcare Industry Volume (K Unit), by Country 2025 & 2033
- Figure 21: North America BI in Healthcare Industry Revenue Share (%), by Country 2025 & 2033
- Figure 22: North America BI in Healthcare Industry Volume Share (%), by Country 2025 & 2033
- Figure 23: Europe BI in Healthcare Industry Revenue (Million), by Component 2025 & 2033
- Figure 24: Europe BI in Healthcare Industry Volume (K Unit), by Component 2025 & 2033
- Figure 25: Europe BI in Healthcare Industry Revenue Share (%), by Component 2025 & 2033
- Figure 26: Europe BI in Healthcare Industry Volume Share (%), by Component 2025 & 2033
- Figure 27: Europe BI in Healthcare Industry Revenue (Million), by Mode of Delivery 2025 & 2033
- Figure 28: Europe BI in Healthcare Industry Volume (K Unit), by Mode of Delivery 2025 & 2033
- Figure 29: Europe BI in Healthcare Industry Revenue Share (%), by Mode of Delivery 2025 & 2033
- Figure 30: Europe BI in Healthcare Industry Volume Share (%), by Mode of Delivery 2025 & 2033
- Figure 31: Europe BI in Healthcare Industry Revenue (Million), by Application 2025 & 2033
- Figure 32: Europe BI in Healthcare Industry Volume (K Unit), by Application 2025 & 2033
- Figure 33: Europe BI in Healthcare Industry Revenue Share (%), by Application 2025 & 2033
- Figure 34: Europe BI in Healthcare Industry Volume Share (%), by Application 2025 & 2033
- Figure 35: Europe BI in Healthcare Industry Revenue (Million), by End User 2025 & 2033
- Figure 36: Europe BI in Healthcare Industry Volume (K Unit), by End User 2025 & 2033
- Figure 37: Europe BI in Healthcare Industry Revenue Share (%), by End User 2025 & 2033
- Figure 38: Europe BI in Healthcare Industry Volume Share (%), by End User 2025 & 2033
- Figure 39: Europe BI in Healthcare Industry Revenue (Million), by Country 2025 & 2033
- Figure 40: Europe BI in Healthcare Industry Volume (K Unit), by Country 2025 & 2033
- Figure 41: Europe BI in Healthcare Industry Revenue Share (%), by Country 2025 & 2033
- Figure 42: Europe BI in Healthcare Industry Volume Share (%), by Country 2025 & 2033
- Figure 43: Asia Pacific BI in Healthcare Industry Revenue (Million), by Component 2025 & 2033
- Figure 44: Asia Pacific BI in Healthcare Industry Volume (K Unit), by Component 2025 & 2033
- Figure 45: Asia Pacific BI in Healthcare Industry Revenue Share (%), by Component 2025 & 2033
- Figure 46: Asia Pacific BI in Healthcare Industry Volume Share (%), by Component 2025 & 2033
- Figure 47: Asia Pacific BI in Healthcare Industry Revenue (Million), by Mode of Delivery 2025 & 2033
- Figure 48: Asia Pacific BI in Healthcare Industry Volume (K Unit), by Mode of Delivery 2025 & 2033
- Figure 49: Asia Pacific BI in Healthcare Industry Revenue Share (%), by Mode of Delivery 2025 & 2033
- Figure 50: Asia Pacific BI in Healthcare Industry Volume Share (%), by Mode of Delivery 2025 & 2033
- Figure 51: Asia Pacific BI in Healthcare Industry Revenue (Million), by Application 2025 & 2033
- Figure 52: Asia Pacific BI in Healthcare Industry Volume (K Unit), by Application 2025 & 2033
- Figure 53: Asia Pacific BI in Healthcare Industry Revenue Share (%), by Application 2025 & 2033
- Figure 54: Asia Pacific BI in Healthcare Industry Volume Share (%), by Application 2025 & 2033
- Figure 55: Asia Pacific BI in Healthcare Industry Revenue (Million), by End User 2025 & 2033
- Figure 56: Asia Pacific BI in Healthcare Industry Volume (K Unit), by End User 2025 & 2033
- Figure 57: Asia Pacific BI in Healthcare Industry Revenue Share (%), by End User 2025 & 2033
- Figure 58: Asia Pacific BI in Healthcare Industry Volume Share (%), by End User 2025 & 2033
- Figure 59: Asia Pacific BI in Healthcare Industry Revenue (Million), by Country 2025 & 2033
- Figure 60: Asia Pacific BI in Healthcare Industry Volume (K Unit), by Country 2025 & 2033
- Figure 61: Asia Pacific BI in Healthcare Industry Revenue Share (%), by Country 2025 & 2033
- Figure 62: Asia Pacific BI in Healthcare Industry Volume Share (%), by Country 2025 & 2033
- Figure 63: Middle East and Africa BI in Healthcare Industry Revenue (Million), by Component 2025 & 2033
- Figure 64: Middle East and Africa BI in Healthcare Industry Volume (K Unit), by Component 2025 & 2033
- Figure 65: Middle East and Africa BI in Healthcare Industry Revenue Share (%), by Component 2025 & 2033
- Figure 66: Middle East and Africa BI in Healthcare Industry Volume Share (%), by Component 2025 & 2033
- Figure 67: Middle East and Africa BI in Healthcare Industry Revenue (Million), by Mode of Delivery 2025 & 2033
- Figure 68: Middle East and Africa BI in Healthcare Industry Volume (K Unit), by Mode of Delivery 2025 & 2033
- Figure 69: Middle East and Africa BI in Healthcare Industry Revenue Share (%), by Mode of Delivery 2025 & 2033
- Figure 70: Middle East and Africa BI in Healthcare Industry Volume Share (%), by Mode of Delivery 2025 & 2033
- Figure 71: Middle East and Africa BI in Healthcare Industry Revenue (Million), by Application 2025 & 2033
- Figure 72: Middle East and Africa BI in Healthcare Industry Volume (K Unit), by Application 2025 & 2033
- Figure 73: Middle East and Africa BI in Healthcare Industry Revenue Share (%), by Application 2025 & 2033
- Figure 74: Middle East and Africa BI in Healthcare Industry Volume Share (%), by Application 2025 & 2033
- Figure 75: Middle East and Africa BI in Healthcare Industry Revenue (Million), by End User 2025 & 2033
- Figure 76: Middle East and Africa BI in Healthcare Industry Volume (K Unit), by End User 2025 & 2033
- Figure 77: Middle East and Africa BI in Healthcare Industry Revenue Share (%), by End User 2025 & 2033
- Figure 78: Middle East and Africa BI in Healthcare Industry Volume Share (%), by End User 2025 & 2033
- Figure 79: Middle East and Africa BI in Healthcare Industry Revenue (Million), by Country 2025 & 2033
- Figure 80: Middle East and Africa BI in Healthcare Industry Volume (K Unit), by Country 2025 & 2033
- Figure 81: Middle East and Africa BI in Healthcare Industry Revenue Share (%), by Country 2025 & 2033
- Figure 82: Middle East and Africa BI in Healthcare Industry Volume Share (%), by Country 2025 & 2033
- Figure 83: South America BI in Healthcare Industry Revenue (Million), by Component 2025 & 2033
- Figure 84: South America BI in Healthcare Industry Volume (K Unit), by Component 2025 & 2033
- Figure 85: South America BI in Healthcare Industry Revenue Share (%), by Component 2025 & 2033
- Figure 86: South America BI in Healthcare Industry Volume Share (%), by Component 2025 & 2033
- Figure 87: South America BI in Healthcare Industry Revenue (Million), by Mode of Delivery 2025 & 2033
- Figure 88: South America BI in Healthcare Industry Volume (K Unit), by Mode of Delivery 2025 & 2033
- Figure 89: South America BI in Healthcare Industry Revenue Share (%), by Mode of Delivery 2025 & 2033
- Figure 90: South America BI in Healthcare Industry Volume Share (%), by Mode of Delivery 2025 & 2033
- Figure 91: South America BI in Healthcare Industry Revenue (Million), by Application 2025 & 2033
- Figure 92: South America BI in Healthcare Industry Volume (K Unit), by Application 2025 & 2033
- Figure 93: South America BI in Healthcare Industry Revenue Share (%), by Application 2025 & 2033
- Figure 94: South America BI in Healthcare Industry Volume Share (%), by Application 2025 & 2033
- Figure 95: South America BI in Healthcare Industry Revenue (Million), by End User 2025 & 2033
- Figure 96: South America BI in Healthcare Industry Volume (K Unit), by End User 2025 & 2033
- Figure 97: South America BI in Healthcare Industry Revenue Share (%), by End User 2025 & 2033
- Figure 98: South America BI in Healthcare Industry Volume Share (%), by End User 2025 & 2033
- Figure 99: South America BI in Healthcare Industry Revenue (Million), by Country 2025 & 2033
- Figure 100: South America BI in Healthcare Industry Volume (K Unit), by Country 2025 & 2033
- Figure 101: South America BI in Healthcare Industry Revenue Share (%), by Country 2025 & 2033
- Figure 102: South America BI in Healthcare Industry Volume Share (%), by Country 2025 & 2033
List of Tables
- Table 1: Global BI in Healthcare Industry Revenue Million Forecast, by Component 2020 & 2033
- Table 2: Global BI in Healthcare Industry Volume K Unit Forecast, by Component 2020 & 2033
- Table 3: Global BI in Healthcare Industry Revenue Million Forecast, by Mode of Delivery 2020 & 2033
- Table 4: Global BI in Healthcare Industry Volume K Unit Forecast, by Mode of Delivery 2020 & 2033
- Table 5: Global BI in Healthcare Industry Revenue Million Forecast, by Application 2020 & 2033
- Table 6: Global BI in Healthcare Industry Volume K Unit Forecast, by Application 2020 & 2033
- Table 7: Global BI in Healthcare Industry Revenue Million Forecast, by End User 2020 & 2033
- Table 8: Global BI in Healthcare Industry Volume K Unit Forecast, by End User 2020 & 2033
- Table 9: Global BI in Healthcare Industry Revenue Million Forecast, by Region 2020 & 2033
- Table 10: Global BI in Healthcare Industry Volume K Unit Forecast, by Region 2020 & 2033
- Table 11: Global BI in Healthcare Industry Revenue Million Forecast, by Component 2020 & 2033
- Table 12: Global BI in Healthcare Industry Volume K Unit Forecast, by Component 2020 & 2033
- Table 13: Global BI in Healthcare Industry Revenue Million Forecast, by Mode of Delivery 2020 & 2033
- Table 14: Global BI in Healthcare Industry Volume K Unit Forecast, by Mode of Delivery 2020 & 2033
- Table 15: Global BI in Healthcare Industry Revenue Million Forecast, by Application 2020 & 2033
- Table 16: Global BI in Healthcare Industry Volume K Unit Forecast, by Application 2020 & 2033
- Table 17: Global BI in Healthcare Industry Revenue Million Forecast, by End User 2020 & 2033
- Table 18: Global BI in Healthcare Industry Volume K Unit Forecast, by End User 2020 & 2033
- Table 19: Global BI in Healthcare Industry Revenue Million Forecast, by Country 2020 & 2033
- Table 20: Global BI in Healthcare Industry Volume K Unit Forecast, by Country 2020 & 2033
- Table 21: United States BI in Healthcare Industry Revenue (Million) Forecast, by Application 2020 & 2033
- Table 22: United States BI in Healthcare Industry Volume (K Unit) Forecast, by Application 2020 & 2033
- Table 23: Canada BI in Healthcare Industry Revenue (Million) Forecast, by Application 2020 & 2033
- Table 24: Canada BI in Healthcare Industry Volume (K Unit) Forecast, by Application 2020 & 2033
- Table 25: Mexico BI in Healthcare Industry Revenue (Million) Forecast, by Application 2020 & 2033
- Table 26: Mexico BI in Healthcare Industry Volume (K Unit) Forecast, by Application 2020 & 2033
- Table 27: Global BI in Healthcare Industry Revenue Million Forecast, by Component 2020 & 2033
- Table 28: Global BI in Healthcare Industry Volume K Unit Forecast, by Component 2020 & 2033
- Table 29: Global BI in Healthcare Industry Revenue Million Forecast, by Mode of Delivery 2020 & 2033
- Table 30: Global BI in Healthcare Industry Volume K Unit Forecast, by Mode of Delivery 2020 & 2033
- Table 31: Global BI in Healthcare Industry Revenue Million Forecast, by Application 2020 & 2033
- Table 32: Global BI in Healthcare Industry Volume K Unit Forecast, by Application 2020 & 2033
- Table 33: Global BI in Healthcare Industry Revenue Million Forecast, by End User 2020 & 2033
- Table 34: Global BI in Healthcare Industry Volume K Unit Forecast, by End User 2020 & 2033
- Table 35: Global BI in Healthcare Industry Revenue Million Forecast, by Country 2020 & 2033
- Table 36: Global BI in Healthcare Industry Volume K Unit Forecast, by Country 2020 & 2033
- Table 37: Germany BI in Healthcare Industry Revenue (Million) Forecast, by Application 2020 & 2033
- Table 38: Germany BI in Healthcare Industry Volume (K Unit) Forecast, by Application 2020 & 2033
- Table 39: United Kingdom BI in Healthcare Industry Revenue (Million) Forecast, by Application 2020 & 2033
- Table 40: United Kingdom BI in Healthcare Industry Volume (K Unit) Forecast, by Application 2020 & 2033
- Table 41: France BI in Healthcare Industry Revenue (Million) Forecast, by Application 2020 & 2033
- Table 42: France BI in Healthcare Industry Volume (K Unit) Forecast, by Application 2020 & 2033
- Table 43: Italy BI in Healthcare Industry Revenue (Million) Forecast, by Application 2020 & 2033
- Table 44: Italy BI in Healthcare Industry Volume (K Unit) Forecast, by Application 2020 & 2033
- Table 45: Spain BI in Healthcare Industry Revenue (Million) Forecast, by Application 2020 & 2033
- Table 46: Spain BI in Healthcare Industry Volume (K Unit) Forecast, by Application 2020 & 2033
- Table 47: Rest of Europe BI in Healthcare Industry Revenue (Million) Forecast, by Application 2020 & 2033
- Table 48: Rest of Europe BI in Healthcare Industry Volume (K Unit) Forecast, by Application 2020 & 2033
- Table 49: Global BI in Healthcare Industry Revenue Million Forecast, by Component 2020 & 2033
- Table 50: Global BI in Healthcare Industry Volume K Unit Forecast, by Component 2020 & 2033
- Table 51: Global BI in Healthcare Industry Revenue Million Forecast, by Mode of Delivery 2020 & 2033
- Table 52: Global BI in Healthcare Industry Volume K Unit Forecast, by Mode of Delivery 2020 & 2033
- Table 53: Global BI in Healthcare Industry Revenue Million Forecast, by Application 2020 & 2033
- Table 54: Global BI in Healthcare Industry Volume K Unit Forecast, by Application 2020 & 2033
- Table 55: Global BI in Healthcare Industry Revenue Million Forecast, by End User 2020 & 2033
- Table 56: Global BI in Healthcare Industry Volume K Unit Forecast, by End User 2020 & 2033
- Table 57: Global BI in Healthcare Industry Revenue Million Forecast, by Country 2020 & 2033
- Table 58: Global BI in Healthcare Industry Volume K Unit Forecast, by Country 2020 & 2033
- Table 59: China BI in Healthcare Industry Revenue (Million) Forecast, by Application 2020 & 2033
- Table 60: China BI in Healthcare Industry Volume (K Unit) Forecast, by Application 2020 & 2033
- Table 61: Japan BI in Healthcare Industry Revenue (Million) Forecast, by Application 2020 & 2033
- Table 62: Japan BI in Healthcare Industry Volume (K Unit) Forecast, by Application 2020 & 2033
- Table 63: India BI in Healthcare Industry Revenue (Million) Forecast, by Application 2020 & 2033
- Table 64: India BI in Healthcare Industry Volume (K Unit) Forecast, by Application 2020 & 2033
- Table 65: Australia BI in Healthcare Industry Revenue (Million) Forecast, by Application 2020 & 2033
- Table 66: Australia BI in Healthcare Industry Volume (K Unit) Forecast, by Application 2020 & 2033
- Table 67: South Korea BI in Healthcare Industry Revenue (Million) Forecast, by Application 2020 & 2033
- Table 68: South Korea BI in Healthcare Industry Volume (K Unit) Forecast, by Application 2020 & 2033
- Table 69: Rest of Asia Pacific BI in Healthcare Industry Revenue (Million) Forecast, by Application 2020 & 2033
- Table 70: Rest of Asia Pacific BI in Healthcare Industry Volume (K Unit) Forecast, by Application 2020 & 2033
- Table 71: Global BI in Healthcare Industry Revenue Million Forecast, by Component 2020 & 2033
- Table 72: Global BI in Healthcare Industry Volume K Unit Forecast, by Component 2020 & 2033
- Table 73: Global BI in Healthcare Industry Revenue Million Forecast, by Mode of Delivery 2020 & 2033
- Table 74: Global BI in Healthcare Industry Volume K Unit Forecast, by Mode of Delivery 2020 & 2033
- Table 75: Global BI in Healthcare Industry Revenue Million Forecast, by Application 2020 & 2033
- Table 76: Global BI in Healthcare Industry Volume K Unit Forecast, by Application 2020 & 2033
- Table 77: Global BI in Healthcare Industry Revenue Million Forecast, by End User 2020 & 2033
- Table 78: Global BI in Healthcare Industry Volume K Unit Forecast, by End User 2020 & 2033
- Table 79: Global BI in Healthcare Industry Revenue Million Forecast, by Country 2020 & 2033
- Table 80: Global BI in Healthcare Industry Volume K Unit Forecast, by Country 2020 & 2033
- Table 81: GCC BI in Healthcare Industry Revenue (Million) Forecast, by Application 2020 & 2033
- Table 82: GCC BI in Healthcare Industry Volume (K Unit) Forecast, by Application 2020 & 2033
- Table 83: South Africa BI in Healthcare Industry Revenue (Million) Forecast, by Application 2020 & 2033
- Table 84: South Africa BI in Healthcare Industry Volume (K Unit) Forecast, by Application 2020 & 2033
- Table 85: Rest of Middle East and Africa BI in Healthcare Industry Revenue (Million) Forecast, by Application 2020 & 2033
- Table 86: Rest of Middle East and Africa BI in Healthcare Industry Volume (K Unit) Forecast, by Application 2020 & 2033
- Table 87: Global BI in Healthcare Industry Revenue Million Forecast, by Component 2020 & 2033
- Table 88: Global BI in Healthcare Industry Volume K Unit Forecast, by Component 2020 & 2033
- Table 89: Global BI in Healthcare Industry Revenue Million Forecast, by Mode of Delivery 2020 & 2033
- Table 90: Global BI in Healthcare Industry Volume K Unit Forecast, by Mode of Delivery 2020 & 2033
- Table 91: Global BI in Healthcare Industry Revenue Million Forecast, by Application 2020 & 2033
- Table 92: Global BI in Healthcare Industry Volume K Unit Forecast, by Application 2020 & 2033
- Table 93: Global BI in Healthcare Industry Revenue Million Forecast, by End User 2020 & 2033
- Table 94: Global BI in Healthcare Industry Volume K Unit Forecast, by End User 2020 & 2033
- Table 95: Global BI in Healthcare Industry Revenue Million Forecast, by Country 2020 & 2033
- Table 96: Global BI in Healthcare Industry Volume K Unit Forecast, by Country 2020 & 2033
- Table 97: Brazil BI in Healthcare Industry Revenue (Million) Forecast, by Application 2020 & 2033
- Table 98: Brazil BI in Healthcare Industry Volume (K Unit) Forecast, by Application 2020 & 2033
- Table 99: Argentina BI in Healthcare Industry Revenue (Million) Forecast, by Application 2020 & 2033
- Table 100: Argentina BI in Healthcare Industry Volume (K Unit) Forecast, by Application 2020 & 2033
- Table 101: Rest of South America BI in Healthcare Industry Revenue (Million) Forecast, by Application 2020 & 2033
- Table 102: Rest of South America BI in Healthcare Industry Volume (K Unit) Forecast, by Application 2020 & 2033
Frequently Asked Questions
1. What is the projected Compound Annual Growth Rate (CAGR) of the BI in Healthcare Industry?
The projected CAGR is approximately 14.41%.
2. Which companies are prominent players in the BI in Healthcare Industry?
Key companies in the market include SAS Institute Inc, Infor Inc, IBM Corporation, MicroStrategy Incorporated, Microsoft Corporation, CareCloud Inc, EPIC SYSTEMS, QlikTech International AB, Information Builders, Oracle Corporation, Salesforce, Sisense Inc, Domo Inc , SAP SE.
3. What are the main segments of the BI in Healthcare Industry?
The market segments include Component, Mode of Delivery, Application, End User.
4. Can you provide details about the market size?
The market size is estimated to be USD 10.17 Million as of 2022.
5. What are some drivers contributing to market growth?
Growing Government Initiatives for Healthcare Digitalization. Like Adoption of EHR; Increasing Number of Patient Registries; The Emergence of Big Data in the Healthcare Industry.
6. What are the notable trends driving market growth?
Cloud-based Model is Expected to Grow Significantly in the Healthcare BI Market Over the Forecast Period.
7. Are there any restraints impacting market growth?
High Cost of Implementation; Lack of Skilled Professionals.
8. Can you provide examples of recent developments in the market?
Jun 2022: Oracle Corporation completed the acquisition of Cerner Corporation, a supplier of health information technology services.
9. What pricing options are available for accessing the report?
Pricing options include single-user, multi-user, and enterprise licenses priced at USD 4750, USD 5250, and USD 8750 respectively.
10. Is the market size provided in terms of value or volume?
The market size is provided in terms of value, measured in Million and volume, measured in K Unit.
11. Are there any specific market keywords associated with the report?
Yes, the market keyword associated with the report is "BI in Healthcare Industry," which aids in identifying and referencing the specific market segment covered.
12. How do I determine which pricing option suits my needs best?
The pricing options vary based on user requirements and access needs. Individual users may opt for single-user licenses, while businesses requiring broader access may choose multi-user or enterprise licenses for cost-effective access to the report.
13. Are there any additional resources or data provided in the BI in Healthcare Industry report?
While the report offers comprehensive insights, it's advisable to review the specific contents or supplementary materials provided to ascertain if additional resources or data are available.
14. How can I stay updated on further developments or reports in the BI in Healthcare Industry?
To stay informed about further developments, trends, and reports in the BI in Healthcare Industry, consider subscribing to industry newsletters, following relevant companies and organizations, or regularly checking reputable industry news sources and publications.
Methodology
Step 1 - Identification of Relevant Samples Size from Population Database


Step 2 - Approaches for Defining Global Market Size (Value, Volume* & Price*)

Note*: In applicable scenarios
Step 3 - Data Sources
Primary Research
- Web Analytics
- Survey Reports
- Research Institute
- Latest Research Reports
- Opinion Leaders
Secondary Research
- Annual Reports
- White Paper
- Latest Press Release
- Industry Association
- Paid Database
- Investor Presentations

Step 4 - Data Triangulation
Involves using different sources of information in order to increase the validity of a study
These sources are likely to be stakeholders in a program - participants, other researchers, program staff, other community members, and so on.
Then we put all data in single framework & apply various statistical tools to find out the dynamic on the market.
During the analysis stage, feedback from the stakeholder groups would be compared to determine areas of agreement as well as areas of divergence