

Key Insights
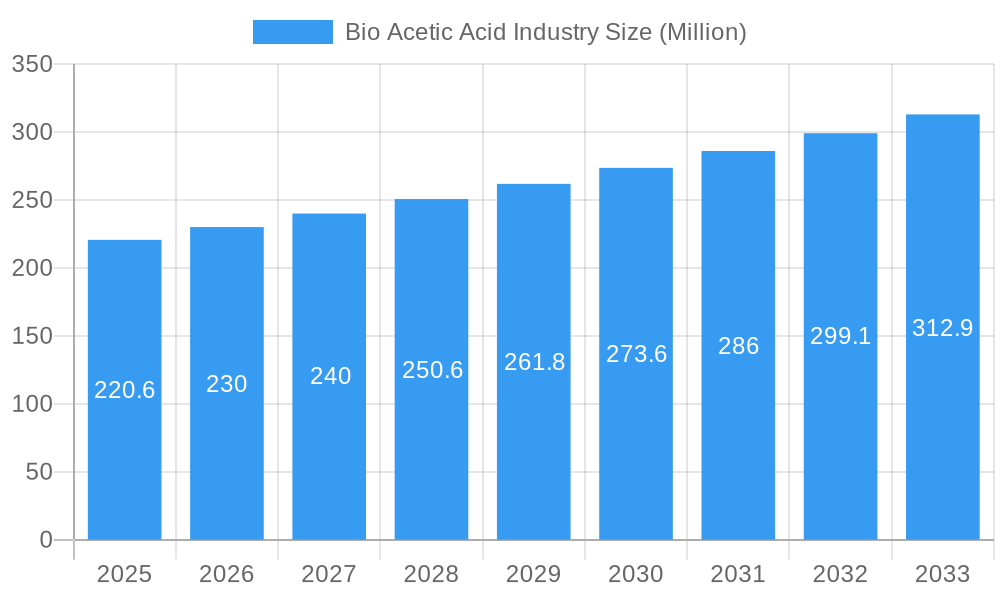
The global bio-acetic acid market, valued at $220.6 million in 2025, is projected to experience robust growth, driven by increasing demand for sustainable and bio-based chemicals across various industries. A Compound Annual Growth Rate (CAGR) exceeding 4% from 2025 to 2033 indicates a significant expansion in market size. This growth is fueled primarily by the rising adoption of bio-based materials in response to environmental concerns and stricter regulations surrounding petrochemical-derived products. Key application areas such as Vinyl Acetate Monomer (VAM) production, acetate esters manufacturing, and the synthesis of Purified Terephthalic Acid (PTA) are witnessing heightened demand, pushing the bio-acetic acid market forward. The diverse range of raw materials utilized, including biomass, corn, maize, and sugar, provides flexibility and resilience to the market, reducing reliance on single-source feedstocks. Significant investments in research and development are further accelerating innovation and efficiency within the bio-acetic acid production processes. While challenges exist, such as the comparatively higher production costs compared to conventional methods, ongoing technological advancements and supportive government policies are mitigating these restraints and fostering market expansion.
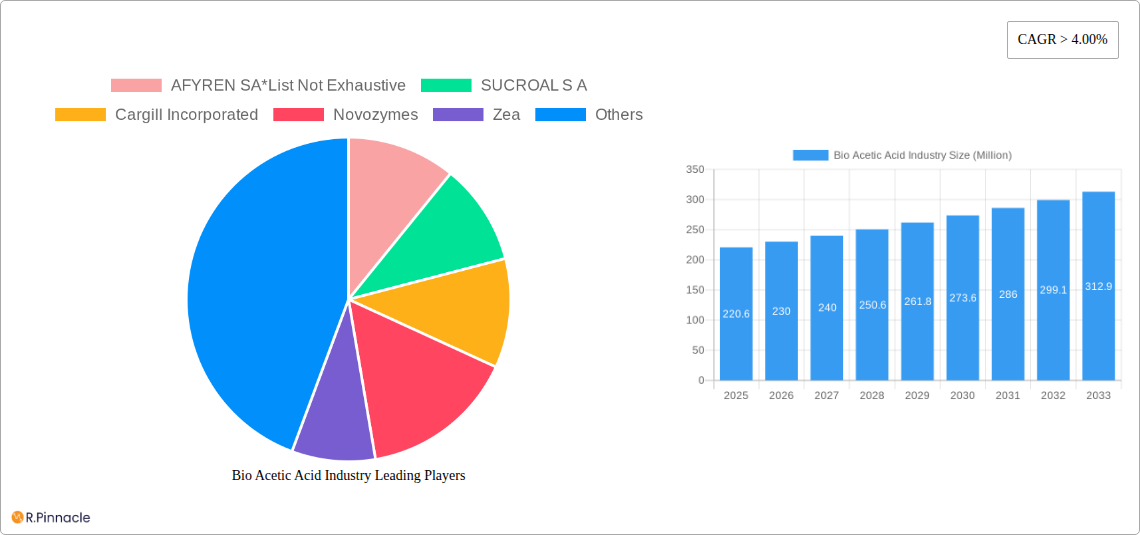
Bio Acetic Acid Industry Market Size (In Million)
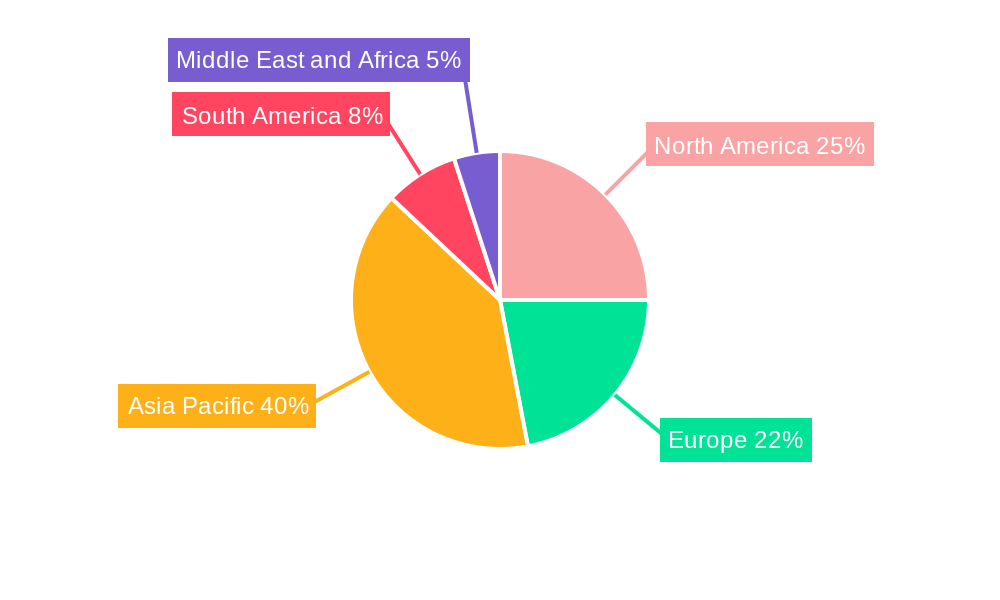
The regional landscape showcases a dynamic distribution of market share. Asia Pacific, driven by strong economic growth and expanding industrial sectors in countries like China and India, is anticipated to hold a significant portion of the market. North America and Europe, while possessing established chemical industries, are also expected to experience considerable growth, propelled by increasing focus on sustainable practices and the incorporation of bio-based alternatives. Competitive dynamics are shaped by a mix of established players like Cargill Incorporated and BASF SE, and emerging biotech companies like AFYREN SA and LanzaTech, signifying a vibrant and evolving market landscape. This combination of established players and innovative startups fuels competition and drives ongoing innovation in production methods and applications. The forecast period of 2025-2033 promises a continued upward trajectory for the bio-acetic acid market, with significant opportunities for growth and development across diverse sectors and geographical regions.
Bio Acetic Acid Industry Company Market Share
Bio Acetic Acid Industry Market Report: 2019-2033
This comprehensive report provides an in-depth analysis of the Bio Acetic Acid industry, offering valuable insights for industry professionals, investors, and stakeholders. With a study period spanning 2019-2033, a base year of 2025, and a forecast period of 2025-2033, this report presents a detailed overview of market size, growth drivers, challenges, and future opportunities within the Bio Acetic Acid sector. The report leverages extensive market research and data analysis to provide actionable insights, including key market trends and future projections, valued in Millions.
Bio Acetic Acid Industry Market Structure & Innovation Trends
The bio acetic acid industry is a dynamic and evolving sector, characterized by a growing number of specialized players and established chemical giants. The competitive landscape is shaped by a confluence of factors including market concentration, the relentless pursuit of innovation, evolving regulatory frameworks, the availability of product substitutes, the demographics of end-users, and strategic mergers and acquisitions (M&A). While the market remains moderately fragmented, with a Herfindahl-Hirschman Index (HHI) indicating a diverse range of participants, prominent companies such as Cargill Incorporated and BASF SE continue to hold substantial market influence.
- Market Concentration: The market exhibits moderate fragmentation, with significant room for growth and market share acquisition by emerging players. The Herfindahl-Hirschman Index (HHI) is estimated to be around xx, suggesting a competitive environment with no single dominant entity.
- Innovation Drivers: The primary impetus for innovation stems from the escalating global demand for sustainable and environmentally friendly chemicals. Advancements in efficient and cost-effective fermentation technologies, coupled with robust government support and incentives for the development of bio-based industries, are propelling rapid innovation within the sector.
- Regulatory Frameworks: Diverse and sometimes complex regulatory environments across different geographical regions significantly influence market dynamics. While supportive policies and incentives for renewable energy sources and bio-based products create fertile ground for growth, stringent environmental regulations, though crucial for sustainability, can present operational challenges and require strategic adaptation.
- Product Substitutes: Petrochemically derived acetic acid continues to be a formidable competitor due to its established production infrastructure and cost-effectiveness. However, the growing imperative for sustainability and increasing consumer preference for eco-friendly products are driving the adoption and acceptance of bio-based alternatives, steadily eroding the market dominance of traditional petrochemical routes.
- End-User Demographics: The bio acetic acid market is primarily driven by demand from key application sectors. These include the production of Vinyl Acetate Monomer (VAM), Acetate Esters, Purified Terephthalic Acid (PTA), and Acetic Anhydride. Growth and innovation within these downstream industries directly translate into increased demand for bio acetic acid.
- M&A Activities: The past five years have witnessed notable strategic consolidation within the bio acetic acid sector, with approximately xx Million invested in M&A activities. These transactions have predominantly focused on expanding existing production capacities, acquiring cutting-edge biotechnologies, and securing access to novel feedstocks. Specific strategic deals, if available, are detailed in the full report.
Bio Acetic Acid Industry Market Dynamics & Trends
The global bio acetic acid market exhibits a robust growth trajectory, fueled by several key factors. The market is experiencing significant growth, driven by increasing demand for sustainable and renewable chemicals, coupled with stringent environmental regulations and the rising cost of petroleum-based alternatives. Technological advancements in fermentation processes and the development of high-yield strains continue to enhance production efficiency. Consumer preference for environmentally friendly products and stringent government regulations promote the adoption of bio-based acetic acid. Competitive dynamics are characterized by both cooperation and competition, with companies focusing on strategic partnerships and innovations to gain market share. The CAGR for the period 2025-2033 is projected at xx%, with a market penetration rate expected to reach xx% by 2033.
Dominant Regions & Segments in Bio Acetic Acid Industry
Geographically, North America and Europe currently lead the bio acetic acid market, driven by their advanced industrial infrastructure and strong commitment to sustainability. However, the Asia-Pacific region is experiencing exceptionally rapid growth, fueled by its burgeoning chemical industry, substantial manufacturing capabilities, and proactive government initiatives aimed at promoting the adoption of bio-based products.
Leading Regions:
- North America: Benefiting from robust demand across the VAM and Acetate Esters segments, complemented by supportive government policies and a well-developed industrial ecosystem, North America remains a key market.
- Europe: Home to a mature bio-based industry, Europe's strong emphasis on environmental regulations and sustainable practices positions it as a significant player and innovation hub.
- Asia-Pacific: The region's rapid industrialization, coupled with a growing demand for cost-effective and sustainable chemical solutions, is creating immense market expansion opportunities for bio acetic acid.
Dominant Segments:
- Raw Material: Currently, biomass and corn are the dominant raw materials due to their widespread availability, established supply chains, and cost-effectiveness, making them the preferred feedstocks for bio acetic acid production.
- Application: Vinyl Acetate Monomer (VAM) stands as the largest application segment for bio acetic acid, owing to its extensive use as a key intermediate in the production of adhesives, paints, coatings, and textiles.
Key Drivers:
- Favorable government policies, tax incentives, and subsidies designed to promote renewable energy sources and the adoption of sustainable chemical alternatives.
- Continuous development and refinement of advanced fermentation technologies, including the engineering of high-yield microbial strains, which are critical for enhancing production efficiency and reducing costs.
- Increasing global consumer awareness regarding environmental issues, leading to a pronounced preference for eco-friendly products and a willingness to support sustainable manufacturing processes.
Bio Acetic Acid Industry Product Innovations
Recent innovations focus on improving fermentation efficiency, reducing production costs, and expanding application possibilities. Companies are developing advanced microbial strains with higher yields and tolerance to inhibitors. New downstream processing technologies are being implemented to enhance product purity and reduce waste. These innovations are enabling bio-based acetic acid to compete more effectively with its petrochemical counterpart.
Report Scope & Segmentation Analysis
This report segments the bio acetic acid market based on raw materials (Biomass, Corn, Maize, Sugar, Other Raw Materials) and applications (Vinyl Acetate Monomer (VAM), Acetate Esters, Purified Terephthalic Acid (PTA), Acetic Anhydride, Other Applications). Each segment's growth projection, market size, and competitive dynamics are comprehensively analyzed. For example, the VAM segment is expected to show the highest CAGR due to its high demand. Market size projections for each segment are detailed in the full report.
Key Drivers of Bio Acetic Acid Industry Growth
The growth of the bio acetic acid industry is driven by several factors, including increasing demand for sustainable chemicals, advancements in fermentation technology leading to higher yields and lower costs, supportive government policies and incentives promoting bio-based industries, and the rising cost of petroleum-derived acetic acid. Stringent environmental regulations are also pushing the adoption of bio-based alternatives.
Challenges in the Bio Acetic Acid Industry Sector
The bio acetic acid industry, while promising, encounters several significant challenges. High initial capital investment requirements for establishing bio-based production facilities can be a substantial barrier. Furthermore, intense competition from the well-entrenched petrochemical-based acetic acid market, which benefits from economies of scale and established infrastructure, poses a continuous threat. The industry's reliance on agricultural feedstocks also exposes it to price volatility and supply chain disruptions. To achieve true cost parity and widespread market penetration, ongoing advancements in process technology and operational efficiency are crucial.
Emerging Opportunities in Bio Acetic Acid Industry
Emerging opportunities lie in expanding into new applications, such as biodegradable plastics and bio-based solvents. Further technological advancements in fermentation, downstream processing, and waste utilization can significantly enhance the industry's competitiveness. The exploration of novel feedstocks and the development of integrated biorefineries also present promising avenues for growth.
Key Developments in Bio Acetic Acid Industry Industry
- July 2022: Novozymes launched Innova Apex and Innova Turbo, advanced yeast solutions enhancing ethanol production efficiency. This innovation directly impacts the bio acetic acid market by improving the viability and competitiveness of bio-based production methods.
- February 2022: The Indian government proposed reducing customs duty on key chemicals, including acetic acid, stimulating domestic value addition and potentially boosting market growth in the region.
Future Outlook for Bio Acetic Acid Industry Market
The future trajectory of the bio acetic acid market is overwhelmingly positive, propelled by sustained technological advancements, a growing global appetite for sustainable chemicals, and increasingly supportive government policies worldwide. Strategic collaborations, robust investments in research and development (R&D), and the scaling up of innovative production methodologies are expected to significantly accelerate market growth over the next decade. The industry is poised for substantial expansion, particularly in regions that are actively championing renewable resources and demonstrating a strong demand for environmentally conscious solutions.
Bio Acetic Acid Industry Segmentation
-
1. Raw Material
- 1.1. Biomass
- 1.2. Corn
- 1.3. Maize
- 1.4. Sugar
- 1.5. Other Raw Materials
-
2. Application
- 2.1. Vinyl Acetate Monomer (VAM)
- 2.2. Acetate Esters
- 2.3. Purified Terephthalic Acid (PTA)
- 2.4. Acetic Anhydride
- 2.5. Other Applications
Bio Acetic Acid Industry Segmentation By Geography
-
1. Asia Pacific
- 1.1. China
- 1.2. India
- 1.3. Japan
- 1.4. South Korea
- 1.5. Malaysia
- 1.6. Thailand
- 1.7. Indonesia
- 1.8. Vietnam
- 1.9. Rest of Asia Pacific
-
2. North America
- 2.1. United States
- 2.2. Canada
- 2.3. Mexico
-
3. Europe
- 3.1. Germany
- 3.2. United Kingdom
- 3.3. Italy
- 3.4. France
- 3.5. Spain
- 3.6. NORDIC Countries
- 3.7. Turkey
- 3.8. Russia
- 3.9. Rest of Europe
-
4. South America
- 4.1. Brazil
- 4.2. Argentina
- 4.3. Colombia
- 4.4. Rest of South America
-
5. Middle East and Africa
- 5.1. Qatar
- 5.2. United Arab Emirates
- 5.3. Nigeria
- 5.4. Egypt
- 5.5. South Africa
- 5.6. Rest of Middle East and Africa
-
6. Middle East and Africa
- 6.1. Saudi Arabia
- 6.2. South Africa
- 6.3. Rest of Middle East and Africa
Bio Acetic Acid Industry Regional Market Share
Geographic Coverage of Bio Acetic Acid Industry
Bio Acetic Acid Industry REPORT HIGHLIGHTS
| Aspects | Details |
|---|---|
| Study Period | 2020-2034 |
| Base Year | 2025 |
| Estimated Year | 2026 |
| Forecast Period | 2026-2034 |
| Historical Period | 2020-2025 |
| Growth Rate | CAGR of > 4.00% from 2020-2034 |
| Segmentation |
|
Table of Contents
- 1. Introduction
- 1.1. Research Scope
- 1.2. Market Segmentation
- 1.3. Research Objective
- 1.4. Definitions and Assumptions
- 2. Executive Summary
- 2.1. Market Snapshot
- 3. Market Dynamics
- 3.1. Market Drivers
- 3.2. Market Restrains
- 3.3. Market Trends
- 3.4. Market Opportunities
- 4. Market Factor Analysis
- 4.1. Porters Five Forces
- 4.1.1. Bargaining Power of Suppliers
- 4.1.2. Bargaining Power of Buyers
- 4.1.3. Threat of New Entrants
- 4.1.4. Threat of Substitutes
- 4.1.5. Competitive Rivalry
- 4.2. PESTEL analysis
- 4.3. BCG Analysis
- 4.3.1. Stars (High Growth, High Market Share)
- 4.3.2. Cash Cows (Low Growth, High Market Share)
- 4.3.3. Question Mark (High Growth, Low Market Share)
- 4.3.4. Dogs (Low Growth, Low Market Share)
- 4.4. Ansoff Matrix Analysis
- 4.5. Supply Chain Analysis
- 4.6. Regulatory Landscape
- 4.7. Current Market Potential and Opportunity Assessment (TAM–SAM–SOM Framework)
- 4.8. PRI Analyst Note
- 4.1. Porters Five Forces
- 5. Market Analysis, Insights and Forecast 2021-2033
- 5.1. Market Analysis, Insights and Forecast - by Raw Material
- 5.1.1. Biomass
- 5.1.2. Corn
- 5.1.3. Maize
- 5.1.4. Sugar
- 5.1.5. Other Raw Materials
- 5.2. Market Analysis, Insights and Forecast - by Application
- 5.2.1. Vinyl Acetate Monomer (VAM)
- 5.2.2. Acetate Esters
- 5.2.3. Purified Terephthalic Acid (PTA)
- 5.2.4. Acetic Anhydride
- 5.2.5. Other Applications
- 5.3. Market Analysis, Insights and Forecast - by Region
- 5.3.1. Asia Pacific
- 5.3.2. North America
- 5.3.3. Europe
- 5.3.4. South America
- 5.3.5. Middle East and Africa
- 5.3.6. Middle East and Africa
- 5.1. Market Analysis, Insights and Forecast - by Raw Material
- 6. Global Bio Acetic Acid Industry Analysis, Insights and Forecast, 2021-2033
- 6.1. Market Analysis, Insights and Forecast - by Raw Material
- 6.1.1. Biomass
- 6.1.2. Corn
- 6.1.3. Maize
- 6.1.4. Sugar
- 6.1.5. Other Raw Materials
- 6.2. Market Analysis, Insights and Forecast - by Application
- 6.2.1. Vinyl Acetate Monomer (VAM)
- 6.2.2. Acetate Esters
- 6.2.3. Purified Terephthalic Acid (PTA)
- 6.2.4. Acetic Anhydride
- 6.2.5. Other Applications
- 6.1. Market Analysis, Insights and Forecast - by Raw Material
- 7. Asia Pacific Bio Acetic Acid Industry Analysis, Insights and Forecast, 2020-2032
- 7.1. Market Analysis, Insights and Forecast - by Raw Material
- 7.1.1. Biomass
- 7.1.2. Corn
- 7.1.3. Maize
- 7.1.4. Sugar
- 7.1.5. Other Raw Materials
- 7.2. Market Analysis, Insights and Forecast - by Application
- 7.2.1. Vinyl Acetate Monomer (VAM)
- 7.2.2. Acetate Esters
- 7.2.3. Purified Terephthalic Acid (PTA)
- 7.2.4. Acetic Anhydride
- 7.2.5. Other Applications
- 7.1. Market Analysis, Insights and Forecast - by Raw Material
- 8. North America Bio Acetic Acid Industry Analysis, Insights and Forecast, 2020-2032
- 8.1. Market Analysis, Insights and Forecast - by Raw Material
- 8.1.1. Biomass
- 8.1.2. Corn
- 8.1.3. Maize
- 8.1.4. Sugar
- 8.1.5. Other Raw Materials
- 8.2. Market Analysis, Insights and Forecast - by Application
- 8.2.1. Vinyl Acetate Monomer (VAM)
- 8.2.2. Acetate Esters
- 8.2.3. Purified Terephthalic Acid (PTA)
- 8.2.4. Acetic Anhydride
- 8.2.5. Other Applications
- 8.1. Market Analysis, Insights and Forecast - by Raw Material
- 9. Europe Bio Acetic Acid Industry Analysis, Insights and Forecast, 2020-2032
- 9.1. Market Analysis, Insights and Forecast - by Raw Material
- 9.1.1. Biomass
- 9.1.2. Corn
- 9.1.3. Maize
- 9.1.4. Sugar
- 9.1.5. Other Raw Materials
- 9.2. Market Analysis, Insights and Forecast - by Application
- 9.2.1. Vinyl Acetate Monomer (VAM)
- 9.2.2. Acetate Esters
- 9.2.3. Purified Terephthalic Acid (PTA)
- 9.2.4. Acetic Anhydride
- 9.2.5. Other Applications
- 9.1. Market Analysis, Insights and Forecast - by Raw Material
- 10. South America Bio Acetic Acid Industry Analysis, Insights and Forecast, 2020-2032
- 10.1. Market Analysis, Insights and Forecast - by Raw Material
- 10.1.1. Biomass
- 10.1.2. Corn
- 10.1.3. Maize
- 10.1.4. Sugar
- 10.1.5. Other Raw Materials
- 10.2. Market Analysis, Insights and Forecast - by Application
- 10.2.1. Vinyl Acetate Monomer (VAM)
- 10.2.2. Acetate Esters
- 10.2.3. Purified Terephthalic Acid (PTA)
- 10.2.4. Acetic Anhydride
- 10.2.5. Other Applications
- 10.1. Market Analysis, Insights and Forecast - by Raw Material
- 11. Middle East and Africa Bio Acetic Acid Industry Analysis, Insights and Forecast, 2020-2032
- 11.1. Market Analysis, Insights and Forecast - by Raw Material
- 11.1.1. Biomass
- 11.1.2. Corn
- 11.1.3. Maize
- 11.1.4. Sugar
- 11.1.5. Other Raw Materials
- 11.2. Market Analysis, Insights and Forecast - by Application
- 11.2.1. Vinyl Acetate Monomer (VAM)
- 11.2.2. Acetate Esters
- 11.2.3. Purified Terephthalic Acid (PTA)
- 11.2.4. Acetic Anhydride
- 11.2.5. Other Applications
- 11.1. Market Analysis, Insights and Forecast - by Raw Material
- 12. Middle East and Africa Bio Acetic Acid Industry Analysis, Insights and Forecast, 2020-2032
- 12.1. Market Analysis, Insights and Forecast - by Raw Material
- 12.1.1. Biomass
- 12.1.2. Corn
- 12.1.3. Maize
- 12.1.4. Sugar
- 12.1.5. Other Raw Materials
- 12.2. Market Analysis, Insights and Forecast - by Application
- 12.2.1. Vinyl Acetate Monomer (VAM)
- 12.2.2. Acetate Esters
- 12.2.3. Purified Terephthalic Acid (PTA)
- 12.2.4. Acetic Anhydride
- 12.2.5. Other Applications
- 12.1. Market Analysis, Insights and Forecast - by Raw Material
- 13. Competitive Analysis
- 13.1. Company Profiles
- 13.1.1 AFYREN SA*List Not Exhaustive
- 13.1.1.1. Company Overview
- 13.1.1.2. Products
- 13.1.1.3. Company Financials
- 13.1.1.4. SWOT Analysis
- 13.1.2 SUCROAL S A
- 13.1.2.1. Company Overview
- 13.1.2.2. Products
- 13.1.2.3. Company Financials
- 13.1.2.4. SWOT Analysis
- 13.1.3 Cargill Incorporated
- 13.1.3.1. Company Overview
- 13.1.3.2. Products
- 13.1.3.3. Company Financials
- 13.1.3.4. SWOT Analysis
- 13.1.4 Novozymes
- 13.1.4.1. Company Overview
- 13.1.4.2. Products
- 13.1.4.3. Company Financials
- 13.1.4.4. SWOT Analysis
- 13.1.5 Zea
- 13.1.5.1. Company Overview
- 13.1.5.2. Products
- 13.1.5.3. Company Financials
- 13.1.5.4. SWOT Analysis
- 13.1.6 LanzaTech
- 13.1.6.1. Company Overview
- 13.1.6.2. Products
- 13.1.6.3. Company Financials
- 13.1.6.4. SWOT Analysis
- 13.1.7 GODAVARI BIOREFINERIES LTD
- 13.1.7.1. Company Overview
- 13.1.7.2. Products
- 13.1.7.3. Company Financials
- 13.1.7.4. SWOT Analysis
- 13.1.8 btgbioliquids
- 13.1.8.1. Company Overview
- 13.1.8.2. Products
- 13.1.8.3. Company Financials
- 13.1.8.4. SWOT Analysis
- 13.1.9 Airedale Chemical Company Limited
- 13.1.9.1. Company Overview
- 13.1.9.2. Products
- 13.1.9.3. Company Financials
- 13.1.9.4. SWOT Analysis
- 13.1.10 BASF SE
- 13.1.10.1. Company Overview
- 13.1.10.2. Products
- 13.1.10.3. Company Financials
- 13.1.10.4. SWOT Analysis
- 13.1.1 AFYREN SA*List Not Exhaustive
- 13.2. Market Entropy
- 13.2.1 Company's Key Areas Served
- 13.2.2 Recent Developments
- 13.3. Company Market Share Analysis 2025
- 13.3.1 Top 5 Companies Market Share Analysis
- 13.3.2 Top 3 Companies Market Share Analysis
- 13.4. List of Potential Customers
- 14. Research Methodology
List of Figures
- Figure 1: Global Bio Acetic Acid Industry Revenue Breakdown (Million, %) by Region 2025 & 2033
- Figure 2: Global Bio Acetic Acid Industry Volume Breakdown (K Tons, %) by Region 2025 & 2033
- Figure 3: Asia Pacific Bio Acetic Acid Industry Revenue (Million), by Raw Material 2025 & 2033
- Figure 4: Asia Pacific Bio Acetic Acid Industry Volume (K Tons), by Raw Material 2025 & 2033
- Figure 5: Asia Pacific Bio Acetic Acid Industry Revenue Share (%), by Raw Material 2025 & 2033
- Figure 6: Asia Pacific Bio Acetic Acid Industry Volume Share (%), by Raw Material 2025 & 2033
- Figure 7: Asia Pacific Bio Acetic Acid Industry Revenue (Million), by Application 2025 & 2033
- Figure 8: Asia Pacific Bio Acetic Acid Industry Volume (K Tons), by Application 2025 & 2033
- Figure 9: Asia Pacific Bio Acetic Acid Industry Revenue Share (%), by Application 2025 & 2033
- Figure 10: Asia Pacific Bio Acetic Acid Industry Volume Share (%), by Application 2025 & 2033
- Figure 11: Asia Pacific Bio Acetic Acid Industry Revenue (Million), by Country 2025 & 2033
- Figure 12: Asia Pacific Bio Acetic Acid Industry Volume (K Tons), by Country 2025 & 2033
- Figure 13: Asia Pacific Bio Acetic Acid Industry Revenue Share (%), by Country 2025 & 2033
- Figure 14: Asia Pacific Bio Acetic Acid Industry Volume Share (%), by Country 2025 & 2033
- Figure 15: North America Bio Acetic Acid Industry Revenue (Million), by Raw Material 2025 & 2033
- Figure 16: North America Bio Acetic Acid Industry Volume (K Tons), by Raw Material 2025 & 2033
- Figure 17: North America Bio Acetic Acid Industry Revenue Share (%), by Raw Material 2025 & 2033
- Figure 18: North America Bio Acetic Acid Industry Volume Share (%), by Raw Material 2025 & 2033
- Figure 19: North America Bio Acetic Acid Industry Revenue (Million), by Application 2025 & 2033
- Figure 20: North America Bio Acetic Acid Industry Volume (K Tons), by Application 2025 & 2033
- Figure 21: North America Bio Acetic Acid Industry Revenue Share (%), by Application 2025 & 2033
- Figure 22: North America Bio Acetic Acid Industry Volume Share (%), by Application 2025 & 2033
- Figure 23: North America Bio Acetic Acid Industry Revenue (Million), by Country 2025 & 2033
- Figure 24: North America Bio Acetic Acid Industry Volume (K Tons), by Country 2025 & 2033
- Figure 25: North America Bio Acetic Acid Industry Revenue Share (%), by Country 2025 & 2033
- Figure 26: North America Bio Acetic Acid Industry Volume Share (%), by Country 2025 & 2033
- Figure 27: Europe Bio Acetic Acid Industry Revenue (Million), by Raw Material 2025 & 2033
- Figure 28: Europe Bio Acetic Acid Industry Volume (K Tons), by Raw Material 2025 & 2033
- Figure 29: Europe Bio Acetic Acid Industry Revenue Share (%), by Raw Material 2025 & 2033
- Figure 30: Europe Bio Acetic Acid Industry Volume Share (%), by Raw Material 2025 & 2033
- Figure 31: Europe Bio Acetic Acid Industry Revenue (Million), by Application 2025 & 2033
- Figure 32: Europe Bio Acetic Acid Industry Volume (K Tons), by Application 2025 & 2033
- Figure 33: Europe Bio Acetic Acid Industry Revenue Share (%), by Application 2025 & 2033
- Figure 34: Europe Bio Acetic Acid Industry Volume Share (%), by Application 2025 & 2033
- Figure 35: Europe Bio Acetic Acid Industry Revenue (Million), by Country 2025 & 2033
- Figure 36: Europe Bio Acetic Acid Industry Volume (K Tons), by Country 2025 & 2033
- Figure 37: Europe Bio Acetic Acid Industry Revenue Share (%), by Country 2025 & 2033
- Figure 38: Europe Bio Acetic Acid Industry Volume Share (%), by Country 2025 & 2033
- Figure 39: South America Bio Acetic Acid Industry Revenue (Million), by Raw Material 2025 & 2033
- Figure 40: South America Bio Acetic Acid Industry Volume (K Tons), by Raw Material 2025 & 2033
- Figure 41: South America Bio Acetic Acid Industry Revenue Share (%), by Raw Material 2025 & 2033
- Figure 42: South America Bio Acetic Acid Industry Volume Share (%), by Raw Material 2025 & 2033
- Figure 43: South America Bio Acetic Acid Industry Revenue (Million), by Application 2025 & 2033
- Figure 44: South America Bio Acetic Acid Industry Volume (K Tons), by Application 2025 & 2033
- Figure 45: South America Bio Acetic Acid Industry Revenue Share (%), by Application 2025 & 2033
- Figure 46: South America Bio Acetic Acid Industry Volume Share (%), by Application 2025 & 2033
- Figure 47: South America Bio Acetic Acid Industry Revenue (Million), by Country 2025 & 2033
- Figure 48: South America Bio Acetic Acid Industry Volume (K Tons), by Country 2025 & 2033
- Figure 49: South America Bio Acetic Acid Industry Revenue Share (%), by Country 2025 & 2033
- Figure 50: South America Bio Acetic Acid Industry Volume Share (%), by Country 2025 & 2033
- Figure 51: Middle East and Africa Bio Acetic Acid Industry Revenue (Million), by Raw Material 2025 & 2033
- Figure 52: Middle East and Africa Bio Acetic Acid Industry Volume (K Tons), by Raw Material 2025 & 2033
- Figure 53: Middle East and Africa Bio Acetic Acid Industry Revenue Share (%), by Raw Material 2025 & 2033
- Figure 54: Middle East and Africa Bio Acetic Acid Industry Volume Share (%), by Raw Material 2025 & 2033
- Figure 55: Middle East and Africa Bio Acetic Acid Industry Revenue (Million), by Application 2025 & 2033
- Figure 56: Middle East and Africa Bio Acetic Acid Industry Volume (K Tons), by Application 2025 & 2033
- Figure 57: Middle East and Africa Bio Acetic Acid Industry Revenue Share (%), by Application 2025 & 2033
- Figure 58: Middle East and Africa Bio Acetic Acid Industry Volume Share (%), by Application 2025 & 2033
- Figure 59: Middle East and Africa Bio Acetic Acid Industry Revenue (Million), by Country 2025 & 2033
- Figure 60: Middle East and Africa Bio Acetic Acid Industry Volume (K Tons), by Country 2025 & 2033
- Figure 61: Middle East and Africa Bio Acetic Acid Industry Revenue Share (%), by Country 2025 & 2033
- Figure 62: Middle East and Africa Bio Acetic Acid Industry Volume Share (%), by Country 2025 & 2033
- Figure 63: Middle East and Africa Bio Acetic Acid Industry Revenue (Million), by Raw Material 2025 & 2033
- Figure 64: Middle East and Africa Bio Acetic Acid Industry Volume (K Tons), by Raw Material 2025 & 2033
- Figure 65: Middle East and Africa Bio Acetic Acid Industry Revenue Share (%), by Raw Material 2025 & 2033
- Figure 66: Middle East and Africa Bio Acetic Acid Industry Volume Share (%), by Raw Material 2025 & 2033
- Figure 67: Middle East and Africa Bio Acetic Acid Industry Revenue (Million), by Application 2025 & 2033
- Figure 68: Middle East and Africa Bio Acetic Acid Industry Volume (K Tons), by Application 2025 & 2033
- Figure 69: Middle East and Africa Bio Acetic Acid Industry Revenue Share (%), by Application 2025 & 2033
- Figure 70: Middle East and Africa Bio Acetic Acid Industry Volume Share (%), by Application 2025 & 2033
- Figure 71: Middle East and Africa Bio Acetic Acid Industry Revenue (Million), by Country 2025 & 2033
- Figure 72: Middle East and Africa Bio Acetic Acid Industry Volume (K Tons), by Country 2025 & 2033
- Figure 73: Middle East and Africa Bio Acetic Acid Industry Revenue Share (%), by Country 2025 & 2033
- Figure 74: Middle East and Africa Bio Acetic Acid Industry Volume Share (%), by Country 2025 & 2033
List of Tables
- Table 1: Global Bio Acetic Acid Industry Revenue Million Forecast, by Raw Material 2020 & 2033
- Table 2: Global Bio Acetic Acid Industry Volume K Tons Forecast, by Raw Material 2020 & 2033
- Table 3: Global Bio Acetic Acid Industry Revenue Million Forecast, by Application 2020 & 2033
- Table 4: Global Bio Acetic Acid Industry Volume K Tons Forecast, by Application 2020 & 2033
- Table 5: Global Bio Acetic Acid Industry Revenue Million Forecast, by Region 2020 & 2033
- Table 6: Global Bio Acetic Acid Industry Volume K Tons Forecast, by Region 2020 & 2033
- Table 7: Global Bio Acetic Acid Industry Revenue Million Forecast, by Raw Material 2020 & 2033
- Table 8: Global Bio Acetic Acid Industry Volume K Tons Forecast, by Raw Material 2020 & 2033
- Table 9: Global Bio Acetic Acid Industry Revenue Million Forecast, by Application 2020 & 2033
- Table 10: Global Bio Acetic Acid Industry Volume K Tons Forecast, by Application 2020 & 2033
- Table 11: Global Bio Acetic Acid Industry Revenue Million Forecast, by Country 2020 & 2033
- Table 12: Global Bio Acetic Acid Industry Volume K Tons Forecast, by Country 2020 & 2033
- Table 13: China Bio Acetic Acid Industry Revenue (Million) Forecast, by Application 2020 & 2033
- Table 14: China Bio Acetic Acid Industry Volume (K Tons) Forecast, by Application 2020 & 2033
- Table 15: India Bio Acetic Acid Industry Revenue (Million) Forecast, by Application 2020 & 2033
- Table 16: India Bio Acetic Acid Industry Volume (K Tons) Forecast, by Application 2020 & 2033
- Table 17: Japan Bio Acetic Acid Industry Revenue (Million) Forecast, by Application 2020 & 2033
- Table 18: Japan Bio Acetic Acid Industry Volume (K Tons) Forecast, by Application 2020 & 2033
- Table 19: South Korea Bio Acetic Acid Industry Revenue (Million) Forecast, by Application 2020 & 2033
- Table 20: South Korea Bio Acetic Acid Industry Volume (K Tons) Forecast, by Application 2020 & 2033
- Table 21: Malaysia Bio Acetic Acid Industry Revenue (Million) Forecast, by Application 2020 & 2033
- Table 22: Malaysia Bio Acetic Acid Industry Volume (K Tons) Forecast, by Application 2020 & 2033
- Table 23: Thailand Bio Acetic Acid Industry Revenue (Million) Forecast, by Application 2020 & 2033
- Table 24: Thailand Bio Acetic Acid Industry Volume (K Tons) Forecast, by Application 2020 & 2033
- Table 25: Indonesia Bio Acetic Acid Industry Revenue (Million) Forecast, by Application 2020 & 2033
- Table 26: Indonesia Bio Acetic Acid Industry Volume (K Tons) Forecast, by Application 2020 & 2033
- Table 27: Vietnam Bio Acetic Acid Industry Revenue (Million) Forecast, by Application 2020 & 2033
- Table 28: Vietnam Bio Acetic Acid Industry Volume (K Tons) Forecast, by Application 2020 & 2033
- Table 29: Rest of Asia Pacific Bio Acetic Acid Industry Revenue (Million) Forecast, by Application 2020 & 2033
- Table 30: Rest of Asia Pacific Bio Acetic Acid Industry Volume (K Tons) Forecast, by Application 2020 & 2033
- Table 31: Global Bio Acetic Acid Industry Revenue Million Forecast, by Raw Material 2020 & 2033
- Table 32: Global Bio Acetic Acid Industry Volume K Tons Forecast, by Raw Material 2020 & 2033
- Table 33: Global Bio Acetic Acid Industry Revenue Million Forecast, by Application 2020 & 2033
- Table 34: Global Bio Acetic Acid Industry Volume K Tons Forecast, by Application 2020 & 2033
- Table 35: Global Bio Acetic Acid Industry Revenue Million Forecast, by Country 2020 & 2033
- Table 36: Global Bio Acetic Acid Industry Volume K Tons Forecast, by Country 2020 & 2033
- Table 37: United States Bio Acetic Acid Industry Revenue (Million) Forecast, by Application 2020 & 2033
- Table 38: United States Bio Acetic Acid Industry Volume (K Tons) Forecast, by Application 2020 & 2033
- Table 39: Canada Bio Acetic Acid Industry Revenue (Million) Forecast, by Application 2020 & 2033
- Table 40: Canada Bio Acetic Acid Industry Volume (K Tons) Forecast, by Application 2020 & 2033
- Table 41: Mexico Bio Acetic Acid Industry Revenue (Million) Forecast, by Application 2020 & 2033
- Table 42: Mexico Bio Acetic Acid Industry Volume (K Tons) Forecast, by Application 2020 & 2033
- Table 43: Global Bio Acetic Acid Industry Revenue Million Forecast, by Raw Material 2020 & 2033
- Table 44: Global Bio Acetic Acid Industry Volume K Tons Forecast, by Raw Material 2020 & 2033
- Table 45: Global Bio Acetic Acid Industry Revenue Million Forecast, by Application 2020 & 2033
- Table 46: Global Bio Acetic Acid Industry Volume K Tons Forecast, by Application 2020 & 2033
- Table 47: Global Bio Acetic Acid Industry Revenue Million Forecast, by Country 2020 & 2033
- Table 48: Global Bio Acetic Acid Industry Volume K Tons Forecast, by Country 2020 & 2033
- Table 49: Germany Bio Acetic Acid Industry Revenue (Million) Forecast, by Application 2020 & 2033
- Table 50: Germany Bio Acetic Acid Industry Volume (K Tons) Forecast, by Application 2020 & 2033
- Table 51: United Kingdom Bio Acetic Acid Industry Revenue (Million) Forecast, by Application 2020 & 2033
- Table 52: United Kingdom Bio Acetic Acid Industry Volume (K Tons) Forecast, by Application 2020 & 2033
- Table 53: Italy Bio Acetic Acid Industry Revenue (Million) Forecast, by Application 2020 & 2033
- Table 54: Italy Bio Acetic Acid Industry Volume (K Tons) Forecast, by Application 2020 & 2033
- Table 55: France Bio Acetic Acid Industry Revenue (Million) Forecast, by Application 2020 & 2033
- Table 56: France Bio Acetic Acid Industry Volume (K Tons) Forecast, by Application 2020 & 2033
- Table 57: Spain Bio Acetic Acid Industry Revenue (Million) Forecast, by Application 2020 & 2033
- Table 58: Spain Bio Acetic Acid Industry Volume (K Tons) Forecast, by Application 2020 & 2033
- Table 59: NORDIC Countries Bio Acetic Acid Industry Revenue (Million) Forecast, by Application 2020 & 2033
- Table 60: NORDIC Countries Bio Acetic Acid Industry Volume (K Tons) Forecast, by Application 2020 & 2033
- Table 61: Turkey Bio Acetic Acid Industry Revenue (Million) Forecast, by Application 2020 & 2033
- Table 62: Turkey Bio Acetic Acid Industry Volume (K Tons) Forecast, by Application 2020 & 2033
- Table 63: Russia Bio Acetic Acid Industry Revenue (Million) Forecast, by Application 2020 & 2033
- Table 64: Russia Bio Acetic Acid Industry Volume (K Tons) Forecast, by Application 2020 & 2033
- Table 65: Rest of Europe Bio Acetic Acid Industry Revenue (Million) Forecast, by Application 2020 & 2033
- Table 66: Rest of Europe Bio Acetic Acid Industry Volume (K Tons) Forecast, by Application 2020 & 2033
- Table 67: Global Bio Acetic Acid Industry Revenue Million Forecast, by Raw Material 2020 & 2033
- Table 68: Global Bio Acetic Acid Industry Volume K Tons Forecast, by Raw Material 2020 & 2033
- Table 69: Global Bio Acetic Acid Industry Revenue Million Forecast, by Application 2020 & 2033
- Table 70: Global Bio Acetic Acid Industry Volume K Tons Forecast, by Application 2020 & 2033
- Table 71: Global Bio Acetic Acid Industry Revenue Million Forecast, by Country 2020 & 2033
- Table 72: Global Bio Acetic Acid Industry Volume K Tons Forecast, by Country 2020 & 2033
- Table 73: Brazil Bio Acetic Acid Industry Revenue (Million) Forecast, by Application 2020 & 2033
- Table 74: Brazil Bio Acetic Acid Industry Volume (K Tons) Forecast, by Application 2020 & 2033
- Table 75: Argentina Bio Acetic Acid Industry Revenue (Million) Forecast, by Application 2020 & 2033
- Table 76: Argentina Bio Acetic Acid Industry Volume (K Tons) Forecast, by Application 2020 & 2033
- Table 77: Colombia Bio Acetic Acid Industry Revenue (Million) Forecast, by Application 2020 & 2033
- Table 78: Colombia Bio Acetic Acid Industry Volume (K Tons) Forecast, by Application 2020 & 2033
- Table 79: Rest of South America Bio Acetic Acid Industry Revenue (Million) Forecast, by Application 2020 & 2033
- Table 80: Rest of South America Bio Acetic Acid Industry Volume (K Tons) Forecast, by Application 2020 & 2033
- Table 81: Global Bio Acetic Acid Industry Revenue Million Forecast, by Raw Material 2020 & 2033
- Table 82: Global Bio Acetic Acid Industry Volume K Tons Forecast, by Raw Material 2020 & 2033
- Table 83: Global Bio Acetic Acid Industry Revenue Million Forecast, by Application 2020 & 2033
- Table 84: Global Bio Acetic Acid Industry Volume K Tons Forecast, by Application 2020 & 2033
- Table 85: Global Bio Acetic Acid Industry Revenue Million Forecast, by Country 2020 & 2033
- Table 86: Global Bio Acetic Acid Industry Volume K Tons Forecast, by Country 2020 & 2033
- Table 87: Qatar Bio Acetic Acid Industry Revenue (Million) Forecast, by Application 2020 & 2033
- Table 88: Qatar Bio Acetic Acid Industry Volume (K Tons) Forecast, by Application 2020 & 2033
- Table 89: United Arab Emirates Bio Acetic Acid Industry Revenue (Million) Forecast, by Application 2020 & 2033
- Table 90: United Arab Emirates Bio Acetic Acid Industry Volume (K Tons) Forecast, by Application 2020 & 2033
- Table 91: Nigeria Bio Acetic Acid Industry Revenue (Million) Forecast, by Application 2020 & 2033
- Table 92: Nigeria Bio Acetic Acid Industry Volume (K Tons) Forecast, by Application 2020 & 2033
- Table 93: Egypt Bio Acetic Acid Industry Revenue (Million) Forecast, by Application 2020 & 2033
- Table 94: Egypt Bio Acetic Acid Industry Volume (K Tons) Forecast, by Application 2020 & 2033
- Table 95: South Africa Bio Acetic Acid Industry Revenue (Million) Forecast, by Application 2020 & 2033
- Table 96: South Africa Bio Acetic Acid Industry Volume (K Tons) Forecast, by Application 2020 & 2033
- Table 97: Rest of Middle East and Africa Bio Acetic Acid Industry Revenue (Million) Forecast, by Application 2020 & 2033
- Table 98: Rest of Middle East and Africa Bio Acetic Acid Industry Volume (K Tons) Forecast, by Application 2020 & 2033
- Table 99: Global Bio Acetic Acid Industry Revenue Million Forecast, by Raw Material 2020 & 2033
- Table 100: Global Bio Acetic Acid Industry Volume K Tons Forecast, by Raw Material 2020 & 2033
- Table 101: Global Bio Acetic Acid Industry Revenue Million Forecast, by Application 2020 & 2033
- Table 102: Global Bio Acetic Acid Industry Volume K Tons Forecast, by Application 2020 & 2033
- Table 103: Global Bio Acetic Acid Industry Revenue Million Forecast, by Country 2020 & 2033
- Table 104: Global Bio Acetic Acid Industry Volume K Tons Forecast, by Country 2020 & 2033
- Table 105: Saudi Arabia Bio Acetic Acid Industry Revenue (Million) Forecast, by Application 2020 & 2033
- Table 106: Saudi Arabia Bio Acetic Acid Industry Volume (K Tons) Forecast, by Application 2020 & 2033
- Table 107: South Africa Bio Acetic Acid Industry Revenue (Million) Forecast, by Application 2020 & 2033
- Table 108: South Africa Bio Acetic Acid Industry Volume (K Tons) Forecast, by Application 2020 & 2033
- Table 109: Rest of Middle East and Africa Bio Acetic Acid Industry Revenue (Million) Forecast, by Application 2020 & 2033
- Table 110: Rest of Middle East and Africa Bio Acetic Acid Industry Volume (K Tons) Forecast, by Application 2020 & 2033
Frequently Asked Questions
1. What is the projected Compound Annual Growth Rate (CAGR) of the Bio Acetic Acid Industry?
The projected CAGR is approximately > 4.00%.
2. Which companies are prominent players in the Bio Acetic Acid Industry?
Key companies in the market include AFYREN SA*List Not Exhaustive, SUCROAL S A, Cargill Incorporated, Novozymes, Zea, LanzaTech, GODAVARI BIOREFINERIES LTD, btgbioliquids, Airedale Chemical Company Limited, BASF SE.
3. What are the main segments of the Bio Acetic Acid Industry?
The market segments include Raw Material, Application.
4. Can you provide details about the market size?
The market size is estimated to be USD 220.6 Million as of 2022.
5. What are some drivers contributing to market growth?
Rising Crude Oil Prices; Increasing Demand for Vinyl Acetate Monomer (VAM).
6. What are the notable trends driving market growth?
Vinyl Acetate Monomer (VAM) Segment to Dominate the Market.
7. Are there any restraints impacting market growth?
Scarcity and Social Constraints for Raw Materials; Environmental Concerns Regarding the Harmful Effects.
8. Can you provide examples of recent developments in the market?
July 2022: Novozymes launched Innova Apex and Innova Turbo, advanced yeast solutions that can tolerate up to 0.6% lactic acid and 0.4% acetic acid and 0.8% lactic acid, and 0.4% acetic acid, respectively. The solutions are tailored to work in specific fermentation times, enabling ethanol producers to maximize their fermentation process to achieve their desired production targets.
9. What pricing options are available for accessing the report?
Pricing options include single-user, multi-user, and enterprise licenses priced at USD 4750, USD 5250, and USD 8750 respectively.
10. Is the market size provided in terms of value or volume?
The market size is provided in terms of value, measured in Million and volume, measured in K Tons.
11. Are there any specific market keywords associated with the report?
Yes, the market keyword associated with the report is "Bio Acetic Acid Industry," which aids in identifying and referencing the specific market segment covered.
12. How do I determine which pricing option suits my needs best?
The pricing options vary based on user requirements and access needs. Individual users may opt for single-user licenses, while businesses requiring broader access may choose multi-user or enterprise licenses for cost-effective access to the report.
13. Are there any additional resources or data provided in the Bio Acetic Acid Industry report?
While the report offers comprehensive insights, it's advisable to review the specific contents or supplementary materials provided to ascertain if additional resources or data are available.
14. How can I stay updated on further developments or reports in the Bio Acetic Acid Industry?
To stay informed about further developments, trends, and reports in the Bio Acetic Acid Industry, consider subscribing to industry newsletters, following relevant companies and organizations, or regularly checking reputable industry news sources and publications.
Methodology
Step 1 - Identification of Relevant Samples Size from Population Database


Step 2 - Approaches for Defining Global Market Size (Value, Volume* & Price*)

Note*: In applicable scenarios
Step 3 - Data Sources
Primary Research
- Web Analytics
- Survey Reports
- Research Institute
- Latest Research Reports
- Opinion Leaders
Secondary Research
- Annual Reports
- White Paper
- Latest Press Release
- Industry Association
- Paid Database
- Investor Presentations

Step 4 - Data Triangulation
Involves using different sources of information in order to increase the validity of a study
These sources are likely to be stakeholders in a program - participants, other researchers, program staff, other community members, and so on.
Then we put all data in single framework & apply various statistical tools to find out the dynamic on the market.
During the analysis stage, feedback from the stakeholder groups would be compared to determine areas of agreement as well as areas of divergence