Bio-based Polymers Market Market Strategies: Trends and Outlook 2025-2033

Bio-based Polymers Market by Type (Starch-based Plastics, Poly Lactic Acid (PLA), PolyHydroxy Alkanoates (PHA), Polyesters (PBS, PBAT, and PCL), Cellulose Derivatives), by Application (Agriculture, Textile, Electronics, Packaging, Healthcare, Other Applications), by Asia Pacific (China, India, Japan, South Korea, Rest of Asia Pacific), by North America (United States, Canada, Mexico), by Europe (Germany, United Kingdom, Italy, France, Rest of Europe), by Rest of World (Brazil, Saudi Arabia, Rest of the World) Forecast 2025-2033

Aug 8 2025
Base Year: 2024

180 Pages
Main Logo

Bio-based Polymers Market Market Strategies: Trends and Outlook 2025-2033


Home
Industries
Chemicals & Materials
sponsor image
sponsor image
sponsor image
sponsor image

Tailored for you

  • In-depth Analysis Tailored to Specified Regions or Segments
  • Company Profiles Customized to User Preferences
  • Comprehensive Insights Focused on Specific Segments or Regions
  • Customized Evaluation of Competitive Landscape to Meet Your Needs
  • Tailored Customization to Address Other Specific Requirements
Ask for customization


Key Insights

The bio-based polymers market is experiencing robust growth, driven by increasing environmental concerns, stringent regulations on conventional plastics, and the rising demand for sustainable materials across diverse sectors. The market's Compound Annual Growth Rate (CAGR) of 24.30% from 2019 to 2024 indicates a significant upward trajectory. This growth is fueled by several key factors, including the increasing adoption of bioplastics in packaging (particularly food packaging), the expanding textile industry's integration of bio-based materials for sustainable apparel, and the growing use of biopolymers in the agricultural sector for applications like mulch films and biodegradable plant pots. Furthermore, advancements in biopolymer technology are leading to the development of more cost-effective and performance-competitive materials, broadening their applications and appeal across various industries. Major players such as Novamont, NatureWorks, and BASF are actively investing in research and development, expanding their product portfolios, and establishing strategic partnerships to capitalize on this burgeoning market. While challenges such as higher production costs compared to conventional plastics remain, ongoing innovations and government incentives aimed at promoting sustainable practices are mitigating these limitations, accelerating market expansion.
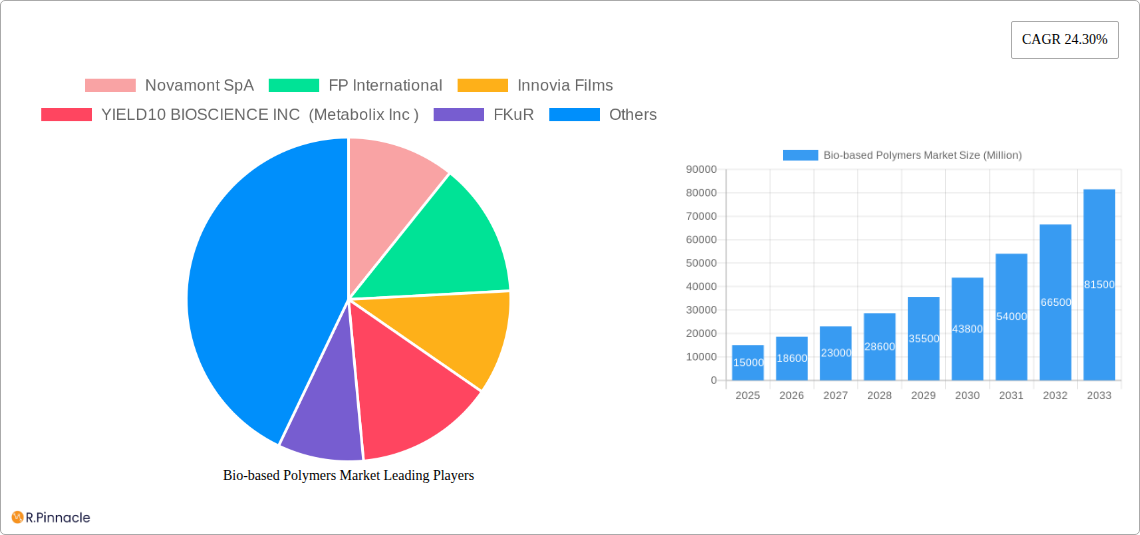
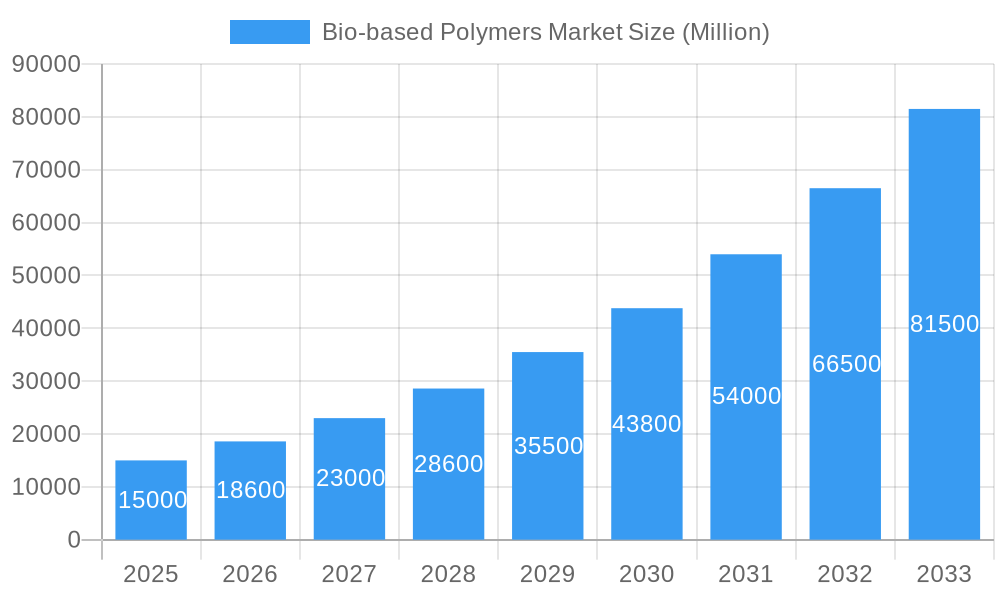
The segmentation of the bio-based polymers market reveals significant opportunities within specific application areas. Starch-based plastics and Poly Lactic Acid (PLA) currently dominate the market due to their established production processes and wide range of applications. However, PolyHydroxy Alkanoates (PHA) and other emerging biopolymers are gaining traction due to their superior biodegradability and potential in high-value applications. Geographically, North America and Europe currently hold substantial market shares, driven by strong environmental regulations and consumer awareness. However, the Asia-Pacific region is anticipated to experience the fastest growth rate, owing to its large and expanding population, increasing industrialization, and rising demand for sustainable packaging and consumer goods. This region's growth will be further driven by substantial investments in manufacturing facilities and supportive government policies promoting the adoption of eco-friendly materials. The long-term outlook for the bio-based polymers market is extremely positive, with continued growth projected throughout the forecast period (2025-2033), primarily due to the intensifying global focus on sustainability and the need for environmentally friendly alternatives to traditional petroleum-based plastics.

Bio-based Polymers Market Research Report - Market Size, Growth & Forecast

Bio-based Polymers Market Report: 2019-2033 Forecast

This comprehensive report provides an in-depth analysis of the Bio-based Polymers Market, offering invaluable insights for industry professionals, investors, and strategic decision-makers. Covering the period 2019-2033, with a focus on 2025, this report meticulously examines market dynamics, innovation trends, leading players, and future growth potential. The market is projected to reach xx Million by 2033, exhibiting a robust CAGR of xx% during the forecast period (2025-2033).

Bio-based Polymers Market Market Structure & Innovation Trends

This section analyzes the competitive landscape of the Bio-based Polymers market, focusing on market concentration, innovation drivers, regulatory frameworks, and M&A activities. The market exhibits a moderately concentrated structure, with key players like Novamont SpA, FP International, and Innovia Films holding significant market share. However, the emergence of several smaller, innovative companies is increasing competition. Innovation is driven by the need for sustainable alternatives to petroleum-based polymers, stringent environmental regulations, and consumer demand for eco-friendly products. Mergers and acquisitions are frequent, with deal values reaching xx Million in recent years, as companies strategically consolidate their positions and access new technologies. The average market share of the top 5 players in 2024 was xx%.

  • Market Concentration: Moderately concentrated, with a few major players dominating.
  • Innovation Drivers: Sustainability concerns, environmental regulations, consumer demand.
  • Regulatory Framework: Stringent regulations promoting bio-based materials are driving growth.
  • Product Substitutes: Competition from other sustainable materials, but bio-based polymers offer unique advantages.
  • M&A Activity: Significant M&A activity observed, with deal values reaching xx Million annually.
Bio-based Polymers Market Growth

Bio-based Polymers Market Market Dynamics & Trends

The Bio-based Polymers market is experiencing robust growth, driven by increasing environmental concerns, government support for renewable materials, and technological advancements. The market's growth is further fueled by rising consumer awareness of sustainability and the demand for eco-friendly packaging and products across various sectors. Technological disruptions, such as advancements in bio-polymer synthesis and processing techniques, are continuously improving product performance and reducing costs, contributing to market expansion. The Packaging application segment is expected to be the leading segment with a market penetration rate of xx%. The global market is anticipated to grow at a CAGR of xx% from 2025 to 2033. Competitive dynamics are intense, with established players and new entrants vying for market share through innovation, strategic partnerships, and aggressive marketing strategies.

Bio-based Polymers Market Growth

Dominant Regions & Segments in Bio-based Polymers Market

The Bio-based Polymers market is geographically diverse, with significant regional variations in growth rates and market share. While specific country-level data will be included in the full report, Europe and North America currently hold leading positions due to strong environmental regulations, robust research & development activities, and high consumer awareness. Asia-Pacific is emerging as a high-growth region, driven by rapid industrialization and increasing disposable income.

  • Leading Regions: Europe and North America currently lead, with Asia-Pacific showing rapid growth.
  • Dominant Segments by Type: Poly Lactic Acid (PLA) holds the largest market share due to its versatility and established production capacity.
  • Dominant Segments by Application: Packaging is the leading application segment, followed by agriculture and textiles.

Key Drivers:

  • Europe: Stringent environmental policies and a strong focus on sustainability.
  • North America: High consumer demand for sustainable products and significant R&D investment.
  • Asia-Pacific: Rapid industrialization, increasing disposable incomes, and growing demand for eco-friendly alternatives.

Bio-based Polymers Market Product Innovations

Recent product innovations in the bio-based polymers market focus on enhancing material properties, such as strength, flexibility, and biodegradability. New technologies are improving the processability and cost-effectiveness of bio-based polymers, expanding their applicability in various sectors. Companies are developing specialized bio-polymers tailored to specific application requirements, resulting in improved performance and market competitiveness. For example, the development of compostable PLA films for packaging applications significantly broadens the market scope.

Report Scope & Segmentation Analysis

This report provides a comprehensive segmentation analysis of the Bio-based Polymers market based on type and application.

By Type:

  • Starch-based Plastics: The market for starch-based plastics is projected to experience growth at a CAGR of xx% during the forecast period due to their biodegradability and low cost.
  • Poly Lactic Acid (PLA): This segment dominates the market due to its versatility and established production capacity. It is expected to grow at a CAGR of xx%.
  • PolyHydroxyalkanoates (PHA): The PHA segment is expected to witness significant growth due to its high biodegradability and biocompatibility, with a CAGR of xx%.
  • Polyesters (PBS, PBAT, and PCL): This segment is experiencing steady growth owing to increasing demand from various applications, showing a projected CAGR of xx%.
  • Cellulose Derivatives: This segment shows stable growth driven by its application in various industries with a projected CAGR of xx%.

By Application:

  • Packaging: This segment is the largest and fastest-growing, owing to the increasing demand for eco-friendly packaging solutions.
  • Agriculture: Growing use in films, mulches, and other agricultural applications drives the segment's growth.
  • Textiles: Demand for sustainable and biodegradable textiles is propelling segment growth.
  • Electronics: Use in electronic components and packaging is creating new opportunities.
  • Healthcare: Biocompatibility and biodegradability are driving growth in medical applications.
  • Other Applications: This segment includes various other applications such as 3D printing and automotive components.

Key Drivers of Bio-based Polymers Market Growth

The Bio-based Polymers market is experiencing considerable growth fueled by several key factors. Increasing environmental concerns and the push for sustainable alternatives to traditional plastics are major drivers. Government regulations and incentives aimed at promoting renewable materials further boost market expansion. Technological advancements in bio-polymer production and processing are leading to cost reductions and improved material properties, enhancing market appeal. Rising consumer demand for eco-friendly products across various sectors is also a significant contributing factor.

Challenges in the Bio-based Polymers Market Sector

Despite the positive outlook, the Bio-based Polymers market faces several challenges. High production costs compared to petroleum-based polymers remain a significant barrier. Supply chain inconsistencies and the limited availability of feedstock can also constrain market growth. Competition from traditional plastics and other sustainable materials poses a challenge to market penetration. Furthermore, inconsistent biodegradability and difficulties in recycling some bio-based polymers are potential obstacles. These challenges translate to a xx% reduction in market penetration rate compared to expected values.

Emerging Opportunities in Bio-based Polymers Market

The Bio-based Polymers market presents several promising opportunities. The development of new bio-based polymers with enhanced properties is opening up new applications. Growing demand for sustainable materials in emerging markets presents significant growth potential. Advancements in bio-refinery technologies are reducing production costs and enhancing the sustainability of feedstock. Strategic partnerships between bio-polymer producers and end-users are creating new market opportunities and accelerating the adoption of bio-based materials.

Leading Players in the Bio-based Polymers Market Market

  • Novamont SpA
  • FP International
  • Innovia Films
  • YIELD10 BIOSCIENCE INC (Metabolix Inc)
  • FKuR
  • Merck KGaA
  • Cardia Bioplastics
  • Rodenburg Biopolymers
  • Covestro AG
  • NatureWorks LLC
  • thyssenkrupp AG
  • DuPont de Nemours Inc
  • Biologische Naturverpackungen GmbH & Co KG
  • Corbion
  • Cortec Group Management Services LLC
  • SHOWA DENKO K K
  • BASF SE

Key Developments in Bio-based Polymers Market Industry

  • January 2023: Company X launched a new bio-based polymer with enhanced strength and flexibility.
  • June 2022: Companies Y and Z announced a strategic partnership to develop new bio-based packaging solutions.
  • November 2021: Company A acquired Company B, expanding its market share in the bio-based polymers sector. (Further key developments will be detailed in the full report.)

Future Outlook for Bio-based Polymers Market Market

The future outlook for the Bio-based Polymers market is highly positive. Continuous technological advancements, coupled with increasing environmental awareness and stringent regulations, will drive significant market growth. The expansion of applications into new sectors, such as electronics and automotive, offers considerable potential. Strategic investments in bio-refinery infrastructure and research and development will further enhance market expansion. The market is expected to witness substantial growth driven by a combination of factors, including regulatory support and the growing demand for sustainable materials.

Bio-based Polymers Market Segmentation

  • 1. Type
    • 1.1. Starch-based Plastics
    • 1.2. Poly Lactic Acid (PLA)
    • 1.3. PolyHydroxy Alkanoates (PHA)
    • 1.4. Polyesters (PBS, PBAT, and PCL)
    • 1.5. Cellulose Derivatives
  • 2. Application
    • 2.1. Agriculture
    • 2.2. Textile
    • 2.3. Electronics
    • 2.4. Packaging
    • 2.5. Healthcare
    • 2.6. Other Applications

Bio-based Polymers Market Segmentation By Geography

  • 1. Asia Pacific
    • 1.1. China
    • 1.2. India
    • 1.3. Japan
    • 1.4. South Korea
    • 1.5. Rest of Asia Pacific
  • 2. North America
    • 2.1. United States
    • 2.2. Canada
    • 2.3. Mexico
  • 3. Europe
    • 3.1. Germany
    • 3.2. United Kingdom
    • 3.3. Italy
    • 3.4. France
    • 3.5. Rest of Europe
  • 4. Rest of World
    • 4.1. Brazil
    • 4.2. Saudi Arabia
    • 4.3. Rest of the World
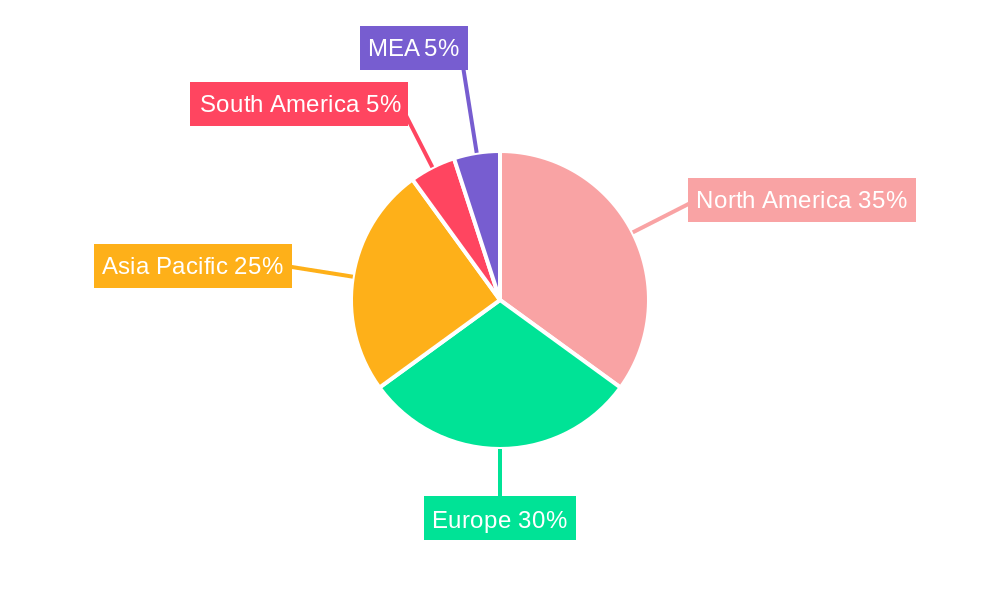
Bio-based Polymers Market Regional Share


Bio-based Polymers Market REPORT HIGHLIGHTS

AspectsDetails
Study Period 2019-2033
Base Year 2024
Estimated Year 2025
Forecast Period2025-2033
Historical Period2019-2024
Growth RateCAGR of 24.30% from 2019-2033
Segmentation
    • By Type
      • Starch-based Plastics
      • Poly Lactic Acid (PLA)
      • PolyHydroxy Alkanoates (PHA)
      • Polyesters (PBS, PBAT, and PCL)
      • Cellulose Derivatives
    • By Application
      • Agriculture
      • Textile
      • Electronics
      • Packaging
      • Healthcare
      • Other Applications
  • By Geography
    • Asia Pacific
      • China
      • India
      • Japan
      • South Korea
      • Rest of Asia Pacific
    • North America
      • United States
      • Canada
      • Mexico
    • Europe
      • Germany
      • United Kingdom
      • Italy
      • France
      • Rest of Europe
    • Rest of World
      • Brazil
      • Saudi Arabia
      • Rest of the World


Table of Contents

  1. 1. Introduction
    • 1.1. Research Scope
    • 1.2. Market Segmentation
    • 1.3. Research Methodology
    • 1.4. Definitions and Assumptions
  2. 2. Executive Summary
    • 2.1. Introduction
  3. 3. Market Dynamics
    • 3.1. Introduction
      • 3.2. Market Drivers
        • 3.2.1. Preference toward Eco-friendly Polymers to Preserve Environment; Regulation on Non-degradable Polymers in Many Countries; Increasing Consumer Awareness in Developed and Developing Nations; Non-toxic Nature of Biodegradable Polymers
      • 3.3. Market Restrains
        • 3.3.1. Higher Price Compared to Petroleum-based polymers; Low Awareness in Low Income Countries
      • 3.4. Market Trends
        • 3.4.1. Increasing Demand from Packaging Industry
  4. 4. Market Factor Analysis
    • 4.1. Porters Five Forces
    • 4.2. Supply/Value Chain
    • 4.3. PESTEL analysis
    • 4.4. Market Entropy
    • 4.5. Patent/Trademark Analysis
  5. 5. Global Bio-based Polymers Market Analysis, Insights and Forecast, 2019-2031
    • 5.1. Market Analysis, Insights and Forecast - by Type
      • 5.1.1. Starch-based Plastics
      • 5.1.2. Poly Lactic Acid (PLA)
      • 5.1.3. PolyHydroxy Alkanoates (PHA)
      • 5.1.4. Polyesters (PBS, PBAT, and PCL)
      • 5.1.5. Cellulose Derivatives
    • 5.2. Market Analysis, Insights and Forecast - by Application
      • 5.2.1. Agriculture
      • 5.2.2. Textile
      • 5.2.3. Electronics
      • 5.2.4. Packaging
      • 5.2.5. Healthcare
      • 5.2.6. Other Applications
    • 5.3. Market Analysis, Insights and Forecast - by Region
      • 5.3.1. Asia Pacific
      • 5.3.2. North America
      • 5.3.3. Europe
      • 5.3.4. Rest of World
  6. 6. Asia Pacific Bio-based Polymers Market Analysis, Insights and Forecast, 2019-2031
    • 6.1. Market Analysis, Insights and Forecast - by Type
      • 6.1.1. Starch-based Plastics
      • 6.1.2. Poly Lactic Acid (PLA)
      • 6.1.3. PolyHydroxy Alkanoates (PHA)
      • 6.1.4. Polyesters (PBS, PBAT, and PCL)
      • 6.1.5. Cellulose Derivatives
    • 6.2. Market Analysis, Insights and Forecast - by Application
      • 6.2.1. Agriculture
      • 6.2.2. Textile
      • 6.2.3. Electronics
      • 6.2.4. Packaging
      • 6.2.5. Healthcare
      • 6.2.6. Other Applications
  7. 7. North America Bio-based Polymers Market Analysis, Insights and Forecast, 2019-2031
    • 7.1. Market Analysis, Insights and Forecast - by Type
      • 7.1.1. Starch-based Plastics
      • 7.1.2. Poly Lactic Acid (PLA)
      • 7.1.3. PolyHydroxy Alkanoates (PHA)
      • 7.1.4. Polyesters (PBS, PBAT, and PCL)
      • 7.1.5. Cellulose Derivatives
    • 7.2. Market Analysis, Insights and Forecast - by Application
      • 7.2.1. Agriculture
      • 7.2.2. Textile
      • 7.2.3. Electronics
      • 7.2.4. Packaging
      • 7.2.5. Healthcare
      • 7.2.6. Other Applications
  8. 8. Europe Bio-based Polymers Market Analysis, Insights and Forecast, 2019-2031
    • 8.1. Market Analysis, Insights and Forecast - by Type
      • 8.1.1. Starch-based Plastics
      • 8.1.2. Poly Lactic Acid (PLA)
      • 8.1.3. PolyHydroxy Alkanoates (PHA)
      • 8.1.4. Polyesters (PBS, PBAT, and PCL)
      • 8.1.5. Cellulose Derivatives
    • 8.2. Market Analysis, Insights and Forecast - by Application
      • 8.2.1. Agriculture
      • 8.2.2. Textile
      • 8.2.3. Electronics
      • 8.2.4. Packaging
      • 8.2.5. Healthcare
      • 8.2.6. Other Applications
  9. 9. Rest of World Bio-based Polymers Market Analysis, Insights and Forecast, 2019-2031
    • 9.1. Market Analysis, Insights and Forecast - by Type
      • 9.1.1. Starch-based Plastics
      • 9.1.2. Poly Lactic Acid (PLA)
      • 9.1.3. PolyHydroxy Alkanoates (PHA)
      • 9.1.4. Polyesters (PBS, PBAT, and PCL)
      • 9.1.5. Cellulose Derivatives
    • 9.2. Market Analysis, Insights and Forecast - by Application
      • 9.2.1. Agriculture
      • 9.2.2. Textile
      • 9.2.3. Electronics
      • 9.2.4. Packaging
      • 9.2.5. Healthcare
      • 9.2.6. Other Applications
  10. 10. North America Bio-based Polymers Market Analysis, Insights and Forecast, 2019-2031
      • 10.1. Market Analysis, Insights and Forecast - By Country/Sub-region
        • 10.1.1 United States
        • 10.1.2 Canada
        • 10.1.3 Mexico
  11. 11. Europe Bio-based Polymers Market Analysis, Insights and Forecast, 2019-2031
      • 11.1. Market Analysis, Insights and Forecast - By Country/Sub-region
        • 11.1.1 Germany
        • 11.1.2 United Kingdom
        • 11.1.3 France
        • 11.1.4 Spain
        • 11.1.5 Italy
        • 11.1.6 Spain
        • 11.1.7 Belgium
        • 11.1.8 Netherland
        • 11.1.9 Nordics
        • 11.1.10 Rest of Europe
  12. 12. Asia Pacific Bio-based Polymers Market Analysis, Insights and Forecast, 2019-2031
      • 12.1. Market Analysis, Insights and Forecast - By Country/Sub-region
        • 12.1.1 China
        • 12.1.2 Japan
        • 12.1.3 India
        • 12.1.4 South Korea
        • 12.1.5 Southeast Asia
        • 12.1.6 Australia
        • 12.1.7 Indonesia
        • 12.1.8 Phillipes
        • 12.1.9 Singapore
        • 12.1.10 Thailandc
        • 12.1.11 Rest of Asia Pacific
  13. 13. South America Bio-based Polymers Market Analysis, Insights and Forecast, 2019-2031
      • 13.1. Market Analysis, Insights and Forecast - By Country/Sub-region
        • 13.1.1 Brazil
        • 13.1.2 Argentina
        • 13.1.3 Peru
        • 13.1.4 Chile
        • 13.1.5 Colombia
        • 13.1.6 Ecuador
        • 13.1.7 Venezuela
        • 13.1.8 Rest of South America
  14. 14. North America Bio-based Polymers Market Analysis, Insights and Forecast, 2019-2031
      • 14.1. Market Analysis, Insights and Forecast - By Country/Sub-region
        • 14.1.1 United States
        • 14.1.2 Canada
        • 14.1.3 Mexico
  15. 15. MEA Bio-based Polymers Market Analysis, Insights and Forecast, 2019-2031
      • 15.1. Market Analysis, Insights and Forecast - By Country/Sub-region
        • 15.1.1 United Arab Emirates
        • 15.1.2 Saudi Arabia
        • 15.1.3 South Africa
        • 15.1.4 Rest of Middle East and Africa
  16. 16. Competitive Analysis
    • 16.1. Global Market Share Analysis 2024
      • 16.2. Company Profiles
        • 16.2.1 Novamont SpA
          • 16.2.1.1. Overview
          • 16.2.1.2. Products
          • 16.2.1.3. SWOT Analysis
          • 16.2.1.4. Recent Developments
          • 16.2.1.5. Financials (Based on Availability)
        • 16.2.2 FP International
          • 16.2.2.1. Overview
          • 16.2.2.2. Products
          • 16.2.2.3. SWOT Analysis
          • 16.2.2.4. Recent Developments
          • 16.2.2.5. Financials (Based on Availability)
        • 16.2.3 Innovia Films
          • 16.2.3.1. Overview
          • 16.2.3.2. Products
          • 16.2.3.3. SWOT Analysis
          • 16.2.3.4. Recent Developments
          • 16.2.3.5. Financials (Based on Availability)
        • 16.2.4 YIELD10 BIOSCIENCE INC (Metabolix Inc )
          • 16.2.4.1. Overview
          • 16.2.4.2. Products
          • 16.2.4.3. SWOT Analysis
          • 16.2.4.4. Recent Developments
          • 16.2.4.5. Financials (Based on Availability)
        • 16.2.5 FKuR
          • 16.2.5.1. Overview
          • 16.2.5.2. Products
          • 16.2.5.3. SWOT Analysis
          • 16.2.5.4. Recent Developments
          • 16.2.5.5. Financials (Based on Availability)
        • 16.2.6 Merck KGaA
          • 16.2.6.1. Overview
          • 16.2.6.2. Products
          • 16.2.6.3. SWOT Analysis
          • 16.2.6.4. Recent Developments
          • 16.2.6.5. Financials (Based on Availability)
        • 16.2.7 Cardia Bioplastics
          • 16.2.7.1. Overview
          • 16.2.7.2. Products
          • 16.2.7.3. SWOT Analysis
          • 16.2.7.4. Recent Developments
          • 16.2.7.5. Financials (Based on Availability)
        • 16.2.8 Rodenburg Biopolymers
          • 16.2.8.1. Overview
          • 16.2.8.2. Products
          • 16.2.8.3. SWOT Analysis
          • 16.2.8.4. Recent Developments
          • 16.2.8.5. Financials (Based on Availability)
        • 16.2.9 Covestro AG
          • 16.2.9.1. Overview
          • 16.2.9.2. Products
          • 16.2.9.3. SWOT Analysis
          • 16.2.9.4. Recent Developments
          • 16.2.9.5. Financials (Based on Availability)
        • 16.2.10 NatureWorks LLC
          • 16.2.10.1. Overview
          • 16.2.10.2. Products
          • 16.2.10.3. SWOT Analysis
          • 16.2.10.4. Recent Developments
          • 16.2.10.5. Financials (Based on Availability)
        • 16.2.11 thyssenkrupp AG*List Not Exhaustive
          • 16.2.11.1. Overview
          • 16.2.11.2. Products
          • 16.2.11.3. SWOT Analysis
          • 16.2.11.4. Recent Developments
          • 16.2.11.5. Financials (Based on Availability)
        • 16.2.12 DuPont de Nemours Inc
          • 16.2.12.1. Overview
          • 16.2.12.2. Products
          • 16.2.12.3. SWOT Analysis
          • 16.2.12.4. Recent Developments
          • 16.2.12.5. Financials (Based on Availability)
        • 16.2.13 Biologische Naturverpackungen GmbH & Co KG
          • 16.2.13.1. Overview
          • 16.2.13.2. Products
          • 16.2.13.3. SWOT Analysis
          • 16.2.13.4. Recent Developments
          • 16.2.13.5. Financials (Based on Availability)
        • 16.2.14 Corbion
          • 16.2.14.1. Overview
          • 16.2.14.2. Products
          • 16.2.14.3. SWOT Analysis
          • 16.2.14.4. Recent Developments
          • 16.2.14.5. Financials (Based on Availability)
        • 16.2.15 Cortec Group Management Services LLC
          • 16.2.15.1. Overview
          • 16.2.15.2. Products
          • 16.2.15.3. SWOT Analysis
          • 16.2.15.4. Recent Developments
          • 16.2.15.5. Financials (Based on Availability)
        • 16.2.16 SHOWA DENKO K K
          • 16.2.16.1. Overview
          • 16.2.16.2. Products
          • 16.2.16.3. SWOT Analysis
          • 16.2.16.4. Recent Developments
          • 16.2.16.5. Financials (Based on Availability)
        • 16.2.17 BASF SE
          • 16.2.17.1. Overview
          • 16.2.17.2. Products
          • 16.2.17.3. SWOT Analysis
          • 16.2.17.4. Recent Developments
          • 16.2.17.5. Financials (Based on Availability)

List of Figures

  1. Figure 1: Global Bio-based Polymers Market Revenue Breakdown (Million, %) by Region 2024 & 2032
  2. Figure 2: Global Bio-based Polymers Market Volume Breakdown (Million, %) by Region 2024 & 2032
  3. Figure 3: North America Bio-based Polymers Market Revenue (Million), by Country 2024 & 2032
  4. Figure 4: North America Bio-based Polymers Market Volume (Million), by Country 2024 & 2032
  5. Figure 5: North America Bio-based Polymers Market Revenue Share (%), by Country 2024 & 2032
  6. Figure 6: North America Bio-based Polymers Market Volume Share (%), by Country 2024 & 2032
  7. Figure 7: Europe Bio-based Polymers Market Revenue (Million), by Country 2024 & 2032
  8. Figure 8: Europe Bio-based Polymers Market Volume (Million), by Country 2024 & 2032
  9. Figure 9: Europe Bio-based Polymers Market Revenue Share (%), by Country 2024 & 2032
  10. Figure 10: Europe Bio-based Polymers Market Volume Share (%), by Country 2024 & 2032
  11. Figure 11: Asia Pacific Bio-based Polymers Market Revenue (Million), by Country 2024 & 2032
  12. Figure 12: Asia Pacific Bio-based Polymers Market Volume (Million), by Country 2024 & 2032
  13. Figure 13: Asia Pacific Bio-based Polymers Market Revenue Share (%), by Country 2024 & 2032
  14. Figure 14: Asia Pacific Bio-based Polymers Market Volume Share (%), by Country 2024 & 2032
  15. Figure 15: South America Bio-based Polymers Market Revenue (Million), by Country 2024 & 2032
  16. Figure 16: South America Bio-based Polymers Market Volume (Million), by Country 2024 & 2032
  17. Figure 17: South America Bio-based Polymers Market Revenue Share (%), by Country 2024 & 2032
  18. Figure 18: South America Bio-based Polymers Market Volume Share (%), by Country 2024 & 2032
  19. Figure 19: North America Bio-based Polymers Market Revenue (Million), by Country 2024 & 2032
  20. Figure 20: North America Bio-based Polymers Market Volume (Million), by Country 2024 & 2032
  21. Figure 21: North America Bio-based Polymers Market Revenue Share (%), by Country 2024 & 2032
  22. Figure 22: North America Bio-based Polymers Market Volume Share (%), by Country 2024 & 2032
  23. Figure 23: MEA Bio-based Polymers Market Revenue (Million), by Country 2024 & 2032
  24. Figure 24: MEA Bio-based Polymers Market Volume (Million), by Country 2024 & 2032
  25. Figure 25: MEA Bio-based Polymers Market Revenue Share (%), by Country 2024 & 2032
  26. Figure 26: MEA Bio-based Polymers Market Volume Share (%), by Country 2024 & 2032
  27. Figure 27: Asia Pacific Bio-based Polymers Market Revenue (Million), by Type 2024 & 2032
  28. Figure 28: Asia Pacific Bio-based Polymers Market Volume (Million), by Type 2024 & 2032
  29. Figure 29: Asia Pacific Bio-based Polymers Market Revenue Share (%), by Type 2024 & 2032
  30. Figure 30: Asia Pacific Bio-based Polymers Market Volume Share (%), by Type 2024 & 2032
  31. Figure 31: Asia Pacific Bio-based Polymers Market Revenue (Million), by Application 2024 & 2032
  32. Figure 32: Asia Pacific Bio-based Polymers Market Volume (Million), by Application 2024 & 2032
  33. Figure 33: Asia Pacific Bio-based Polymers Market Revenue Share (%), by Application 2024 & 2032
  34. Figure 34: Asia Pacific Bio-based Polymers Market Volume Share (%), by Application 2024 & 2032
  35. Figure 35: Asia Pacific Bio-based Polymers Market Revenue (Million), by Country 2024 & 2032
  36. Figure 36: Asia Pacific Bio-based Polymers Market Volume (Million), by Country 2024 & 2032
  37. Figure 37: Asia Pacific Bio-based Polymers Market Revenue Share (%), by Country 2024 & 2032
  38. Figure 38: Asia Pacific Bio-based Polymers Market Volume Share (%), by Country 2024 & 2032
  39. Figure 39: North America Bio-based Polymers Market Revenue (Million), by Type 2024 & 2032
  40. Figure 40: North America Bio-based Polymers Market Volume (Million), by Type 2024 & 2032
  41. Figure 41: North America Bio-based Polymers Market Revenue Share (%), by Type 2024 & 2032
  42. Figure 42: North America Bio-based Polymers Market Volume Share (%), by Type 2024 & 2032
  43. Figure 43: North America Bio-based Polymers Market Revenue (Million), by Application 2024 & 2032
  44. Figure 44: North America Bio-based Polymers Market Volume (Million), by Application 2024 & 2032
  45. Figure 45: North America Bio-based Polymers Market Revenue Share (%), by Application 2024 & 2032
  46. Figure 46: North America Bio-based Polymers Market Volume Share (%), by Application 2024 & 2032
  47. Figure 47: North America Bio-based Polymers Market Revenue (Million), by Country 2024 & 2032
  48. Figure 48: North America Bio-based Polymers Market Volume (Million), by Country 2024 & 2032
  49. Figure 49: North America Bio-based Polymers Market Revenue Share (%), by Country 2024 & 2032
  50. Figure 50: North America Bio-based Polymers Market Volume Share (%), by Country 2024 & 2032
  51. Figure 51: Europe Bio-based Polymers Market Revenue (Million), by Type 2024 & 2032
  52. Figure 52: Europe Bio-based Polymers Market Volume (Million), by Type 2024 & 2032
  53. Figure 53: Europe Bio-based Polymers Market Revenue Share (%), by Type 2024 & 2032
  54. Figure 54: Europe Bio-based Polymers Market Volume Share (%), by Type 2024 & 2032
  55. Figure 55: Europe Bio-based Polymers Market Revenue (Million), by Application 2024 & 2032
  56. Figure 56: Europe Bio-based Polymers Market Volume (Million), by Application 2024 & 2032
  57. Figure 57: Europe Bio-based Polymers Market Revenue Share (%), by Application 2024 & 2032
  58. Figure 58: Europe Bio-based Polymers Market Volume Share (%), by Application 2024 & 2032
  59. Figure 59: Europe Bio-based Polymers Market Revenue (Million), by Country 2024 & 2032
  60. Figure 60: Europe Bio-based Polymers Market Volume (Million), by Country 2024 & 2032
  61. Figure 61: Europe Bio-based Polymers Market Revenue Share (%), by Country 2024 & 2032
  62. Figure 62: Europe Bio-based Polymers Market Volume Share (%), by Country 2024 & 2032
  63. Figure 63: Rest of World Bio-based Polymers Market Revenue (Million), by Type 2024 & 2032
  64. Figure 64: Rest of World Bio-based Polymers Market Volume (Million), by Type 2024 & 2032
  65. Figure 65: Rest of World Bio-based Polymers Market Revenue Share (%), by Type 2024 & 2032
  66. Figure 66: Rest of World Bio-based Polymers Market Volume Share (%), by Type 2024 & 2032
  67. Figure 67: Rest of World Bio-based Polymers Market Revenue (Million), by Application 2024 & 2032
  68. Figure 68: Rest of World Bio-based Polymers Market Volume (Million), by Application 2024 & 2032
  69. Figure 69: Rest of World Bio-based Polymers Market Revenue Share (%), by Application 2024 & 2032
  70. Figure 70: Rest of World Bio-based Polymers Market Volume Share (%), by Application 2024 & 2032
  71. Figure 71: Rest of World Bio-based Polymers Market Revenue (Million), by Country 2024 & 2032
  72. Figure 72: Rest of World Bio-based Polymers Market Volume (Million), by Country 2024 & 2032
  73. Figure 73: Rest of World Bio-based Polymers Market Revenue Share (%), by Country 2024 & 2032
  74. Figure 74: Rest of World Bio-based Polymers Market Volume Share (%), by Country 2024 & 2032

List of Tables

  1. Table 1: Global Bio-based Polymers Market Revenue Million Forecast, by Region 2019 & 2032
  2. Table 2: Global Bio-based Polymers Market Volume Million Forecast, by Region 2019 & 2032
  3. Table 3: Global Bio-based Polymers Market Revenue Million Forecast, by Type 2019 & 2032
  4. Table 4: Global Bio-based Polymers Market Volume Million Forecast, by Type 2019 & 2032
  5. Table 5: Global Bio-based Polymers Market Revenue Million Forecast, by Application 2019 & 2032
  6. Table 6: Global Bio-based Polymers Market Volume Million Forecast, by Application 2019 & 2032
  7. Table 7: Global Bio-based Polymers Market Revenue Million Forecast, by Region 2019 & 2032
  8. Table 8: Global Bio-based Polymers Market Volume Million Forecast, by Region 2019 & 2032
  9. Table 9: Global Bio-based Polymers Market Revenue Million Forecast, by Country 2019 & 2032
  10. Table 10: Global Bio-based Polymers Market Volume Million Forecast, by Country 2019 & 2032
  11. Table 11: United States Bio-based Polymers Market Revenue (Million) Forecast, by Application 2019 & 2032
  12. Table 12: United States Bio-based Polymers Market Volume (Million) Forecast, by Application 2019 & 2032
  13. Table 13: Canada Bio-based Polymers Market Revenue (Million) Forecast, by Application 2019 & 2032
  14. Table 14: Canada Bio-based Polymers Market Volume (Million) Forecast, by Application 2019 & 2032
  15. Table 15: Mexico Bio-based Polymers Market Revenue (Million) Forecast, by Application 2019 & 2032
  16. Table 16: Mexico Bio-based Polymers Market Volume (Million) Forecast, by Application 2019 & 2032
  17. Table 17: Global Bio-based Polymers Market Revenue Million Forecast, by Country 2019 & 2032
  18. Table 18: Global Bio-based Polymers Market Volume Million Forecast, by Country 2019 & 2032
  19. Table 19: Germany Bio-based Polymers Market Revenue (Million) Forecast, by Application 2019 & 2032
  20. Table 20: Germany Bio-based Polymers Market Volume (Million) Forecast, by Application 2019 & 2032
  21. Table 21: United Kingdom Bio-based Polymers Market Revenue (Million) Forecast, by Application 2019 & 2032
  22. Table 22: United Kingdom Bio-based Polymers Market Volume (Million) Forecast, by Application 2019 & 2032
  23. Table 23: France Bio-based Polymers Market Revenue (Million) Forecast, by Application 2019 & 2032
  24. Table 24: France Bio-based Polymers Market Volume (Million) Forecast, by Application 2019 & 2032
  25. Table 25: Spain Bio-based Polymers Market Revenue (Million) Forecast, by Application 2019 & 2032
  26. Table 26: Spain Bio-based Polymers Market Volume (Million) Forecast, by Application 2019 & 2032
  27. Table 27: Italy Bio-based Polymers Market Revenue (Million) Forecast, by Application 2019 & 2032
  28. Table 28: Italy Bio-based Polymers Market Volume (Million) Forecast, by Application 2019 & 2032
  29. Table 29: Spain Bio-based Polymers Market Revenue (Million) Forecast, by Application 2019 & 2032
  30. Table 30: Spain Bio-based Polymers Market Volume (Million) Forecast, by Application 2019 & 2032
  31. Table 31: Belgium Bio-based Polymers Market Revenue (Million) Forecast, by Application 2019 & 2032
  32. Table 32: Belgium Bio-based Polymers Market Volume (Million) Forecast, by Application 2019 & 2032
  33. Table 33: Netherland Bio-based Polymers Market Revenue (Million) Forecast, by Application 2019 & 2032
  34. Table 34: Netherland Bio-based Polymers Market Volume (Million) Forecast, by Application 2019 & 2032
  35. Table 35: Nordics Bio-based Polymers Market Revenue (Million) Forecast, by Application 2019 & 2032
  36. Table 36: Nordics Bio-based Polymers Market Volume (Million) Forecast, by Application 2019 & 2032
  37. Table 37: Rest of Europe Bio-based Polymers Market Revenue (Million) Forecast, by Application 2019 & 2032
  38. Table 38: Rest of Europe Bio-based Polymers Market Volume (Million) Forecast, by Application 2019 & 2032
  39. Table 39: Global Bio-based Polymers Market Revenue Million Forecast, by Country 2019 & 2032
  40. Table 40: Global Bio-based Polymers Market Volume Million Forecast, by Country 2019 & 2032
  41. Table 41: China Bio-based Polymers Market Revenue (Million) Forecast, by Application 2019 & 2032
  42. Table 42: China Bio-based Polymers Market Volume (Million) Forecast, by Application 2019 & 2032
  43. Table 43: Japan Bio-based Polymers Market Revenue (Million) Forecast, by Application 2019 & 2032
  44. Table 44: Japan Bio-based Polymers Market Volume (Million) Forecast, by Application 2019 & 2032
  45. Table 45: India Bio-based Polymers Market Revenue (Million) Forecast, by Application 2019 & 2032
  46. Table 46: India Bio-based Polymers Market Volume (Million) Forecast, by Application 2019 & 2032
  47. Table 47: South Korea Bio-based Polymers Market Revenue (Million) Forecast, by Application 2019 & 2032
  48. Table 48: South Korea Bio-based Polymers Market Volume (Million) Forecast, by Application 2019 & 2032
  49. Table 49: Southeast Asia Bio-based Polymers Market Revenue (Million) Forecast, by Application 2019 & 2032
  50. Table 50: Southeast Asia Bio-based Polymers Market Volume (Million) Forecast, by Application 2019 & 2032
  51. Table 51: Australia Bio-based Polymers Market Revenue (Million) Forecast, by Application 2019 & 2032
  52. Table 52: Australia Bio-based Polymers Market Volume (Million) Forecast, by Application 2019 & 2032
  53. Table 53: Indonesia Bio-based Polymers Market Revenue (Million) Forecast, by Application 2019 & 2032
  54. Table 54: Indonesia Bio-based Polymers Market Volume (Million) Forecast, by Application 2019 & 2032
  55. Table 55: Phillipes Bio-based Polymers Market Revenue (Million) Forecast, by Application 2019 & 2032
  56. Table 56: Phillipes Bio-based Polymers Market Volume (Million) Forecast, by Application 2019 & 2032
  57. Table 57: Singapore Bio-based Polymers Market Revenue (Million) Forecast, by Application 2019 & 2032
  58. Table 58: Singapore Bio-based Polymers Market Volume (Million) Forecast, by Application 2019 & 2032
  59. Table 59: Thailandc Bio-based Polymers Market Revenue (Million) Forecast, by Application 2019 & 2032
  60. Table 60: Thailandc Bio-based Polymers Market Volume (Million) Forecast, by Application 2019 & 2032
  61. Table 61: Rest of Asia Pacific Bio-based Polymers Market Revenue (Million) Forecast, by Application 2019 & 2032
  62. Table 62: Rest of Asia Pacific Bio-based Polymers Market Volume (Million) Forecast, by Application 2019 & 2032
  63. Table 63: Global Bio-based Polymers Market Revenue Million Forecast, by Country 2019 & 2032
  64. Table 64: Global Bio-based Polymers Market Volume Million Forecast, by Country 2019 & 2032
  65. Table 65: Brazil Bio-based Polymers Market Revenue (Million) Forecast, by Application 2019 & 2032
  66. Table 66: Brazil Bio-based Polymers Market Volume (Million) Forecast, by Application 2019 & 2032
  67. Table 67: Argentina Bio-based Polymers Market Revenue (Million) Forecast, by Application 2019 & 2032
  68. Table 68: Argentina Bio-based Polymers Market Volume (Million) Forecast, by Application 2019 & 2032
  69. Table 69: Peru Bio-based Polymers Market Revenue (Million) Forecast, by Application 2019 & 2032
  70. Table 70: Peru Bio-based Polymers Market Volume (Million) Forecast, by Application 2019 & 2032
  71. Table 71: Chile Bio-based Polymers Market Revenue (Million) Forecast, by Application 2019 & 2032
  72. Table 72: Chile Bio-based Polymers Market Volume (Million) Forecast, by Application 2019 & 2032
  73. Table 73: Colombia Bio-based Polymers Market Revenue (Million) Forecast, by Application 2019 & 2032
  74. Table 74: Colombia Bio-based Polymers Market Volume (Million) Forecast, by Application 2019 & 2032
  75. Table 75: Ecuador Bio-based Polymers Market Revenue (Million) Forecast, by Application 2019 & 2032
  76. Table 76: Ecuador Bio-based Polymers Market Volume (Million) Forecast, by Application 2019 & 2032
  77. Table 77: Venezuela Bio-based Polymers Market Revenue (Million) Forecast, by Application 2019 & 2032
  78. Table 78: Venezuela Bio-based Polymers Market Volume (Million) Forecast, by Application 2019 & 2032
  79. Table 79: Rest of South America Bio-based Polymers Market Revenue (Million) Forecast, by Application 2019 & 2032
  80. Table 80: Rest of South America Bio-based Polymers Market Volume (Million) Forecast, by Application 2019 & 2032
  81. Table 81: Global Bio-based Polymers Market Revenue Million Forecast, by Country 2019 & 2032
  82. Table 82: Global Bio-based Polymers Market Volume Million Forecast, by Country 2019 & 2032
  83. Table 83: United States Bio-based Polymers Market Revenue (Million) Forecast, by Application 2019 & 2032
  84. Table 84: United States Bio-based Polymers Market Volume (Million) Forecast, by Application 2019 & 2032
  85. Table 85: Canada Bio-based Polymers Market Revenue (Million) Forecast, by Application 2019 & 2032
  86. Table 86: Canada Bio-based Polymers Market Volume (Million) Forecast, by Application 2019 & 2032
  87. Table 87: Mexico Bio-based Polymers Market Revenue (Million) Forecast, by Application 2019 & 2032
  88. Table 88: Mexico Bio-based Polymers Market Volume (Million) Forecast, by Application 2019 & 2032
  89. Table 89: Global Bio-based Polymers Market Revenue Million Forecast, by Country 2019 & 2032
  90. Table 90: Global Bio-based Polymers Market Volume Million Forecast, by Country 2019 & 2032
  91. Table 91: United Arab Emirates Bio-based Polymers Market Revenue (Million) Forecast, by Application 2019 & 2032
  92. Table 92: United Arab Emirates Bio-based Polymers Market Volume (Million) Forecast, by Application 2019 & 2032
  93. Table 93: Saudi Arabia Bio-based Polymers Market Revenue (Million) Forecast, by Application 2019 & 2032
  94. Table 94: Saudi Arabia Bio-based Polymers Market Volume (Million) Forecast, by Application 2019 & 2032
  95. Table 95: South Africa Bio-based Polymers Market Revenue (Million) Forecast, by Application 2019 & 2032
  96. Table 96: South Africa Bio-based Polymers Market Volume (Million) Forecast, by Application 2019 & 2032
  97. Table 97: Rest of Middle East and Africa Bio-based Polymers Market Revenue (Million) Forecast, by Application 2019 & 2032
  98. Table 98: Rest of Middle East and Africa Bio-based Polymers Market Volume (Million) Forecast, by Application 2019 & 2032
  99. Table 99: Global Bio-based Polymers Market Revenue Million Forecast, by Type 2019 & 2032
  100. Table 100: Global Bio-based Polymers Market Volume Million Forecast, by Type 2019 & 2032
  101. Table 101: Global Bio-based Polymers Market Revenue Million Forecast, by Application 2019 & 2032
  102. Table 102: Global Bio-based Polymers Market Volume Million Forecast, by Application 2019 & 2032
  103. Table 103: Global Bio-based Polymers Market Revenue Million Forecast, by Country 2019 & 2032
  104. Table 104: Global Bio-based Polymers Market Volume Million Forecast, by Country 2019 & 2032
  105. Table 105: China Bio-based Polymers Market Revenue (Million) Forecast, by Application 2019 & 2032
  106. Table 106: China Bio-based Polymers Market Volume (Million) Forecast, by Application 2019 & 2032
  107. Table 107: India Bio-based Polymers Market Revenue (Million) Forecast, by Application 2019 & 2032
  108. Table 108: India Bio-based Polymers Market Volume (Million) Forecast, by Application 2019 & 2032
  109. Table 109: Japan Bio-based Polymers Market Revenue (Million) Forecast, by Application 2019 & 2032
  110. Table 110: Japan Bio-based Polymers Market Volume (Million) Forecast, by Application 2019 & 2032
  111. Table 111: South Korea Bio-based Polymers Market Revenue (Million) Forecast, by Application 2019 & 2032
  112. Table 112: South Korea Bio-based Polymers Market Volume (Million) Forecast, by Application 2019 & 2032
  113. Table 113: Rest of Asia Pacific Bio-based Polymers Market Revenue (Million) Forecast, by Application 2019 & 2032
  114. Table 114: Rest of Asia Pacific Bio-based Polymers Market Volume (Million) Forecast, by Application 2019 & 2032
  115. Table 115: Global Bio-based Polymers Market Revenue Million Forecast, by Type 2019 & 2032
  116. Table 116: Global Bio-based Polymers Market Volume Million Forecast, by Type 2019 & 2032
  117. Table 117: Global Bio-based Polymers Market Revenue Million Forecast, by Application 2019 & 2032
  118. Table 118: Global Bio-based Polymers Market Volume Million Forecast, by Application 2019 & 2032
  119. Table 119: Global Bio-based Polymers Market Revenue Million Forecast, by Country 2019 & 2032
  120. Table 120: Global Bio-based Polymers Market Volume Million Forecast, by Country 2019 & 2032
  121. Table 121: United States Bio-based Polymers Market Revenue (Million) Forecast, by Application 2019 & 2032
  122. Table 122: United States Bio-based Polymers Market Volume (Million) Forecast, by Application 2019 & 2032
  123. Table 123: Canada Bio-based Polymers Market Revenue (Million) Forecast, by Application 2019 & 2032
  124. Table 124: Canada Bio-based Polymers Market Volume (Million) Forecast, by Application 2019 & 2032
  125. Table 125: Mexico Bio-based Polymers Market Revenue (Million) Forecast, by Application 2019 & 2032
  126. Table 126: Mexico Bio-based Polymers Market Volume (Million) Forecast, by Application 2019 & 2032
  127. Table 127: Global Bio-based Polymers Market Revenue Million Forecast, by Type 2019 & 2032
  128. Table 128: Global Bio-based Polymers Market Volume Million Forecast, by Type 2019 & 2032
  129. Table 129: Global Bio-based Polymers Market Revenue Million Forecast, by Application 2019 & 2032
  130. Table 130: Global Bio-based Polymers Market Volume Million Forecast, by Application 2019 & 2032
  131. Table 131: Global Bio-based Polymers Market Revenue Million Forecast, by Country 2019 & 2032
  132. Table 132: Global Bio-based Polymers Market Volume Million Forecast, by Country 2019 & 2032
  133. Table 133: Germany Bio-based Polymers Market Revenue (Million) Forecast, by Application 2019 & 2032
  134. Table 134: Germany Bio-based Polymers Market Volume (Million) Forecast, by Application 2019 & 2032
  135. Table 135: United Kingdom Bio-based Polymers Market Revenue (Million) Forecast, by Application 2019 & 2032
  136. Table 136: United Kingdom Bio-based Polymers Market Volume (Million) Forecast, by Application 2019 & 2032
  137. Table 137: Italy Bio-based Polymers Market Revenue (Million) Forecast, by Application 2019 & 2032
  138. Table 138: Italy Bio-based Polymers Market Volume (Million) Forecast, by Application 2019 & 2032
  139. Table 139: France Bio-based Polymers Market Revenue (Million) Forecast, by Application 2019 & 2032
  140. Table 140: France Bio-based Polymers Market Volume (Million) Forecast, by Application 2019 & 2032
  141. Table 141: Rest of Europe Bio-based Polymers Market Revenue (Million) Forecast, by Application 2019 & 2032
  142. Table 142: Rest of Europe Bio-based Polymers Market Volume (Million) Forecast, by Application 2019 & 2032
  143. Table 143: Global Bio-based Polymers Market Revenue Million Forecast, by Type 2019 & 2032
  144. Table 144: Global Bio-based Polymers Market Volume Million Forecast, by Type 2019 & 2032
  145. Table 145: Global Bio-based Polymers Market Revenue Million Forecast, by Application 2019 & 2032
  146. Table 146: Global Bio-based Polymers Market Volume Million Forecast, by Application 2019 & 2032
  147. Table 147: Global Bio-based Polymers Market Revenue Million Forecast, by Country 2019 & 2032
  148. Table 148: Global Bio-based Polymers Market Volume Million Forecast, by Country 2019 & 2032
  149. Table 149: Brazil Bio-based Polymers Market Revenue (Million) Forecast, by Application 2019 & 2032
  150. Table 150: Brazil Bio-based Polymers Market Volume (Million) Forecast, by Application 2019 & 2032
  151. Table 151: Saudi Arabia Bio-based Polymers Market Revenue (Million) Forecast, by Application 2019 & 2032
  152. Table 152: Saudi Arabia Bio-based Polymers Market Volume (Million) Forecast, by Application 2019 & 2032
  153. Table 153: Rest of the World Bio-based Polymers Market Revenue (Million) Forecast, by Application 2019 & 2032
  154. Table 154: Rest of the World Bio-based Polymers Market Volume (Million) Forecast, by Application 2019 & 2032


Frequently Asked Questions

1. What is the projected Compound Annual Growth Rate (CAGR) of the Bio-based Polymers Market?

The projected CAGR is approximately 24.30%.

2. Which companies are prominent players in the Bio-based Polymers Market?

Key companies in the market include Novamont SpA, FP International, Innovia Films, YIELD10 BIOSCIENCE INC (Metabolix Inc ), FKuR, Merck KGaA, Cardia Bioplastics, Rodenburg Biopolymers, Covestro AG, NatureWorks LLC, thyssenkrupp AG*List Not Exhaustive, DuPont de Nemours Inc, Biologische Naturverpackungen GmbH & Co KG, Corbion, Cortec Group Management Services LLC, SHOWA DENKO K K, BASF SE.

3. What are the main segments of the Bio-based Polymers Market?

The market segments include Type, Application.

4. Can you provide details about the market size?

The market size is estimated to be USD XX Million as of 2022.

5. What are some drivers contributing to market growth?

Preference toward Eco-friendly Polymers to Preserve Environment; Regulation on Non-degradable Polymers in Many Countries; Increasing Consumer Awareness in Developed and Developing Nations; Non-toxic Nature of Biodegradable Polymers.

6. What are the notable trends driving market growth?

Increasing Demand from Packaging Industry.

7. Are there any restraints impacting market growth?

Higher Price Compared to Petroleum-based polymers; Low Awareness in Low Income Countries.

8. Can you provide examples of recent developments in the market?

N/A

9. What pricing options are available for accessing the report?

Pricing options include single-user, multi-user, and enterprise licenses priced at USD 4750, USD 5250, and USD 8750 respectively.

10. Is the market size provided in terms of value or volume?

The market size is provided in terms of value, measured in Million and volume, measured in Million.

11. Are there any specific market keywords associated with the report?

Yes, the market keyword associated with the report is "Bio-based Polymers Market," which aids in identifying and referencing the specific market segment covered.

12. How do I determine which pricing option suits my needs best?

The pricing options vary based on user requirements and access needs. Individual users may opt for single-user licenses, while businesses requiring broader access may choose multi-user or enterprise licenses for cost-effective access to the report.

13. Are there any additional resources or data provided in the Bio-based Polymers Market report?

While the report offers comprehensive insights, it's advisable to review the specific contents or supplementary materials provided to ascertain if additional resources or data are available.

14. How can I stay updated on further developments or reports in the Bio-based Polymers Market?

To stay informed about further developments, trends, and reports in the Bio-based Polymers Market, consider subscribing to industry newsletters, following relevant companies and organizations, or regularly checking reputable industry news sources and publications.


Methodology

Step 1 - Identification of Relevant Samples Size from Population Database

Step Chart
Bar Chart
Method Chart

Step 2 - Approaches for Defining Global Market Size (Value, Volume* & Price*)

Approach Chart
Top-down and bottom-up approaches are used to validate the global market size and estimate the market size for manufactures, regional segments, product, and application.

Note*: In applicable scenarios

Step 3 - Data Sources

Primary Research

  • Web Analytics
  • Survey Reports
  • Research Institute
  • Latest Research Reports
  • Opinion Leaders

Secondary Research

  • Annual Reports
  • White Paper
  • Latest Press Release
  • Industry Association
  • Paid Database
  • Investor Presentations
Analyst Chart

Step 4 - Data Triangulation

Involves using different sources of information in order to increase the validity of a study

These sources are likely to be stakeholders in a program - participants, other researchers, program staff, other community members, and so on.

Then we put all data in single framework & apply various statistical tools to find out the dynamic on the market.

During the analysis stage, feedback from the stakeholder groups would be compared to determine areas of agreement as well as areas of divergence

Additionally, after gathering mixed and scattered data from a wide range of sources, data is triangulated and correlated to come up with estimated figures which are further validated through primary mediums or industry experts, opinion leaders.

About Report Pinnacle

Report Pinnacle provides top-tier market research, industry intelligence, and actionable insights for finance, technology, healthcare, and consumer sectors. Our reports empower you to make informed decisions and achieve business success.

Our expert team combines primary research, data analytics, and industry knowledge to deliver insights you can trust. We offer syndicated reports, custom research, and consulting services tailored to your unique business needs.

At Report Pinnacle, we are committed to quality, transparency, and client satisfaction. Every report is rigorously validated to ensure accuracy and relevance. Our global perspective and local expertise help you understand both broad trends and detailed market shifts.

Stay ahead with Report Pinnacle. Subscribe to our newsletter for the latest insights and research highlights, and follow us on social media for real-time updates.

Report Pinnacle – Your Partner for Reaching the Top in Market Intelligence.

artwork spiralartwork spiralRelated Reports
artwork underline

Opportunities in Ion Exchange Membrane Market Market 2025-2033

The global ion exchange membrane market is booming, driven by water treatment, renewable energy, and battery technology advancements. Explore market size, CAGR, key players, and regional trends in this comprehensive analysis projecting to 2033. Discover lucrative investment opportunities in this rapidly expanding sector.

September 2025
Base Year: 2024
No Of Pages: 150
Price: $4750

Unlocking the Future of APAC Paints & Coatings Additives Industry: Growth and Trends 2025-2033

Discover the booming APAC paints & coatings additives market! This in-depth analysis reveals a CAGR exceeding 6%, driven by construction, automotive, and sustainability trends. Learn about key players, regional breakdowns (China, India, Japan, etc.), and future growth projections to 2033.

September 2025
Base Year: 2024
No Of Pages: 180
Price: $4750

C9 Resin Market CAGR Growth Drivers and Trends: Forecasts 2025-2033

Discover the booming C9 resin market! Explore our comprehensive analysis projecting significant growth through 2033, driven by key applications and technological advancements. Learn about market size, CAGR, and regional trends in this detailed report.

September 2025
Base Year: 2024
No Of Pages: 180
Price: $4750

Analyzing Competitor Moves: Brazil Bioplastics Market Growth Outlook 2025-2033

Discover the booming Brazil bioplastics market! This comprehensive analysis reveals a CAGR of 12.80%, driven by sustainability concerns and government initiatives. Explore market size, key players (Novamont, Arkema, Braskem), segments, and future trends in bio-based biodegradable and non-biodegradable plastics in Brazil (2019-2033).

September 2025
Base Year: 2024
No Of Pages: 120
Price: $3800

Dry Mix Mortar Additives and Chemicals Market Industry Growth Trends and Analysis

Discover the booming Dry Mix Mortar Additives & Chemicals market! This comprehensive analysis reveals a CAGR of 4.52%, driven by construction growth and sustainable building trends. Explore market segmentation, key players (Nouryon, BASF, Sika), and regional insights (Asia-Pacific leading). Project your business strategy with our detailed forecast to 2033.

September 2025
Base Year: 2024
No Of Pages: 150
Price: $4750

Market Deep Dive: Exploring Betaine Market Trends 2025-2033

Discover the booming Betaine Market analysis! Explore key trends, drivers, and restraints impacting this $XX million industry, featuring insights on Betaine Anhydrous, Monohydrate, and HCl forms, across food, animal feed, and personal care applications. Growth projections to 2033 reveal lucrative investment opportunities.

August 2025
Base Year: 2024
No Of Pages: 150
Price: $4750

Acetylene Industry Market Report: Trends and Growth

Discover the latest insights into the $11.38B Acetylene market. Explore growth drivers, regional trends (Asia Pacific leading), key players (Linde, Air Products), and future forecasts (2.54% CAGR) to 2033. Understand the impact of metal working, chemical applications, and emerging technologies on this vital industry.

August 2025
Base Year: 2024
No Of Pages: 180
Price: $4750

Norway Lubricants Market in Developing Economies: Trends and Growth Analysis 2025-2033

Discover the latest insights into the Norway lubricants market. This comprehensive analysis reveals steady growth driven by automotive, marine, and industrial sectors, alongside market trends, key players (BP Castrol, ExxonMobil, Shell), and future projections to 2033. Explore market size, CAGR, and regional dynamics.

August 2025
Base Year: 2024
No Of Pages: 197
Price: $3800

South Korea Passenger Vehicles Lubricants Market Market’s Tech Revolution: Projections to 2033

Discover the booming South Korea passenger vehicle lubricants market! This in-depth analysis reveals a $250 million market in 2025, projected to reach over $350 million by 2033, driven by increasing vehicle numbers and demand for high-performance lubricants. Explore market trends, key players (ExxonMobil, Shell, Castrol, GS Caltex), and growth opportunities.

August 2025
Base Year: 2024
No Of Pages: 180
Price: $3800

Isophthalic Acid Industry Market Report: Trends and Growth

Discover the booming Isophthalic Acid market! This comprehensive analysis reveals a CAGR exceeding 4%, driven by PET packaging, construction, and technological advancements. Explore regional trends, key players (Shell, Honeywell, etc.), and future growth projections for the period 2025-2033. Get insights into market segmentation and key challenges.

August 2025
Base Year: 2024
No Of Pages: 180
Price: $4750

Ferroboron Market Charting Growth Trajectories 2025-2033: Strategic Insights and Forecasts

The Ferroboron Market is booming, with a CAGR exceeding 5.50% through 2033. Driven by automotive, construction, and steel advancements, this report analyzes market size, regional shares (North America, Europe, Asia-Pacific), key players (AMPERRE alloys, CRONIMET), and future trends. Discover insights into this high-growth sector.

August 2025
Base Year: 2024
No Of Pages: 234
Price: $4750

Unlocking Insights for Green Hydrogen Market Growth Strategies

The green hydrogen market is booming, with a CAGR exceeding 60% and a projected value of $3.28 billion in 2025. Learn about key drivers, trends, restraints, and regional market share in this comprehensive analysis, covering major players and future forecasts to 2033. Discover the opportunities and challenges in this rapidly expanding sector of the renewable energy market.

August 2025
Base Year: 2024
No Of Pages: 180
Price: $4750

Carbon Fiber Market Market Analysis and Forecasts

The global carbon fiber market is booming, projected to reach $42.9 Billion by 2033 with a 10.05% CAGR. Driven by aerospace, renewable energy, and automotive sectors, this detailed market analysis explores key trends, restraints, and leading companies shaping this high-growth industry.

August 2025
Base Year: 2024
No Of Pages: 234
Price: $4750

Deep Dive into Bromine Industry: Comprehensive Growth Analysis 2025-2033

Discover the booming bromine market forecast to 2033! This in-depth analysis reveals a CAGR of 5%, driven by flame retardants, biocides, and energy storage. Explore key players, regional trends, and market segmentation for organobromines, bromide salts, and more. Get your free market report now!

August 2025
Base Year: 2024
No Of Pages: 180
Price: $3,950

Future Trends Shaping Viscosity Reducing Agents Market Growth

Discover the booming viscosity reducing agents market! Our comprehensive analysis reveals a CAGR of 5.68% to 2033, driven by oil & gas, paints & coatings, and plastics industries. Explore key players, regional trends, and future growth projections in this detailed market report.

August 2025
Base Year: 2024
No Of Pages: 180
Price: $3,950

Europe Protective Coatings Market Projected to Grow at XX CAGR: Insights and Forecasts 2025-2033

The European Protective Coatings Market is booming, projected to surpass €20 billion by 2033, driven by infrastructure growth and eco-friendly regulations. Explore market trends, key players (Akzo Nobel, BASF, PPG), and regional analysis in this comprehensive report.

August 2025
Base Year: 2024
No Of Pages: 180
Price: $4750

Emerging Markets for Indonesia Lubricant Market Industry

Discover the booming Indonesian lubricant market forecast to 2033! This in-depth analysis reveals market size, CAGR, key drivers, trends, restraints, and leading companies like Castrol and Shell. Explore regional breakdowns and future growth opportunities in this dynamic sector.

August 2025
Base Year: 2024
No Of Pages: 197
Price: $3800

Exploring Ethyl Levulinate Market Market Ecosystem: Insights to 2033

Discover the booming Ethyl Levulinate market! This comprehensive analysis reveals a CAGR exceeding 3%, driven by soaring demand in food, fragrance, and pharmaceutical applications. Explore market size, key players, regional trends, and future growth projections from 2025-2033.

August 2025
Base Year: 2024
No Of Pages: 234
Price: $4750

Aramid Fiber Market Market Report: Trends and Growth

Discover the booming aramid fiber market! This comprehensive analysis reveals a CAGR exceeding 4%, driven by aerospace, automotive, and construction sectors. Explore market trends, key players (DuPont, Teijin, Kolon), and future growth projections for 2025-2033. Learn about regional market shares and emerging opportunities in this high-growth industry.

August 2025
Base Year: 2024
No Of Pages: 234
Price: $4750

Diamond Wire Market Future-Proof Strategies: Market Trends 2025-2033

Discover the booming diamond wire market! This comprehensive analysis reveals a CAGR exceeding 10%, driven by solar, semiconductor, and construction applications. Explore market trends, key players (Dellas S p A, Logomatic GmbH, etc.), and regional insights (Asia Pacific leading) for the period 2019-2033. Get your free report now!

August 2025
Base Year: 2024
No Of Pages: 234
Price: $4750

Europe Automotive Coatings Market Market’s Decade-Long Growth Trends and Future Projections 2025-2033

Discover the latest insights into the booming European automotive coatings market. This comprehensive analysis reveals a €4.96 billion market in 2025, projected to grow at a 3% CAGR until 2033, driven by factors like increasing vehicle production and demand for sustainable coatings. Explore market trends, key players (Sherwin-Williams, PPG, BASF), and regional variations impacting this dynamic sector.

August 2025
Base Year: 2024
No Of Pages: 180
Price: $4750

Emerging Markets Driving Bulgaria Passenger Vehicles Lubricants Market Growth

Discover the growth potential of the Bulgarian passenger vehicle lubricants market. This comprehensive analysis reveals market size, CAGR, key players (ExxonMobil, Shell, Castrol, Motul etc.), market trends, and future projections through 2033. Learn about the leading segments (engine oils, greases, etc.) and unlock valuable insights for investment and business strategies.

August 2025
Base Year: 2024
No Of Pages: 180
Price: $3800

Opacifiers Market Market Growth Fueled by CAGR to XXX Million by 2033

Discover the booming opacifiers market! This in-depth analysis reveals a $XX million market with a 4%+ CAGR, driven by construction, paints & coatings, and personal care. Explore key trends, regional insights, and leading companies like Tronox and Kronos.

August 2025
Base Year: 2024
No Of Pages: 150
Price: $4750

Brazil Lubricants Industry 2025-2033 Trends and Competitor Dynamics: Unlocking Growth Opportunities

Discover the dynamic Brazil lubricants market. This in-depth analysis reveals key trends, growth drivers, and challenges for 2025-2033, highlighting leading companies and regional market share. Explore the opportunities and risks in this expanding $5 billion market.

August 2025
Base Year: 2024
No Of Pages: 197
Price: $3800

Europe Surface Treatment Chemicals Market Future-Proof Strategies: Market Trends 2025-2033

Discover the booming Europe Surface Treatment Chemicals market! This in-depth analysis reveals a CAGR exceeding 5%, driven by environmental regulations and industry demand. Explore market size projections, key players (Chemetall, Henkel, Oerlikon), and future trends impacting this €3.5 Billion+ market.

August 2025
Base Year: 2024
No Of Pages: 234
Price: $4750

Plastic Packaging Industry in Vietnam Industry Growth Trends and Analysis

Discover the booming Vietnamese plastic packaging market! Explore its $10B+ valuation, 8.44% CAGR, key drivers, and major players. Learn about market segmentation, growth trends, and the rise of sustainable packaging alternatives in this comprehensive analysis (2019-2033).

August 2025
Base Year: 2024
No Of Pages: 180
Price: $3800

Europe Elastic Adhesive Market Insights: Market Size Analysis to 2033

Discover the booming European elastic adhesive market! This in-depth analysis reveals key trends, growth drivers, and future projections for 2025-2033. Learn about market size, CAGR, and regional shares. Invest wisely in this expanding sector.

August 2025
Base Year: 2024
No Of Pages: 234
Price: $4750

Amorphous Polyethylene Terephthalate Market Industry’s Future Growth Prospects

Discover the booming Amorphous Polyethylene Terephthalate (APET) market! This comprehensive analysis reveals key trends, growth drivers, and regional market shares from 2019-2033, highlighting leading companies and projected CAGR. Learn about the future of APET in packaging and beyond.

August 2025
Base Year: 2024
No Of Pages: 180
Price: $4750

High-Temperature Grease Market Decoded: Comprehensive Analysis and Forecasts 2025-2033

The high-temperature grease market is booming, projected to reach $XX million by 2033, driven by automotive, aerospace, and manufacturing demands. Explore market trends, key players (BP, Chevron, ExxonMobil), and regional growth forecasts in this comprehensive analysis. Discover the challenges and opportunities shaping this lucrative sector.

August 2025
Base Year: 2024
No Of Pages: 234
Price: $4750

Exploring Africa Lubricants Industry’s Market Size Dynamics 2025-2033

Discover the booming African lubricants market! This in-depth analysis reveals a projected CAGR of 3.32% to 2033, driven by automotive growth and infrastructure development. Learn about key players, market segmentation, and challenges impacting engine oils, greases, and more in this comprehensive report.

August 2025
Base Year: 2024
No Of Pages: 197
Price: $3800

Automotive Lubricants Market XX CAGR Growth to Drive Market Size to XXX Million by 2033

Discover the latest trends and insights into the booming automotive lubricants market. Learn about its $50 billion valuation, 3.13% CAGR, key players, and regional growth projections to 2033. Explore the impact of EV adoption and sustainability initiatives on this dynamic sector.

August 2025
Base Year: 2024
No Of Pages: 197
Price: $3800

Exploring Silane Coupling Agent Market’s Market Size Dynamics 2025-2033

Discover the booming silane coupling agent market! This comprehensive analysis reveals key trends, drivers, and restraints shaping this $XX million industry (estimated) with a CAGR exceeding 3%. Explore regional market share, leading companies, and future growth projections through 2033.

August 2025
Base Year: 2024
No Of Pages: 150
Price: $4750

Analyzing Competitor Moves: Hydrocolloid Industry Growth Outlook 2025-2033

Discover the booming hydrocolloid market! Explore detailed analysis of market size, CAGR, key drivers (food processing, consumer trends), restraints, and regional trends (Asia Pacific, North America, Europe) until 2033. Learn about leading companies like ADM, Cargill, and Ingredion. Invest wisely with our comprehensive market report.

August 2025
Base Year: 2024
No Of Pages: 234
Price: $4750

Comprehensive Review of Stainless Steel Plumbing Pipes & Fittings Market Growth Potential

Discover the booming stainless steel plumbing pipes & fittings market! This comprehensive analysis reveals key trends, growth drivers, and regional insights for 2025-2033, including projections for CAGR, market segmentation, and competitive landscape. Learn about top players and investment opportunities in this expanding sector.

August 2025
Base Year: 2024
No Of Pages: 180
Price: $4750

Flotation Reagent Market Future-Proof Strategies: Market Trends 2025-2033

The global flotation reagent market is booming, with a CAGR exceeding 4% through 2033. Driven by mining, construction, and water treatment needs, this market analysis reveals key trends, restraints, and leading companies like Clariant and Solvay. Explore regional breakdowns and future growth projections.

August 2025
Base Year: 2024
No Of Pages: 180
Price: $4750

Benzoe Siam Market Market Analysis and Forecasts

Discover the booming Benzoin Siam market! This comprehensive analysis reveals key trends, drivers, and restraints influencing growth through 2033. Explore regional market share, leading companies, and future projections for this valuable natural ingredient used in fragrance, personal care, and more.

August 2025
Base Year: 2024
No Of Pages: 234
Price: $4750

Innovations Driving Pour Point Depressants Market Market 2025-2033

The Pour Point Depressants Market is booming, projected to reach $3440 million by 2033. Explore market trends, CAGR analysis, and regional insights for this crucial fuel additive segment. Discover how increasing fuel demands and environmental regulations drive market growth.

August 2025
Base Year: 2024
No Of Pages: 180
Price: $4750

Exploring Key Dynamics of Silicon Carbide Market Industry

The Silicon Carbide (SiC) market is booming, projected to reach $3.3 billion by 2025 and grow at a CAGR exceeding 10% through 2033. Driven by EV adoption and renewable energy, this report analyzes market trends, key players (Saint Gobain, Imerys, Morgan Advanced Materials), and regional growth, offering valuable insights for investors and industry professionals.

August 2025
Base Year: 2024
No Of Pages: 234
Price: $4750

South Africa Car Lubricants Market Market’s Drivers and Challenges: Strategic Overview 2025-2033

Discover the latest insights into the thriving South Africa car lubricants market. This comprehensive analysis reveals a market projected to reach $XXX million by 2025, growing at a CAGR of 3.82% through 2033. Explore key drivers, trends, restraints, and regional market share data for engine oils, greases, and more. Learn how top players like Shell and ExxonMobil are competing in this dynamic sector.

August 2025
Base Year: 2024
No Of Pages: 120
Price: $3800

Asia Pacific Green Cement Market Market Drivers and Challenges: Trends 2025-2033

The Asia Pacific green cement market is booming, projected to surpass $XX million by 2033, driven by eco-conscious construction and government regulations. Explore market trends, key players (like Holcim, CEMEX, and UltraTech), and growth forecasts in our comprehensive analysis.

August 2025
Base Year: 2024
No Of Pages: 234
Price: $4750

Bio-based 1,4-Butanediol Market Market Overview: Trends and Strategic Forecasts 2025-2033

Discover the booming bio-based 1,4-Butanediol (BDO) market! Explore its 9.45% CAGR, key drivers, restraints, and regional insights. Learn about leading companies and applications like PBT, THF, and PU. Get the forecast for 2025-2033 and understand the future of sustainable chemicals.

August 2025
Base Year: 2024
No Of Pages: 180
Price: $4750

Recovered Carbon Black Market Analysis Report 2025: Market to Grow by a CAGR of XX to 2033, Driven by Government Incentives, Popularity of Virtual Assistants, and Strategic Partnerships

Discover the booming Recovered Carbon Black market! Explore its projected growth (CAGR 2.00%), key drivers, restraints, and regional analysis (North America, Europe, Asia-Pacific). Learn about top companies and applications like tires, plastics, and more. Invest in sustainable solutions – get your insights now!

August 2025
Base Year: 2024
No Of Pages: 234
Price: $4750

Mechanical Seals Market Market’s Consumer Landscape: Insights and Trends 2025-2033

The global mechanical seals market is booming, with a CAGR exceeding 3.50% through 2033. Driven by energy efficiency demands and technological advancements, this market is segmented by seal type (pump, compressor, mixer) and end-user industry (power, oil & gas). Discover key trends, leading companies, and regional insights in this comprehensive market analysis.

August 2025
Base Year: 2024
No Of Pages: 234
Price: $4750

North America Anchors and Grouts Market Market Consumption Trends: Growth Analysis 2025-2033

Discover the booming North America anchors and grouts market, projected to reach significant value by 2033. This comprehensive analysis reveals key drivers, trends, and restraints shaping this dynamic industry. Explore market segmentation, leading companies, and regional insights.

August 2025
Base Year: 2024
No Of Pages: 234
Price: $4750

Strategic Trends in Quartz Crystal Industry Market 2025-2033

Discover the booming quartz crystal market! Explore a $7.31 billion industry with a 4.19% CAGR, driven by electronics, solar, and construction. Learn about key players, regional trends, and future growth projections in this comprehensive market analysis.

August 2025
Base Year: 2024
No Of Pages: 150
Price: $4750

Latin America Paints And Coatings Market in Focus: Growth Trajectories and Strategic Insights 2025-2033

Discover the booming Latin American paints and coatings market! This in-depth analysis reveals an $8.32B market in 2025, projected for >5% CAGR growth through 2033, driven by infrastructure development and a rising middle class. Explore key trends, segments (acrylics, water-borne, architectural), and leading companies.

August 2025
Base Year: 2024
No Of Pages: 180
Price: $4750

Glyoxal Industry Analysis Report 2025: Market to Grow by a CAGR of XX to 2033, Driven by Government Incentives, Popularity of Virtual Assistants, and Strategic Partnerships

Discover the booming glyoxal market! This comprehensive analysis reveals a $308.12 million market in 2025, projected to grow at a 5.8% CAGR through 2033, driven by adhesives, textiles, and resins. Explore key trends, restraints, regional insights, and leading companies shaping this dynamic industry.

August 2025
Base Year: 2024
No Of Pages: 180
Price: $4750

Malaysia Architectural Coatings Market Market Disruption: Competitor Insights and Trends 2025-2033

Discover the booming Malaysian architectural coatings market! This in-depth analysis reveals a CAGR exceeding 4%, driven by construction growth and demand for eco-friendly waterborne paints. Learn about key players, market segments (residential, commercial, resin types), and future trends impacting this RM 2 billion market.

August 2025
Base Year: 2024
No Of Pages: 180
Price: $3800

Europe Biochar Market Analysis 2025-2033: Unlocking Competitive Opportunities

The European biochar market is booming, with a projected CAGR of 24.03% (2019-2025). Discover key drivers, trends, and leading companies shaping this sustainable industry. Explore market size, segmentation, and regional analysis for informed investment decisions. Learn more about the environmental benefits and applications of biochar in agriculture, carbon sequestration, and more.

August 2025
Base Year: 2024
No Of Pages: 234
Price: $4750

Hydroxypropionic Acid Industry in Emerging Markets: Analysis and Projections 2025-2033

The Hydroxypropionic Acid market is booming, projected to reach [estimated 2033 value based on CAGR] by 2033, driven by strong demand in paints & coatings, polymers, and adhesives. Explore market trends, key players (Novozymes, Sigma-Aldrich, etc.), and regional growth forecasts in this comprehensive analysis.

August 2025
Base Year: 2024
No Of Pages: 180
Price: $4750
  • Home
  • About Us
  • Industries
    • Aerospace & Defense
    • Agriculture
    • Animal Nutrition & Wellness
    • Automotive
    • Chemicals & Materials
    • Consumer Goods and Services
    • Energy & Power
    • Financial Services and Investment Intelligence
    • Food & Beverage
    • Home and Property Improvement
    • Hospitality and Tourism
    • Logistics
    • Manufacturing Products and Services
    • Packaging
    • Professional and Commercial Services
    • Real Estate and Construction
    • Retail
    • Technology, Media and Telecom
    • Healthcare
  • Services
  • Contact
Main Logo
  • Home
  • About Us
  • Industries
    • Aerospace & Defense
    • Agriculture
    • Animal Nutrition & Wellness
    • Automotive
    • Chemicals & Materials
    • Consumer Goods and Services
    • Energy & Power
    • Financial Services and Investment Intelligence
    • Food & Beverage
    • Home and Property Improvement
    • Hospitality and Tourism
    • Logistics
    • Manufacturing Products and Services
    • Packaging
    • Professional and Commercial Services
    • Real Estate and Construction
    • Retail
    • Technology, Media and Telecom
    • Healthcare
  • Services
  • Contact
+17162654855
[email protected]

+17162654855

[email protected]

Business Address

Head Office

Ansec House 3 rd floor Tank Road, Yerwada, Pune, Maharashtra 411014

Contact Information

Craig Francis

Business Development Head

+17162654855

[email protected]

Secure Payment Partners

payment image
RetailLogisticsPackagingAutomotiveHealthcareAgricultureEnergy & PowerFood & BeverageAerospace & DefenseChemicals & MaterialsHospitality and TourismAnimal Nutrition & WellnessConsumer Goods and ServicesReal Estate and ConstructionHome and Property ImprovementTechnology, Media and TelecomManufacturing Products and ServicesFinancial Services and Investment Intelligence

© 2025 PRDUA Research & Media Private Limited, All rights reserved

Privacy Policy
Terms and Conditions
FAQ