

Key Insights
The bio-organic acid market is experiencing robust growth, driven by the increasing demand for sustainable and environmentally friendly alternatives to traditional petrochemical-based acids. A CAGR exceeding 6% indicates a significant expansion projected through 2033, reaching a substantial market size. This growth is fueled by several key factors. Firstly, the rising awareness of environmental concerns and the push for bio-based products are major drivers. The bio-organic acid industry benefits from government initiatives promoting sustainability and reduced carbon footprints. Secondly, the versatile applications across diverse sectors, including polymers, pharmaceuticals, food and beverages, and textiles, contribute significantly to market expansion. The use of bio-organic acids in biodegradable plastics and sustainable packaging is a particularly strong growth area. Finally, continuous advancements in biotechnology and fermentation technologies are improving production efficiency and reducing costs, further boosting market attractiveness. The market segmentation reveals a strong demand for bio-lactic acid and bio-acetic acid, which are utilized extensively in various applications. Asia-Pacific, particularly China and India, are expected to witness significant growth due to their expanding industrial sectors and increasing focus on sustainable practices.
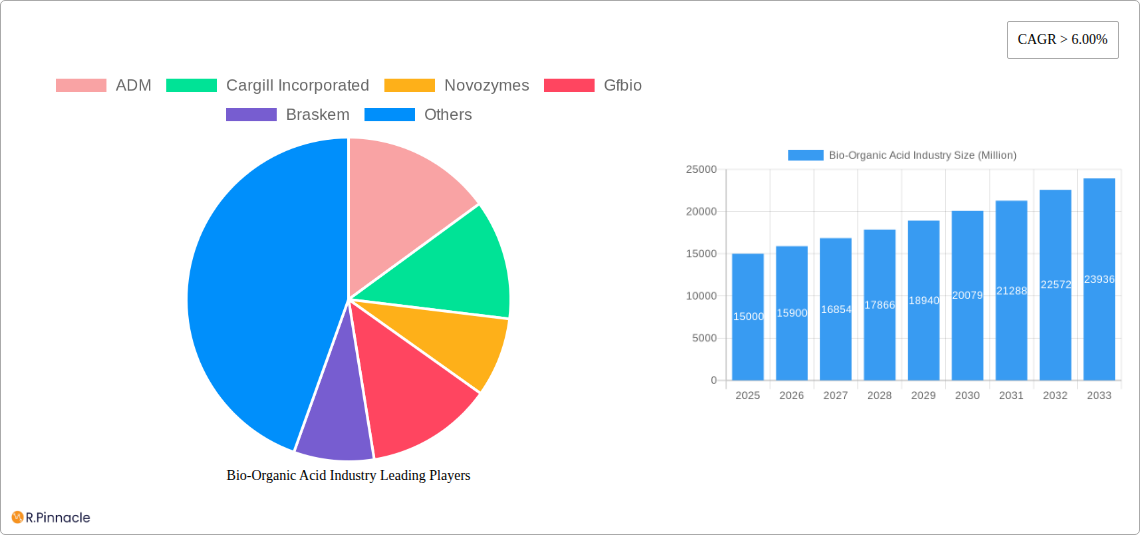
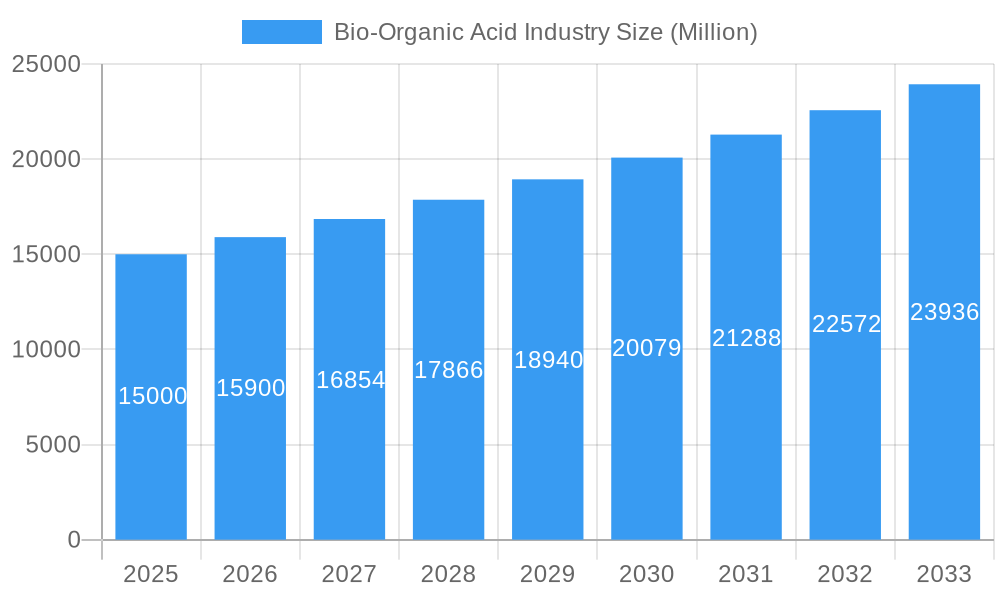
Bio-Organic Acid Industry Market Size (In Billion)
However, market growth faces some challenges. Fluctuations in raw material prices, particularly biomass-derived inputs, can impact profitability. Furthermore, the competitive landscape, with established players alongside emerging biotech companies, introduces a dynamic element. Maintaining consistent supply chain efficiency and managing regulatory hurdles associated with novel bio-based products are also crucial factors. Despite these challenges, the long-term prospects for the bio-organic acid market remain positive, driven by ongoing innovation, increasing consumer demand for sustainable products, and the growing adoption of bio-based solutions in various industries. North America and Europe are also expected to continue their strong performance driven by robust research and development activity and supportive regulatory frameworks.
Bio-Organic Acid Industry Company Market Share
Bio-Organic Acid Industry Market Report: 2019-2033
This comprehensive report provides an in-depth analysis of the Bio-Organic Acid industry, offering invaluable insights for industry professionals, investors, and strategic decision-makers. Covering the period 2019-2033, with a focus on 2025, this report forecasts robust growth and explores the key trends shaping this dynamic market. The report's detailed segmentation, analysis of leading players, and identification of emerging opportunities make it an indispensable resource for navigating the complexities of the bio-organic acid landscape. Expected market value in 2025 is estimated at xx Million.
Bio-Organic Acid Industry Market Structure & Innovation Trends
This section analyzes the competitive landscape of the bio-organic acid market, encompassing market concentration, innovation drivers, regulatory influences, and key strategic activities. The study period is 2019-2033, with 2025 serving as the base and estimated year.
The market is characterized by a mix of large multinational corporations and specialized players. Key players include ADM, Cargill Incorporated, Novozymes, Gfbio, Braskem, PTT Global Chemical Public Company Limited, Mitsubishi Chemical Corporation, Corbion, BioAmber Inc, Cosun, BASF SE, Abengoa, DSM, NatureWorks LLC, and Genomatica. However, this list is not exhaustive. Market share analysis reveals a concentrated market with the top five players holding an estimated xx% of the market share in 2025.
- Market Concentration: High, with significant presence of multinational corporations.
- Innovation Drivers: Growing demand for sustainable and bio-based materials, coupled with technological advancements in fermentation and bio-catalysis.
- Regulatory Frameworks: Stringent environmental regulations promoting bio-based alternatives are driving market growth.
- Product Substitutes: Competition from petrochemical-based organic acids exists, but bio-based alternatives are gaining traction due to sustainability concerns.
- End-User Demographics: Diverse applications across polymers, pharmaceuticals, food and beverage, and textiles drive market demand.
- M&A Activities: Consolidation is expected in the forecast period, with an estimated xx Million USD in M&A deal values for the period 2025-2033. These activities will primarily involve strategic acquisitions by major players to expand their product portfolio and market reach.
Bio-Organic Acid Industry Market Dynamics & Trends
This section delves into the key market dynamics, including growth drivers, technological disruptions, consumer preferences, and competitive pressures. The report projects a Compound Annual Growth Rate (CAGR) of xx% during the forecast period (2025-2033).
Market growth is primarily driven by the increasing demand for sustainable and environmentally friendly products. The rising awareness of the environmental impact of petrochemical-based products is fueling the shift towards bio-based alternatives. Technological advancements, particularly in fermentation and bio-catalysis processes, are further enhancing the cost-effectiveness and efficiency of bio-organic acid production. Consumer preferences are shifting towards sustainable and ethically sourced products, creating a strong demand for bio-organic acids. Market penetration for bio-based organic acids is steadily increasing, projected to reach xx% by 2033 in key application segments. Intense competition among established players and emerging entrants drives innovation and price optimization within the market.
Dominant Regions & Segments in Bio-Organic Acid Industry
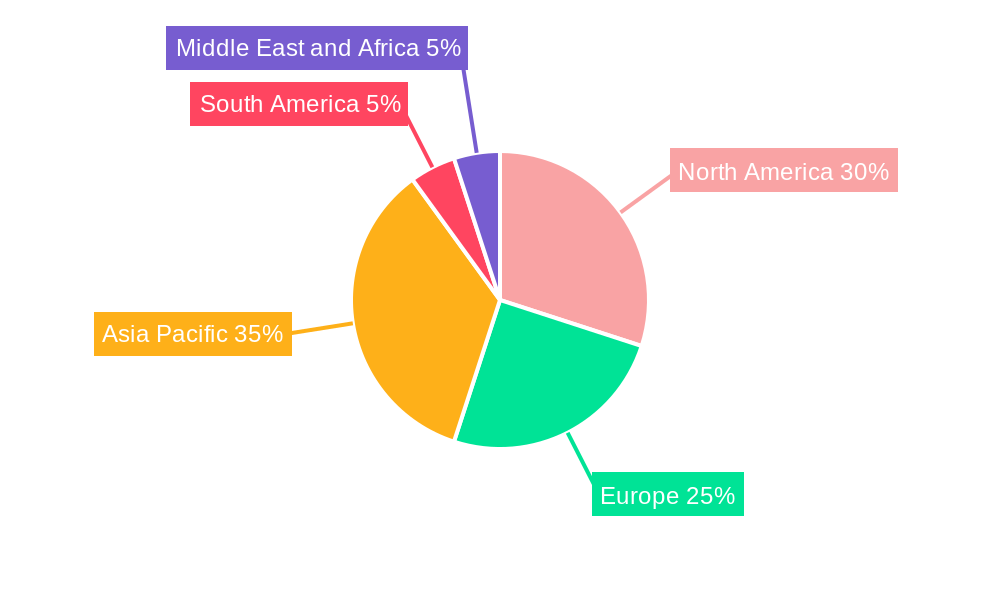
This section identifies the leading regions and segments within the bio-organic acid industry. The Asia-Pacific region is expected to dominate the market due to the rapid industrialization and growing demand for sustainable materials in countries like China and India. Specific country dominance will be detailed within the full report.
Key Drivers:
- Economic Policies: Government incentives and subsidies for bio-based industries.
- Infrastructure: Development of efficient supply chains and processing facilities.
- Technological Advancements: Innovations in fermentation and downstream processing techniques are driving market growth.
Dominant Segments:
- Raw Material: Biomass is the leading raw material, with corn and maize also holding substantial market share.
- Product Type: Bio Lactic Acid currently holds the largest market share, followed by Bio Acetic Acid and Bio Succinic Acid.
- Application: The Polymers segment dominates, driven by the increasing demand for biodegradable and compostable plastics. The Food and Beverage sector is a significant segment as well.
Bio-Organic Acid Industry Product Innovations
Recent years have witnessed significant advancements in bio-organic acid production technologies. These innovations focus on improving yield, reducing production costs, and enhancing the functionality of bio-organic acids for diverse applications. Key trends include the development of novel fermentation strains, process optimization using advanced bio-catalysis, and integration of sustainable production practices. This leads to enhanced product quality and performance compared to traditional petrochemical-based counterparts, securing a competitive advantage in the market.
Report Scope & Segmentation Analysis
This report provides a comprehensive segmentation of the bio-organic acid market based on raw materials (Biomass, Corn, Maize, Sugar, Other Raw Materials), product types (Bio Lactic Acid, Bio Acetic Acid, Bio Adipic Acid, Bio Acrylic Acid, Bio Succinic Acid, Other Product Types), and applications (Polymers, Pharmaceuticals, Textile, Coatings, Food and Beverage, Other Applications). Each segment is analyzed in detail, including growth projections, market size, and competitive dynamics. Growth projections vary significantly among segments and will be detailed in the full report.
Key Drivers of Bio-Organic Acid Industry Growth
The bio-organic acid industry's growth is propelled by a confluence of technological, economic, and regulatory factors. Technological advancements in fermentation processes and enzyme engineering continuously enhance production efficiency and reduce costs. The increasing demand for sustainable and eco-friendly alternatives to petrochemical-based products, driven by stringent environmental regulations and heightened consumer awareness, is a key driver. Government incentives and subsidies also play a significant role in fostering market growth by supporting the development and adoption of bio-based technologies.
Challenges in the Bio-Organic Acid Industry Sector
The bio-organic acid industry faces several challenges, including the relatively high production cost compared to petrochemical-based counterparts. Supply chain vulnerabilities and fluctuations in raw material prices pose significant challenges. Intense competition among established players and emerging entrants creates pricing pressure. Stringent regulatory approvals and compliance requirements can also hinder market expansion.
Emerging Opportunities in Bio-Organic Acid Industry
Emerging opportunities abound for the bio-organic acid industry, driven by the growing demand for sustainable and bio-based materials in diverse sectors. The expanding applications of bio-organic acids in new sectors such as bioplastics, biodegradable packaging, and personal care products present significant growth potential. Innovation in fermentation technologies and process optimization can significantly reduce production costs and enhance competitiveness. The exploration of new feedstocks and sustainable production methods can lead to cost reduction and enhanced sustainability credentials.
Leading Players in the Bio-Organic Acid Industry Market
- ADM
- Cargill Incorporated
- Novozymes
- Gfbio
- Braskem
- PTT Global Chemical Public Company Limited
- Mitsubishi Chemical Corporation
- Corbion
- BioAmber Inc
- Cosun
- BASF SE
- Abengoa
- DSM
- NatureWorks LLC
- Genomatica
Key Developments in Bio-Organic Acid Industry
- October 2022: Corbion announced the production of bio-based lactic acid to fulfill the rising demand for environmentally friendly solutions in the Asia-Pacific region, and plans to build a new lactic acid facility in Thailand. This expansion signifies a significant commitment to the bio-based organic acid market.
- May 2022: BASF announced the extension of its line of bio-based organic acids, including a novel biodegradable and compostable polymer based on bio-based succinic acid, highlighting the industry's innovation in sustainable materials.
Future Outlook for Bio-Organic Acid Industry Market
The bio-organic acid market is poised for robust growth, driven by continuous technological advancements, increasing demand for sustainable solutions, and supportive government policies. Strategic collaborations and partnerships between industry players and research institutions will further accelerate innovation. Expanding applications in high-growth sectors, such as biodegradable plastics and bio-based chemicals, will drive future market expansion and present substantial opportunities for industry stakeholders.
Bio-Organic Acid Industry Segmentation
-
1. Raw Material
- 1.1. Biomass
- 1.2. Corn
- 1.3. Maize
- 1.4. Sugar
- 1.5. Other Raw Materials
-
2. Product Type
- 2.1. Bio Lactic Acid
- 2.2. Bio Acetic Acid
- 2.3. Bio Adipic Acid
- 2.4. Bio Acrylic Acid
- 2.5. Bio Succinic Acid
- 2.6. Other Pr
-
3. Application
- 3.1. Polymers
- 3.2. Pharmaceuticals
- 3.3. Textile
- 3.4. Coatings
- 3.5. Food and Beverage
- 3.6. Other Ap
Bio-Organic Acid Industry Segmentation By Geography
-
1. Asia Pacific
- 1.1. China
- 1.2. India
- 1.3. Japan
- 1.4. South Korea
- 1.5. Rest of Asia Pacific
-
2. North America
- 2.1. United States
- 2.2. Canada
- 2.3. Mexico
-
3. Europe
- 3.1. Germany
- 3.2. United Kingdom
- 3.3. Italy
- 3.4. France
- 3.5. Rest of Europe
-
4. South America
- 4.1. Brazil
- 4.2. Argentina
- 4.3. Rest of South America
-
5. Middle East and Africa
- 5.1. Saudi Arabia
- 5.2. South Africa
- 5.3. Rest of Middle East and Africa
Bio-Organic Acid Industry Regional Market Share
Geographic Coverage of Bio-Organic Acid Industry
Bio-Organic Acid Industry REPORT HIGHLIGHTS
| Aspects | Details |
|---|---|
| Study Period | 2020-2034 |
| Base Year | 2025 |
| Estimated Year | 2026 |
| Forecast Period | 2026-2034 |
| Historical Period | 2020-2025 |
| Growth Rate | CAGR of > 6.00% from 2020-2034 |
| Segmentation |
|
Table of Contents
- 1. Introduction
- 1.1. Research Scope
- 1.2. Market Segmentation
- 1.3. Research Objective
- 1.4. Definitions and Assumptions
- 2. Executive Summary
- 2.1. Market Snapshot
- 3. Market Dynamics
- 3.1. Market Drivers
- 3.2. Market Restrains
- 3.3. Market Trends
- 3.4. Market Opportunities
- 4. Market Factor Analysis
- 4.1. Porters Five Forces
- 4.1.1. Bargaining Power of Suppliers
- 4.1.2. Bargaining Power of Buyers
- 4.1.3. Threat of New Entrants
- 4.1.4. Threat of Substitutes
- 4.1.5. Competitive Rivalry
- 4.2. PESTEL analysis
- 4.3. BCG Analysis
- 4.3.1. Stars (High Growth, High Market Share)
- 4.3.2. Cash Cows (Low Growth, High Market Share)
- 4.3.3. Question Mark (High Growth, Low Market Share)
- 4.3.4. Dogs (Low Growth, Low Market Share)
- 4.4. Ansoff Matrix Analysis
- 4.5. Supply Chain Analysis
- 4.6. Regulatory Landscape
- 4.7. Current Market Potential and Opportunity Assessment (TAM–SAM–SOM Framework)
- 4.8. PRI Analyst Note
- 4.1. Porters Five Forces
- 5. Market Analysis, Insights and Forecast 2021-2033
- 5.1. Market Analysis, Insights and Forecast - by Raw Material
- 5.1.1. Biomass
- 5.1.2. Corn
- 5.1.3. Maize
- 5.1.4. Sugar
- 5.1.5. Other Raw Materials
- 5.2. Market Analysis, Insights and Forecast - by Product Type
- 5.2.1. Bio Lactic Acid
- 5.2.2. Bio Acetic Acid
- 5.2.3. Bio Adipic Acid
- 5.2.4. Bio Acrylic Acid
- 5.2.5. Bio Succinic Acid
- 5.2.6. Other Pr
- 5.3. Market Analysis, Insights and Forecast - by Application
- 5.3.1. Polymers
- 5.3.2. Pharmaceuticals
- 5.3.3. Textile
- 5.3.4. Coatings
- 5.3.5. Food and Beverage
- 5.3.6. Other Ap
- 5.4. Market Analysis, Insights and Forecast - by Region
- 5.4.1. Asia Pacific
- 5.4.2. North America
- 5.4.3. Europe
- 5.4.4. South America
- 5.4.5. Middle East and Africa
- 5.1. Market Analysis, Insights and Forecast - by Raw Material
- 6. Global Bio-Organic Acid Industry Analysis, Insights and Forecast, 2021-2033
- 6.1. Market Analysis, Insights and Forecast - by Raw Material
- 6.1.1. Biomass
- 6.1.2. Corn
- 6.1.3. Maize
- 6.1.4. Sugar
- 6.1.5. Other Raw Materials
- 6.2. Market Analysis, Insights and Forecast - by Product Type
- 6.2.1. Bio Lactic Acid
- 6.2.2. Bio Acetic Acid
- 6.2.3. Bio Adipic Acid
- 6.2.4. Bio Acrylic Acid
- 6.2.5. Bio Succinic Acid
- 6.2.6. Other Pr
- 6.3. Market Analysis, Insights and Forecast - by Application
- 6.3.1. Polymers
- 6.3.2. Pharmaceuticals
- 6.3.3. Textile
- 6.3.4. Coatings
- 6.3.5. Food and Beverage
- 6.3.6. Other Ap
- 6.1. Market Analysis, Insights and Forecast - by Raw Material
- 7. Asia Pacific Bio-Organic Acid Industry Analysis, Insights and Forecast, 2020-2032
- 7.1. Market Analysis, Insights and Forecast - by Raw Material
- 7.1.1. Biomass
- 7.1.2. Corn
- 7.1.3. Maize
- 7.1.4. Sugar
- 7.1.5. Other Raw Materials
- 7.2. Market Analysis, Insights and Forecast - by Product Type
- 7.2.1. Bio Lactic Acid
- 7.2.2. Bio Acetic Acid
- 7.2.3. Bio Adipic Acid
- 7.2.4. Bio Acrylic Acid
- 7.2.5. Bio Succinic Acid
- 7.2.6. Other Pr
- 7.3. Market Analysis, Insights and Forecast - by Application
- 7.3.1. Polymers
- 7.3.2. Pharmaceuticals
- 7.3.3. Textile
- 7.3.4. Coatings
- 7.3.5. Food and Beverage
- 7.3.6. Other Ap
- 7.1. Market Analysis, Insights and Forecast - by Raw Material
- 8. North America Bio-Organic Acid Industry Analysis, Insights and Forecast, 2020-2032
- 8.1. Market Analysis, Insights and Forecast - by Raw Material
- 8.1.1. Biomass
- 8.1.2. Corn
- 8.1.3. Maize
- 8.1.4. Sugar
- 8.1.5. Other Raw Materials
- 8.2. Market Analysis, Insights and Forecast - by Product Type
- 8.2.1. Bio Lactic Acid
- 8.2.2. Bio Acetic Acid
- 8.2.3. Bio Adipic Acid
- 8.2.4. Bio Acrylic Acid
- 8.2.5. Bio Succinic Acid
- 8.2.6. Other Pr
- 8.3. Market Analysis, Insights and Forecast - by Application
- 8.3.1. Polymers
- 8.3.2. Pharmaceuticals
- 8.3.3. Textile
- 8.3.4. Coatings
- 8.3.5. Food and Beverage
- 8.3.6. Other Ap
- 8.1. Market Analysis, Insights and Forecast - by Raw Material
- 9. Europe Bio-Organic Acid Industry Analysis, Insights and Forecast, 2020-2032
- 9.1. Market Analysis, Insights and Forecast - by Raw Material
- 9.1.1. Biomass
- 9.1.2. Corn
- 9.1.3. Maize
- 9.1.4. Sugar
- 9.1.5. Other Raw Materials
- 9.2. Market Analysis, Insights and Forecast - by Product Type
- 9.2.1. Bio Lactic Acid
- 9.2.2. Bio Acetic Acid
- 9.2.3. Bio Adipic Acid
- 9.2.4. Bio Acrylic Acid
- 9.2.5. Bio Succinic Acid
- 9.2.6. Other Pr
- 9.3. Market Analysis, Insights and Forecast - by Application
- 9.3.1. Polymers
- 9.3.2. Pharmaceuticals
- 9.3.3. Textile
- 9.3.4. Coatings
- 9.3.5. Food and Beverage
- 9.3.6. Other Ap
- 9.1. Market Analysis, Insights and Forecast - by Raw Material
- 10. South America Bio-Organic Acid Industry Analysis, Insights and Forecast, 2020-2032
- 10.1. Market Analysis, Insights and Forecast - by Raw Material
- 10.1.1. Biomass
- 10.1.2. Corn
- 10.1.3. Maize
- 10.1.4. Sugar
- 10.1.5. Other Raw Materials
- 10.2. Market Analysis, Insights and Forecast - by Product Type
- 10.2.1. Bio Lactic Acid
- 10.2.2. Bio Acetic Acid
- 10.2.3. Bio Adipic Acid
- 10.2.4. Bio Acrylic Acid
- 10.2.5. Bio Succinic Acid
- 10.2.6. Other Pr
- 10.3. Market Analysis, Insights and Forecast - by Application
- 10.3.1. Polymers
- 10.3.2. Pharmaceuticals
- 10.3.3. Textile
- 10.3.4. Coatings
- 10.3.5. Food and Beverage
- 10.3.6. Other Ap
- 10.1. Market Analysis, Insights and Forecast - by Raw Material
- 11. Middle East and Africa Bio-Organic Acid Industry Analysis, Insights and Forecast, 2020-2032
- 11.1. Market Analysis, Insights and Forecast - by Raw Material
- 11.1.1. Biomass
- 11.1.2. Corn
- 11.1.3. Maize
- 11.1.4. Sugar
- 11.1.5. Other Raw Materials
- 11.2. Market Analysis, Insights and Forecast - by Product Type
- 11.2.1. Bio Lactic Acid
- 11.2.2. Bio Acetic Acid
- 11.2.3. Bio Adipic Acid
- 11.2.4. Bio Acrylic Acid
- 11.2.5. Bio Succinic Acid
- 11.2.6. Other Pr
- 11.3. Market Analysis, Insights and Forecast - by Application
- 11.3.1. Polymers
- 11.3.2. Pharmaceuticals
- 11.3.3. Textile
- 11.3.4. Coatings
- 11.3.5. Food and Beverage
- 11.3.6. Other Ap
- 11.1. Market Analysis, Insights and Forecast - by Raw Material
- 12. Competitive Analysis
- 12.1. Company Profiles
- 12.1.1 ADM
- 12.1.1.1. Company Overview
- 12.1.1.2. Products
- 12.1.1.3. Company Financials
- 12.1.1.4. SWOT Analysis
- 12.1.2 Cargill Incorporated
- 12.1.2.1. Company Overview
- 12.1.2.2. Products
- 12.1.2.3. Company Financials
- 12.1.2.4. SWOT Analysis
- 12.1.3 Novozymes
- 12.1.3.1. Company Overview
- 12.1.3.2. Products
- 12.1.3.3. Company Financials
- 12.1.3.4. SWOT Analysis
- 12.1.4 Gfbio
- 12.1.4.1. Company Overview
- 12.1.4.2. Products
- 12.1.4.3. Company Financials
- 12.1.4.4. SWOT Analysis
- 12.1.5 Braskem
- 12.1.5.1. Company Overview
- 12.1.5.2. Products
- 12.1.5.3. Company Financials
- 12.1.5.4. SWOT Analysis
- 12.1.6 PTT Global Chemical Public Company Limited*List Not Exhaustive
- 12.1.6.1. Company Overview
- 12.1.6.2. Products
- 12.1.6.3. Company Financials
- 12.1.6.4. SWOT Analysis
- 12.1.7 Mitsubishi Chemical Corporation
- 12.1.7.1. Company Overview
- 12.1.7.2. Products
- 12.1.7.3. Company Financials
- 12.1.7.4. SWOT Analysis
- 12.1.8 Corbion
- 12.1.8.1. Company Overview
- 12.1.8.2. Products
- 12.1.8.3. Company Financials
- 12.1.8.4. SWOT Analysis
- 12.1.9 BioAmber Inc
- 12.1.9.1. Company Overview
- 12.1.9.2. Products
- 12.1.9.3. Company Financials
- 12.1.9.4. SWOT Analysis
- 12.1.10 Cosun
- 12.1.10.1. Company Overview
- 12.1.10.2. Products
- 12.1.10.3. Company Financials
- 12.1.10.4. SWOT Analysis
- 12.1.11 BASF SE
- 12.1.11.1. Company Overview
- 12.1.11.2. Products
- 12.1.11.3. Company Financials
- 12.1.11.4. SWOT Analysis
- 12.1.12 Abengoa
- 12.1.12.1. Company Overview
- 12.1.12.2. Products
- 12.1.12.3. Company Financials
- 12.1.12.4. SWOT Analysis
- 12.1.13 DSM
- 12.1.13.1. Company Overview
- 12.1.13.2. Products
- 12.1.13.3. Company Financials
- 12.1.13.4. SWOT Analysis
- 12.1.14 NatureWorks LLC
- 12.1.14.1. Company Overview
- 12.1.14.2. Products
- 12.1.14.3. Company Financials
- 12.1.14.4. SWOT Analysis
- 12.1.15 Genomatica
- 12.1.15.1. Company Overview
- 12.1.15.2. Products
- 12.1.15.3. Company Financials
- 12.1.15.4. SWOT Analysis
- 12.1.1 ADM
- 12.2. Market Entropy
- 12.2.1 Company's Key Areas Served
- 12.2.2 Recent Developments
- 12.3. Company Market Share Analysis 2025
- 12.3.1 Top 5 Companies Market Share Analysis
- 12.3.2 Top 3 Companies Market Share Analysis
- 12.4. List of Potential Customers
- 13. Research Methodology
List of Figures
- Figure 1: Global Bio-Organic Acid Industry Revenue Breakdown (Million, %) by Region 2025 & 2033
- Figure 2: Global Bio-Organic Acid Industry Volume Breakdown (Million, %) by Region 2025 & 2033
- Figure 3: Asia Pacific Bio-Organic Acid Industry Revenue (Million), by Raw Material 2025 & 2033
- Figure 4: Asia Pacific Bio-Organic Acid Industry Volume (Million), by Raw Material 2025 & 2033
- Figure 5: Asia Pacific Bio-Organic Acid Industry Revenue Share (%), by Raw Material 2025 & 2033
- Figure 6: Asia Pacific Bio-Organic Acid Industry Volume Share (%), by Raw Material 2025 & 2033
- Figure 7: Asia Pacific Bio-Organic Acid Industry Revenue (Million), by Product Type 2025 & 2033
- Figure 8: Asia Pacific Bio-Organic Acid Industry Volume (Million), by Product Type 2025 & 2033
- Figure 9: Asia Pacific Bio-Organic Acid Industry Revenue Share (%), by Product Type 2025 & 2033
- Figure 10: Asia Pacific Bio-Organic Acid Industry Volume Share (%), by Product Type 2025 & 2033
- Figure 11: Asia Pacific Bio-Organic Acid Industry Revenue (Million), by Application 2025 & 2033
- Figure 12: Asia Pacific Bio-Organic Acid Industry Volume (Million), by Application 2025 & 2033
- Figure 13: Asia Pacific Bio-Organic Acid Industry Revenue Share (%), by Application 2025 & 2033
- Figure 14: Asia Pacific Bio-Organic Acid Industry Volume Share (%), by Application 2025 & 2033
- Figure 15: Asia Pacific Bio-Organic Acid Industry Revenue (Million), by Country 2025 & 2033
- Figure 16: Asia Pacific Bio-Organic Acid Industry Volume (Million), by Country 2025 & 2033
- Figure 17: Asia Pacific Bio-Organic Acid Industry Revenue Share (%), by Country 2025 & 2033
- Figure 18: Asia Pacific Bio-Organic Acid Industry Volume Share (%), by Country 2025 & 2033
- Figure 19: North America Bio-Organic Acid Industry Revenue (Million), by Raw Material 2025 & 2033
- Figure 20: North America Bio-Organic Acid Industry Volume (Million), by Raw Material 2025 & 2033
- Figure 21: North America Bio-Organic Acid Industry Revenue Share (%), by Raw Material 2025 & 2033
- Figure 22: North America Bio-Organic Acid Industry Volume Share (%), by Raw Material 2025 & 2033
- Figure 23: North America Bio-Organic Acid Industry Revenue (Million), by Product Type 2025 & 2033
- Figure 24: North America Bio-Organic Acid Industry Volume (Million), by Product Type 2025 & 2033
- Figure 25: North America Bio-Organic Acid Industry Revenue Share (%), by Product Type 2025 & 2033
- Figure 26: North America Bio-Organic Acid Industry Volume Share (%), by Product Type 2025 & 2033
- Figure 27: North America Bio-Organic Acid Industry Revenue (Million), by Application 2025 & 2033
- Figure 28: North America Bio-Organic Acid Industry Volume (Million), by Application 2025 & 2033
- Figure 29: North America Bio-Organic Acid Industry Revenue Share (%), by Application 2025 & 2033
- Figure 30: North America Bio-Organic Acid Industry Volume Share (%), by Application 2025 & 2033
- Figure 31: North America Bio-Organic Acid Industry Revenue (Million), by Country 2025 & 2033
- Figure 32: North America Bio-Organic Acid Industry Volume (Million), by Country 2025 & 2033
- Figure 33: North America Bio-Organic Acid Industry Revenue Share (%), by Country 2025 & 2033
- Figure 34: North America Bio-Organic Acid Industry Volume Share (%), by Country 2025 & 2033
- Figure 35: Europe Bio-Organic Acid Industry Revenue (Million), by Raw Material 2025 & 2033
- Figure 36: Europe Bio-Organic Acid Industry Volume (Million), by Raw Material 2025 & 2033
- Figure 37: Europe Bio-Organic Acid Industry Revenue Share (%), by Raw Material 2025 & 2033
- Figure 38: Europe Bio-Organic Acid Industry Volume Share (%), by Raw Material 2025 & 2033
- Figure 39: Europe Bio-Organic Acid Industry Revenue (Million), by Product Type 2025 & 2033
- Figure 40: Europe Bio-Organic Acid Industry Volume (Million), by Product Type 2025 & 2033
- Figure 41: Europe Bio-Organic Acid Industry Revenue Share (%), by Product Type 2025 & 2033
- Figure 42: Europe Bio-Organic Acid Industry Volume Share (%), by Product Type 2025 & 2033
- Figure 43: Europe Bio-Organic Acid Industry Revenue (Million), by Application 2025 & 2033
- Figure 44: Europe Bio-Organic Acid Industry Volume (Million), by Application 2025 & 2033
- Figure 45: Europe Bio-Organic Acid Industry Revenue Share (%), by Application 2025 & 2033
- Figure 46: Europe Bio-Organic Acid Industry Volume Share (%), by Application 2025 & 2033
- Figure 47: Europe Bio-Organic Acid Industry Revenue (Million), by Country 2025 & 2033
- Figure 48: Europe Bio-Organic Acid Industry Volume (Million), by Country 2025 & 2033
- Figure 49: Europe Bio-Organic Acid Industry Revenue Share (%), by Country 2025 & 2033
- Figure 50: Europe Bio-Organic Acid Industry Volume Share (%), by Country 2025 & 2033
- Figure 51: South America Bio-Organic Acid Industry Revenue (Million), by Raw Material 2025 & 2033
- Figure 52: South America Bio-Organic Acid Industry Volume (Million), by Raw Material 2025 & 2033
- Figure 53: South America Bio-Organic Acid Industry Revenue Share (%), by Raw Material 2025 & 2033
- Figure 54: South America Bio-Organic Acid Industry Volume Share (%), by Raw Material 2025 & 2033
- Figure 55: South America Bio-Organic Acid Industry Revenue (Million), by Product Type 2025 & 2033
- Figure 56: South America Bio-Organic Acid Industry Volume (Million), by Product Type 2025 & 2033
- Figure 57: South America Bio-Organic Acid Industry Revenue Share (%), by Product Type 2025 & 2033
- Figure 58: South America Bio-Organic Acid Industry Volume Share (%), by Product Type 2025 & 2033
- Figure 59: South America Bio-Organic Acid Industry Revenue (Million), by Application 2025 & 2033
- Figure 60: South America Bio-Organic Acid Industry Volume (Million), by Application 2025 & 2033
- Figure 61: South America Bio-Organic Acid Industry Revenue Share (%), by Application 2025 & 2033
- Figure 62: South America Bio-Organic Acid Industry Volume Share (%), by Application 2025 & 2033
- Figure 63: South America Bio-Organic Acid Industry Revenue (Million), by Country 2025 & 2033
- Figure 64: South America Bio-Organic Acid Industry Volume (Million), by Country 2025 & 2033
- Figure 65: South America Bio-Organic Acid Industry Revenue Share (%), by Country 2025 & 2033
- Figure 66: South America Bio-Organic Acid Industry Volume Share (%), by Country 2025 & 2033
- Figure 67: Middle East and Africa Bio-Organic Acid Industry Revenue (Million), by Raw Material 2025 & 2033
- Figure 68: Middle East and Africa Bio-Organic Acid Industry Volume (Million), by Raw Material 2025 & 2033
- Figure 69: Middle East and Africa Bio-Organic Acid Industry Revenue Share (%), by Raw Material 2025 & 2033
- Figure 70: Middle East and Africa Bio-Organic Acid Industry Volume Share (%), by Raw Material 2025 & 2033
- Figure 71: Middle East and Africa Bio-Organic Acid Industry Revenue (Million), by Product Type 2025 & 2033
- Figure 72: Middle East and Africa Bio-Organic Acid Industry Volume (Million), by Product Type 2025 & 2033
- Figure 73: Middle East and Africa Bio-Organic Acid Industry Revenue Share (%), by Product Type 2025 & 2033
- Figure 74: Middle East and Africa Bio-Organic Acid Industry Volume Share (%), by Product Type 2025 & 2033
- Figure 75: Middle East and Africa Bio-Organic Acid Industry Revenue (Million), by Application 2025 & 2033
- Figure 76: Middle East and Africa Bio-Organic Acid Industry Volume (Million), by Application 2025 & 2033
- Figure 77: Middle East and Africa Bio-Organic Acid Industry Revenue Share (%), by Application 2025 & 2033
- Figure 78: Middle East and Africa Bio-Organic Acid Industry Volume Share (%), by Application 2025 & 2033
- Figure 79: Middle East and Africa Bio-Organic Acid Industry Revenue (Million), by Country 2025 & 2033
- Figure 80: Middle East and Africa Bio-Organic Acid Industry Volume (Million), by Country 2025 & 2033
- Figure 81: Middle East and Africa Bio-Organic Acid Industry Revenue Share (%), by Country 2025 & 2033
- Figure 82: Middle East and Africa Bio-Organic Acid Industry Volume Share (%), by Country 2025 & 2033
List of Tables
- Table 1: Global Bio-Organic Acid Industry Revenue Million Forecast, by Raw Material 2020 & 2033
- Table 2: Global Bio-Organic Acid Industry Volume Million Forecast, by Raw Material 2020 & 2033
- Table 3: Global Bio-Organic Acid Industry Revenue Million Forecast, by Product Type 2020 & 2033
- Table 4: Global Bio-Organic Acid Industry Volume Million Forecast, by Product Type 2020 & 2033
- Table 5: Global Bio-Organic Acid Industry Revenue Million Forecast, by Application 2020 & 2033
- Table 6: Global Bio-Organic Acid Industry Volume Million Forecast, by Application 2020 & 2033
- Table 7: Global Bio-Organic Acid Industry Revenue Million Forecast, by Region 2020 & 2033
- Table 8: Global Bio-Organic Acid Industry Volume Million Forecast, by Region 2020 & 2033
- Table 9: Global Bio-Organic Acid Industry Revenue Million Forecast, by Raw Material 2020 & 2033
- Table 10: Global Bio-Organic Acid Industry Volume Million Forecast, by Raw Material 2020 & 2033
- Table 11: Global Bio-Organic Acid Industry Revenue Million Forecast, by Product Type 2020 & 2033
- Table 12: Global Bio-Organic Acid Industry Volume Million Forecast, by Product Type 2020 & 2033
- Table 13: Global Bio-Organic Acid Industry Revenue Million Forecast, by Application 2020 & 2033
- Table 14: Global Bio-Organic Acid Industry Volume Million Forecast, by Application 2020 & 2033
- Table 15: Global Bio-Organic Acid Industry Revenue Million Forecast, by Country 2020 & 2033
- Table 16: Global Bio-Organic Acid Industry Volume Million Forecast, by Country 2020 & 2033
- Table 17: China Bio-Organic Acid Industry Revenue (Million) Forecast, by Application 2020 & 2033
- Table 18: China Bio-Organic Acid Industry Volume (Million) Forecast, by Application 2020 & 2033
- Table 19: India Bio-Organic Acid Industry Revenue (Million) Forecast, by Application 2020 & 2033
- Table 20: India Bio-Organic Acid Industry Volume (Million) Forecast, by Application 2020 & 2033
- Table 21: Japan Bio-Organic Acid Industry Revenue (Million) Forecast, by Application 2020 & 2033
- Table 22: Japan Bio-Organic Acid Industry Volume (Million) Forecast, by Application 2020 & 2033
- Table 23: South Korea Bio-Organic Acid Industry Revenue (Million) Forecast, by Application 2020 & 2033
- Table 24: South Korea Bio-Organic Acid Industry Volume (Million) Forecast, by Application 2020 & 2033
- Table 25: Rest of Asia Pacific Bio-Organic Acid Industry Revenue (Million) Forecast, by Application 2020 & 2033
- Table 26: Rest of Asia Pacific Bio-Organic Acid Industry Volume (Million) Forecast, by Application 2020 & 2033
- Table 27: Global Bio-Organic Acid Industry Revenue Million Forecast, by Raw Material 2020 & 2033
- Table 28: Global Bio-Organic Acid Industry Volume Million Forecast, by Raw Material 2020 & 2033
- Table 29: Global Bio-Organic Acid Industry Revenue Million Forecast, by Product Type 2020 & 2033
- Table 30: Global Bio-Organic Acid Industry Volume Million Forecast, by Product Type 2020 & 2033
- Table 31: Global Bio-Organic Acid Industry Revenue Million Forecast, by Application 2020 & 2033
- Table 32: Global Bio-Organic Acid Industry Volume Million Forecast, by Application 2020 & 2033
- Table 33: Global Bio-Organic Acid Industry Revenue Million Forecast, by Country 2020 & 2033
- Table 34: Global Bio-Organic Acid Industry Volume Million Forecast, by Country 2020 & 2033
- Table 35: United States Bio-Organic Acid Industry Revenue (Million) Forecast, by Application 2020 & 2033
- Table 36: United States Bio-Organic Acid Industry Volume (Million) Forecast, by Application 2020 & 2033
- Table 37: Canada Bio-Organic Acid Industry Revenue (Million) Forecast, by Application 2020 & 2033
- Table 38: Canada Bio-Organic Acid Industry Volume (Million) Forecast, by Application 2020 & 2033
- Table 39: Mexico Bio-Organic Acid Industry Revenue (Million) Forecast, by Application 2020 & 2033
- Table 40: Mexico Bio-Organic Acid Industry Volume (Million) Forecast, by Application 2020 & 2033
- Table 41: Global Bio-Organic Acid Industry Revenue Million Forecast, by Raw Material 2020 & 2033
- Table 42: Global Bio-Organic Acid Industry Volume Million Forecast, by Raw Material 2020 & 2033
- Table 43: Global Bio-Organic Acid Industry Revenue Million Forecast, by Product Type 2020 & 2033
- Table 44: Global Bio-Organic Acid Industry Volume Million Forecast, by Product Type 2020 & 2033
- Table 45: Global Bio-Organic Acid Industry Revenue Million Forecast, by Application 2020 & 2033
- Table 46: Global Bio-Organic Acid Industry Volume Million Forecast, by Application 2020 & 2033
- Table 47: Global Bio-Organic Acid Industry Revenue Million Forecast, by Country 2020 & 2033
- Table 48: Global Bio-Organic Acid Industry Volume Million Forecast, by Country 2020 & 2033
- Table 49: Germany Bio-Organic Acid Industry Revenue (Million) Forecast, by Application 2020 & 2033
- Table 50: Germany Bio-Organic Acid Industry Volume (Million) Forecast, by Application 2020 & 2033
- Table 51: United Kingdom Bio-Organic Acid Industry Revenue (Million) Forecast, by Application 2020 & 2033
- Table 52: United Kingdom Bio-Organic Acid Industry Volume (Million) Forecast, by Application 2020 & 2033
- Table 53: Italy Bio-Organic Acid Industry Revenue (Million) Forecast, by Application 2020 & 2033
- Table 54: Italy Bio-Organic Acid Industry Volume (Million) Forecast, by Application 2020 & 2033
- Table 55: France Bio-Organic Acid Industry Revenue (Million) Forecast, by Application 2020 & 2033
- Table 56: France Bio-Organic Acid Industry Volume (Million) Forecast, by Application 2020 & 2033
- Table 57: Rest of Europe Bio-Organic Acid Industry Revenue (Million) Forecast, by Application 2020 & 2033
- Table 58: Rest of Europe Bio-Organic Acid Industry Volume (Million) Forecast, by Application 2020 & 2033
- Table 59: Global Bio-Organic Acid Industry Revenue Million Forecast, by Raw Material 2020 & 2033
- Table 60: Global Bio-Organic Acid Industry Volume Million Forecast, by Raw Material 2020 & 2033
- Table 61: Global Bio-Organic Acid Industry Revenue Million Forecast, by Product Type 2020 & 2033
- Table 62: Global Bio-Organic Acid Industry Volume Million Forecast, by Product Type 2020 & 2033
- Table 63: Global Bio-Organic Acid Industry Revenue Million Forecast, by Application 2020 & 2033
- Table 64: Global Bio-Organic Acid Industry Volume Million Forecast, by Application 2020 & 2033
- Table 65: Global Bio-Organic Acid Industry Revenue Million Forecast, by Country 2020 & 2033
- Table 66: Global Bio-Organic Acid Industry Volume Million Forecast, by Country 2020 & 2033
- Table 67: Brazil Bio-Organic Acid Industry Revenue (Million) Forecast, by Application 2020 & 2033
- Table 68: Brazil Bio-Organic Acid Industry Volume (Million) Forecast, by Application 2020 & 2033
- Table 69: Argentina Bio-Organic Acid Industry Revenue (Million) Forecast, by Application 2020 & 2033
- Table 70: Argentina Bio-Organic Acid Industry Volume (Million) Forecast, by Application 2020 & 2033
- Table 71: Rest of South America Bio-Organic Acid Industry Revenue (Million) Forecast, by Application 2020 & 2033
- Table 72: Rest of South America Bio-Organic Acid Industry Volume (Million) Forecast, by Application 2020 & 2033
- Table 73: Global Bio-Organic Acid Industry Revenue Million Forecast, by Raw Material 2020 & 2033
- Table 74: Global Bio-Organic Acid Industry Volume Million Forecast, by Raw Material 2020 & 2033
- Table 75: Global Bio-Organic Acid Industry Revenue Million Forecast, by Product Type 2020 & 2033
- Table 76: Global Bio-Organic Acid Industry Volume Million Forecast, by Product Type 2020 & 2033
- Table 77: Global Bio-Organic Acid Industry Revenue Million Forecast, by Application 2020 & 2033
- Table 78: Global Bio-Organic Acid Industry Volume Million Forecast, by Application 2020 & 2033
- Table 79: Global Bio-Organic Acid Industry Revenue Million Forecast, by Country 2020 & 2033
- Table 80: Global Bio-Organic Acid Industry Volume Million Forecast, by Country 2020 & 2033
- Table 81: Saudi Arabia Bio-Organic Acid Industry Revenue (Million) Forecast, by Application 2020 & 2033
- Table 82: Saudi Arabia Bio-Organic Acid Industry Volume (Million) Forecast, by Application 2020 & 2033
- Table 83: South Africa Bio-Organic Acid Industry Revenue (Million) Forecast, by Application 2020 & 2033
- Table 84: South Africa Bio-Organic Acid Industry Volume (Million) Forecast, by Application 2020 & 2033
- Table 85: Rest of Middle East and Africa Bio-Organic Acid Industry Revenue (Million) Forecast, by Application 2020 & 2033
- Table 86: Rest of Middle East and Africa Bio-Organic Acid Industry Volume (Million) Forecast, by Application 2020 & 2033
Frequently Asked Questions
1. What is the projected Compound Annual Growth Rate (CAGR) of the Bio-Organic Acid Industry?
The projected CAGR is approximately > 6.00%.
2. Which companies are prominent players in the Bio-Organic Acid Industry?
Key companies in the market include ADM, Cargill Incorporated, Novozymes, Gfbio, Braskem, PTT Global Chemical Public Company Limited*List Not Exhaustive, Mitsubishi Chemical Corporation, Corbion, BioAmber Inc, Cosun, BASF SE, Abengoa, DSM, NatureWorks LLC, Genomatica.
3. What are the main segments of the Bio-Organic Acid Industry?
The market segments include Raw Material, Product Type, Application.
4. Can you provide details about the market size?
The market size is estimated to be USD XX Million as of 2022.
5. What are some drivers contributing to market growth?
Stringent Regulations Over Conventional Organic Acids; Growing Demand for Bio-based Polymer in Healthcare Applications; Other Drivers.
6. What are the notable trends driving market growth?
Food and Beverage Industry to Dominate The Market.
7. Are there any restraints impacting market growth?
Higher Production Cost of Bio-based Chemicals; Other Restraints.
8. Can you provide examples of recent developments in the market?
October 2022: Corbion announced the production of bio-based lactic acid to fulfill the rising demand for environmentally friendly solutions in the Asia-Pacific region. The company announced its plans to build a new lactic acid facility in Thailand. The company's dedication to supplying bio-based organic acids to a larger market is demonstrated by its expansion.
9. What pricing options are available for accessing the report?
Pricing options include single-user, multi-user, and enterprise licenses priced at USD 4750, USD 5250, and USD 8750 respectively.
10. Is the market size provided in terms of value or volume?
The market size is provided in terms of value, measured in Million and volume, measured in Million.
11. Are there any specific market keywords associated with the report?
Yes, the market keyword associated with the report is "Bio-Organic Acid Industry," which aids in identifying and referencing the specific market segment covered.
12. How do I determine which pricing option suits my needs best?
The pricing options vary based on user requirements and access needs. Individual users may opt for single-user licenses, while businesses requiring broader access may choose multi-user or enterprise licenses for cost-effective access to the report.
13. Are there any additional resources or data provided in the Bio-Organic Acid Industry report?
While the report offers comprehensive insights, it's advisable to review the specific contents or supplementary materials provided to ascertain if additional resources or data are available.
14. How can I stay updated on further developments or reports in the Bio-Organic Acid Industry?
To stay informed about further developments, trends, and reports in the Bio-Organic Acid Industry, consider subscribing to industry newsletters, following relevant companies and organizations, or regularly checking reputable industry news sources and publications.
Methodology
Step 1 - Identification of Relevant Samples Size from Population Database


Step 2 - Approaches for Defining Global Market Size (Value, Volume* & Price*)

Note*: In applicable scenarios
Step 3 - Data Sources
Primary Research
- Web Analytics
- Survey Reports
- Research Institute
- Latest Research Reports
- Opinion Leaders
Secondary Research
- Annual Reports
- White Paper
- Latest Press Release
- Industry Association
- Paid Database
- Investor Presentations

Step 4 - Data Triangulation
Involves using different sources of information in order to increase the validity of a study
These sources are likely to be stakeholders in a program - participants, other researchers, program staff, other community members, and so on.
Then we put all data in single framework & apply various statistical tools to find out the dynamic on the market.
During the analysis stage, feedback from the stakeholder groups would be compared to determine areas of agreement as well as areas of divergence