

Key Insights
The global bioethanol market, projected to reach 66.99 billion by 2025, is set to witness substantial expansion, with a CAGR of 11.7% from 2025 to 2033. This growth is propelled by escalating demand for sustainable transportation fuels, driven by stringent emission regulations and government biofuel mandates. Growing environmental awareness and the imperative to reduce carbon footprints are further accelerating bioethanol adoption as a cleaner alternative to fossil fuels. Beyond its primary use in fuels, bioethanol's versatility across food & beverage, pharmaceuticals, and cosmetics industries significantly broadens its market appeal and growth potential. Continuous advancements in production technologies, enhancing efficiency and reducing costs, are also instrumental in this expansion.
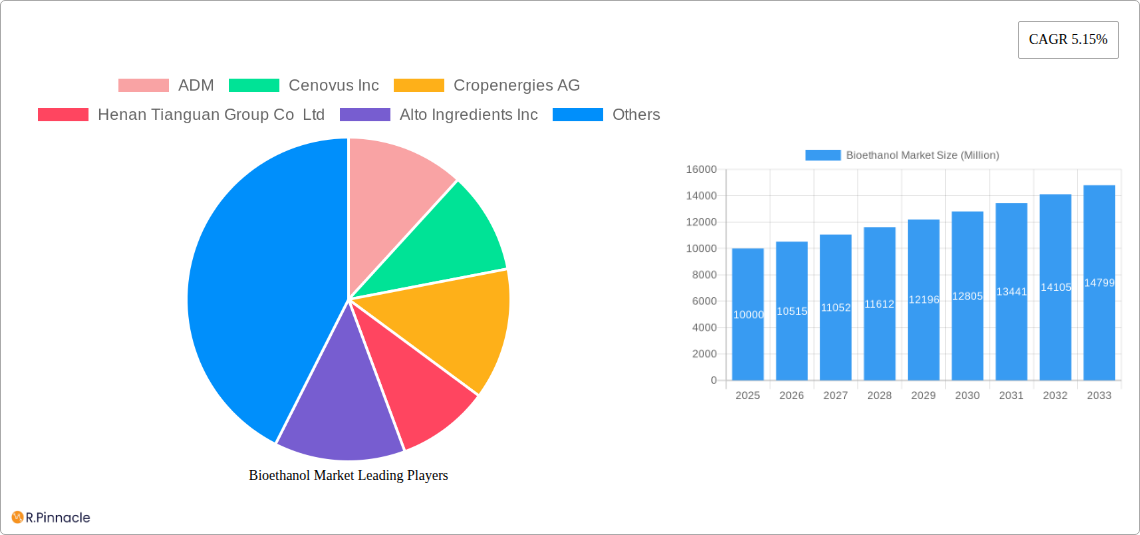
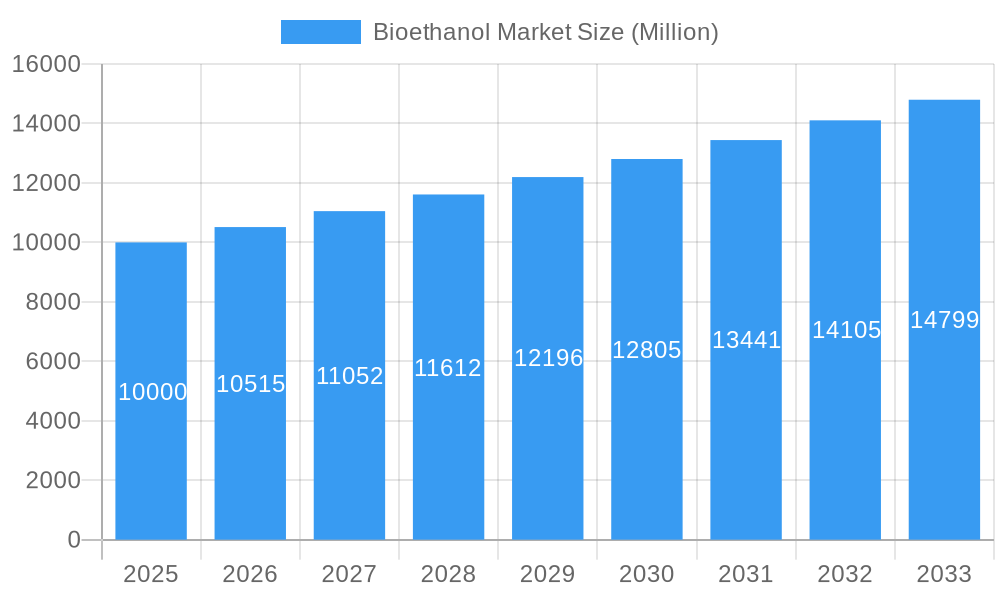
Bioethanol Market Market Size (In Billion)
Key challenges include feedstock price volatility (e.g., sugarcane, corn, wheat), which impacts production costs. Competition from alternative biofuels and feedstock availability constraints in certain regions present further hurdles. Nevertheless, sustained governmental support, heightened environmental consciousness, and ongoing technological innovations ensure a positive long-term outlook for the bioethanol market. The diverse applications across multiple sectors solidify its ongoing relevance and growth trajectory within the renewable energy sector. Leading companies such as ADM, Poet LLC, and Raizen are well-positioned to leverage this expansion through their established infrastructure and expertise. Strategic geographic diversification into regions with supportive policies and abundant feedstock will be crucial for future market development.
Bioethanol Market Company Market Share
Bioethanol Market Report: 2019-2033 Forecast
This comprehensive report provides a detailed analysis of the global bioethanol market, offering actionable insights for industry professionals, investors, and stakeholders. Covering the period from 2019 to 2033, with a focus on 2025, this report meticulously examines market dynamics, key players, and future growth potential. The study encompasses detailed segmentation by feedstock type (sugarcane, corn, wheat, and others) and application (automotive and transportation, food and beverage, pharmaceutical, cosmetics and personal care, and others), offering a granular understanding of this dynamic market.
Bioethanol Market Structure & Innovation Trends
This section analyzes the competitive landscape of the bioethanol market, examining market concentration, innovation drivers, regulatory frameworks, product substitutes, end-user demographics, and mergers & acquisitions (M&A) activities. The report quantifies market share amongst key players and assesses the value of significant M&A deals.
The market exhibits a moderately concentrated structure, with several major players holding significant shares. However, the presence of numerous smaller companies indicates a competitive landscape. Innovation is driven by the need for sustainable fuel alternatives and the development of advanced bioethanol production technologies, including cellulosic ethanol. Regulatory frameworks play a crucial role, influencing both production and consumption patterns. Substitutes like biodiesel and other renewable fuels present competition, while consumer demand for sustainable products fuels growth. M&A activity reflects consolidation and efforts to expand market presence. Key metrics within the report include a detailed breakdown of market share held by leading players like ADM, Green Plains Inc., and others, along with analysis of total M&A deal value in the market surpassing xx Million in the past five years.
Bioethanol Market Dynamics & Trends
This section dives deep into the factors driving market growth, highlighting technological advancements, evolving consumer preferences, and the competitive dynamics shaping the bioethanol industry. The report includes projections for the Compound Annual Growth Rate (CAGR) and market penetration.
The global bioethanol market is experiencing robust growth, fueled by increasing demand for renewable energy sources, stringent environmental regulations, and government incentives promoting biofuel adoption. Technological advancements in feedstock conversion and production efficiency are improving cost-competitiveness. Consumer preference for eco-friendly products further drives demand, particularly in the automotive and transportation sectors. The competitive landscape involves intense rivalry, with major players focusing on strategic partnerships, investments in R&D, and capacity expansions to secure market share. The projected CAGR for the forecast period (2025-2033) is estimated at xx%, with market penetration exceeding xx% by 2033.
Dominant Regions & Segments in Bioethanol Market
This section identifies the leading regions, countries, and market segments within the bioethanol industry. A detailed analysis of key drivers influencing dominance is provided for each segment.
Leading Regions: Brazil and the United States consistently dominate global bioethanol production due to large-scale agricultural production and supportive government policies. [Paragraph detailing the reasons for their dominance, including economic policies, infrastructure, and established supply chains].
Leading Feedstock Type: Corn remains a dominant feedstock due to widespread cultivation and established processing infrastructure in major markets. [Paragraph detailing specific drivers, including agricultural subsidies, economies of scale].
Leading Application: The automotive and transportation sector consumes the largest share of bioethanol due to its role as a gasoline additive and blendstock in many countries. [Paragraph detailing reasons such as government mandates, infrastructure for distribution].
Bioethanol Market Product Innovations
This section summarizes recent product developments, focusing on technological trends and market fit.
Significant innovations are shaping the bioethanol market, including advancements in enzyme technology to enhance feedstock conversion and the development of next-generation cellulosic ethanol production methods. These advancements are improving the efficiency and reducing the cost of bioethanol production, broadening its applicability and competitiveness in various segments. The focus is shifting towards sustainable and environmentally friendly solutions, meeting the growing demands of the market and regulatory compliance.
Report Scope & Segmentation Analysis
This section details the market segmentation by feedstock type and application, including growth projections, market sizes, and competitive dynamics.
Feedstock Type: The market is segmented into sugarcane, corn, wheat, and other feedstock types. Each segment's growth is influenced by factors such as crop yields, prices, and government policies. [Insert brief paragraph on each segment, including estimated market size in Million and competitive landscape].
Application: The market is segmented into automotive & transportation, food & beverage, pharmaceutical, cosmetics & personal care, and other applications. Growth in each segment is driven by diverse factors, ranging from environmental regulations to consumer preferences. [Insert brief paragraph on each segment, including estimated market size in Million and competitive landscape].
Key Drivers of Bioethanol Market Growth
This section outlines the key factors propelling bioethanol market expansion.
The bioethanol market is propelled by several key factors: increasing demand for renewable energy; stringent environmental regulations aimed at reducing greenhouse gas emissions; supportive government policies including subsidies and tax incentives; and the growing consumer preference for sustainable and environmentally friendly products. Advancements in bioethanol production technology also play a crucial role, enhancing efficiency and cost-effectiveness.
Challenges in the Bioethanol Market Sector
This section addresses significant barriers and constraints impacting the bioethanol market.
The bioethanol market faces challenges including competition from other renewable fuels, fluctuations in feedstock prices, land-use concerns, and logistical limitations in transportation and distribution. Additionally, regulatory uncertainties and the need for continuous technological advancements to enhance cost competitiveness represent significant hurdles. The impact of these challenges on market growth is quantified within the complete report.
Emerging Opportunities in Bioethanol Market
This section highlights promising trends and opportunities for bioethanol market expansion.
Emerging opportunities include the development of advanced biofuels such as sustainable aviation fuel (SAF), expansion into new geographical markets, and the utilization of novel feedstocks, including agricultural residues and waste materials. Growing consumer awareness of environmental sustainability and increasing demand for bio-based chemicals create additional opportunities for market expansion.
Leading Players in the Bioethanol Market
- ADM
- Cenovus Inc
- Cropenergies AG
- Henan Tianguan Group Co Ltd
- Alto Ingredients Inc
- Green Plains Inc
- Suncor Energy Inc
- Valero
- Ethanol Technologies
- Verbio Vereinigte Bioenergie AG
- Abengoa
- Granbio Investimentos SA
- Sekab
- Blue Bio Fuels Inc
- Lantmannen
- Tereos
- Cristalco
- Poet LLC
- Jilin Fuel Ethanol Co Ltd
- Raizen
- KWST
Key Developments in Bioethanol Market Industry
January 2023: United Airlines, Tallgrass, and Green Plains Inc. announced a joint venture with Blue Blade Energy to develop and commercialize a novel Sustainable Aviation Fuel (SAF) technology using ethanol feedstock. This signifies a major step towards the decarbonization of the aviation industry and opens a new market segment for bioethanol.
September 2022: CropEnergies AG acquired a stake in Syclus BV, a Dutch startup focusing on bio-based chemicals. This strategic move expands CropEnergies' portfolio into the renewable chemicals sector and showcases the diversification potential within the bioethanol industry.
May 2022: Blue Biofuels Inc. announced progress on its fifth-generation Cellulose-to-Sugar (CTS) machine, moving towards commercialization. This signifies a leap forward in cellulosic ethanol production, unlocking the potential of non-food feedstocks.
Future Outlook for Bioethanol Market
The future outlook for the bioethanol market is positive, driven by the continuous growth of renewable energy demand, ongoing technological advancements in biofuel production, supportive government policies, and growing consumer awareness of environmental sustainability. The market is poised for considerable growth, with strategic opportunities emerging in the development of advanced biofuels and expansion into new applications. These factors collectively promise a significant increase in bioethanol market size and value over the forecast period.
Bioethanol Market Segmentation
-
1. Feedstock Type
- 1.1. Sugarcane
- 1.2. Corn
- 1.3. Wheat
- 1.4. Other Feedstock Types
-
2. Application
- 2.1. Automotive and Transportation
- 2.2. Food and Beverage
- 2.3. Pharmaceutical
- 2.4. Cosmetics and Personal Care
- 2.5. Other Applications
Bioethanol Market Segmentation By Geography
-
1. Asia Pacific
- 1.1. China
- 1.2. India
- 1.3. Japan
- 1.4. South Korea
- 1.5. Rest of Asia Pacific
-
2. North America
- 2.1. United States
- 2.2. Canada
- 2.3. Mexico
-
3. Europe
- 3.1. Germany
- 3.2. United Kingdom
- 3.3. France
- 3.4. Italy
- 3.5. Rest of Europe
-
4. South America
- 4.1. Brazil
- 4.2. Argentina
- 4.3. Rest of South America
-
5. Middle East and Africa
- 5.1. Saudi Arabia
- 5.2. South Africa
- 5.3. Rest of Middle East and Africa
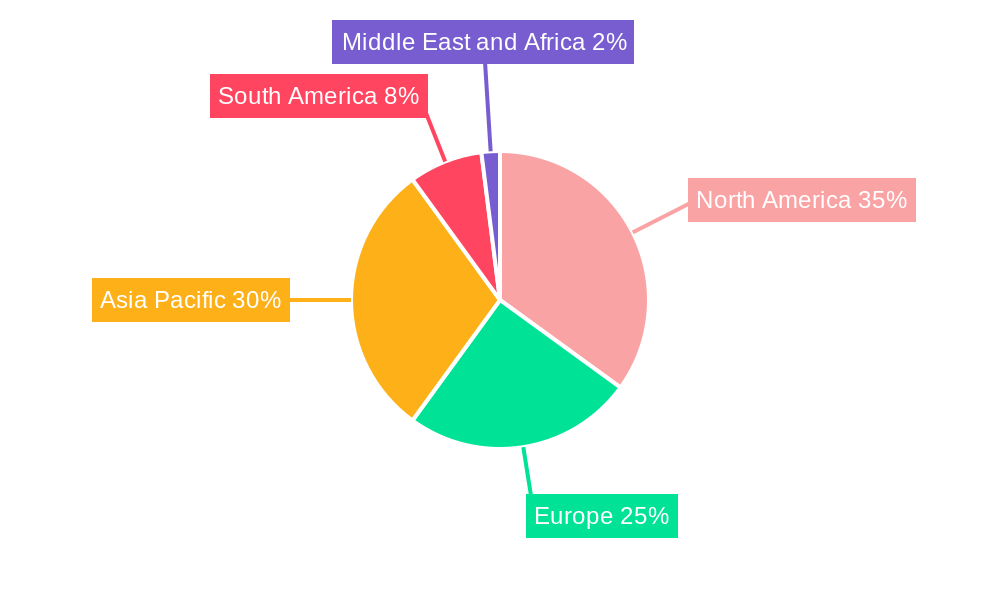
Bioethanol Market Regional Market Share
Geographic Coverage of Bioethanol Market
Bioethanol Market REPORT HIGHLIGHTS
| Aspects | Details |
|---|---|
| Study Period | 2020-2034 |
| Base Year | 2025 |
| Estimated Year | 2026 |
| Forecast Period | 2026-2034 |
| Historical Period | 2020-2025 |
| Growth Rate | CAGR of 11.7% from 2020-2034 |
| Segmentation |
|
Table of Contents
- 1. Introduction
- 1.1. Research Scope
- 1.2. Market Segmentation
- 1.3. Research Objective
- 1.4. Definitions and Assumptions
- 2. Executive Summary
- 2.1. Market Snapshot
- 3. Market Dynamics
- 3.1. Market Drivers
- 3.2. Market Restrains
- 3.3. Market Trends
- 3.4. Market Opportunities
- 4. Market Factor Analysis
- 4.1. Porters Five Forces
- 4.1.1. Bargaining Power of Suppliers
- 4.1.2. Bargaining Power of Buyers
- 4.1.3. Threat of New Entrants
- 4.1.4. Threat of Substitutes
- 4.1.5. Competitive Rivalry
- 4.2. PESTEL analysis
- 4.3. BCG Analysis
- 4.3.1. Stars (High Growth, High Market Share)
- 4.3.2. Cash Cows (Low Growth, High Market Share)
- 4.3.3. Question Mark (High Growth, Low Market Share)
- 4.3.4. Dogs (Low Growth, Low Market Share)
- 4.4. Ansoff Matrix Analysis
- 4.5. Supply Chain Analysis
- 4.6. Regulatory Landscape
- 4.7. Current Market Potential and Opportunity Assessment (TAM–SAM–SOM Framework)
- 4.8. PRI Analyst Note
- 4.1. Porters Five Forces
- 5. Market Analysis, Insights and Forecast 2021-2033
- 5.1. Market Analysis, Insights and Forecast - by Feedstock Type
- 5.1.1. Sugarcane
- 5.1.2. Corn
- 5.1.3. Wheat
- 5.1.4. Other Feedstock Types
- 5.2. Market Analysis, Insights and Forecast - by Application
- 5.2.1. Automotive and Transportation
- 5.2.2. Food and Beverage
- 5.2.3. Pharmaceutical
- 5.2.4. Cosmetics and Personal Care
- 5.2.5. Other Applications
- 5.3. Market Analysis, Insights and Forecast - by Region
- 5.3.1. Asia Pacific
- 5.3.2. North America
- 5.3.3. Europe
- 5.3.4. South America
- 5.3.5. Middle East and Africa
- 5.1. Market Analysis, Insights and Forecast - by Feedstock Type
- 6. Global Bioethanol Market Analysis, Insights and Forecast, 2021-2033
- 6.1. Market Analysis, Insights and Forecast - by Feedstock Type
- 6.1.1. Sugarcane
- 6.1.2. Corn
- 6.1.3. Wheat
- 6.1.4. Other Feedstock Types
- 6.2. Market Analysis, Insights and Forecast - by Application
- 6.2.1. Automotive and Transportation
- 6.2.2. Food and Beverage
- 6.2.3. Pharmaceutical
- 6.2.4. Cosmetics and Personal Care
- 6.2.5. Other Applications
- 6.1. Market Analysis, Insights and Forecast - by Feedstock Type
- 7. Asia Pacific Bioethanol Market Analysis, Insights and Forecast, 2020-2032
- 7.1. Market Analysis, Insights and Forecast - by Feedstock Type
- 7.1.1. Sugarcane
- 7.1.2. Corn
- 7.1.3. Wheat
- 7.1.4. Other Feedstock Types
- 7.2. Market Analysis, Insights and Forecast - by Application
- 7.2.1. Automotive and Transportation
- 7.2.2. Food and Beverage
- 7.2.3. Pharmaceutical
- 7.2.4. Cosmetics and Personal Care
- 7.2.5. Other Applications
- 7.1. Market Analysis, Insights and Forecast - by Feedstock Type
- 8. North America Bioethanol Market Analysis, Insights and Forecast, 2020-2032
- 8.1. Market Analysis, Insights and Forecast - by Feedstock Type
- 8.1.1. Sugarcane
- 8.1.2. Corn
- 8.1.3. Wheat
- 8.1.4. Other Feedstock Types
- 8.2. Market Analysis, Insights and Forecast - by Application
- 8.2.1. Automotive and Transportation
- 8.2.2. Food and Beverage
- 8.2.3. Pharmaceutical
- 8.2.4. Cosmetics and Personal Care
- 8.2.5. Other Applications
- 8.1. Market Analysis, Insights and Forecast - by Feedstock Type
- 9. Europe Bioethanol Market Analysis, Insights and Forecast, 2020-2032
- 9.1. Market Analysis, Insights and Forecast - by Feedstock Type
- 9.1.1. Sugarcane
- 9.1.2. Corn
- 9.1.3. Wheat
- 9.1.4. Other Feedstock Types
- 9.2. Market Analysis, Insights and Forecast - by Application
- 9.2.1. Automotive and Transportation
- 9.2.2. Food and Beverage
- 9.2.3. Pharmaceutical
- 9.2.4. Cosmetics and Personal Care
- 9.2.5. Other Applications
- 9.1. Market Analysis, Insights and Forecast - by Feedstock Type
- 10. South America Bioethanol Market Analysis, Insights and Forecast, 2020-2032
- 10.1. Market Analysis, Insights and Forecast - by Feedstock Type
- 10.1.1. Sugarcane
- 10.1.2. Corn
- 10.1.3. Wheat
- 10.1.4. Other Feedstock Types
- 10.2. Market Analysis, Insights and Forecast - by Application
- 10.2.1. Automotive and Transportation
- 10.2.2. Food and Beverage
- 10.2.3. Pharmaceutical
- 10.2.4. Cosmetics and Personal Care
- 10.2.5. Other Applications
- 10.1. Market Analysis, Insights and Forecast - by Feedstock Type
- 11. Middle East and Africa Bioethanol Market Analysis, Insights and Forecast, 2020-2032
- 11.1. Market Analysis, Insights and Forecast - by Feedstock Type
- 11.1.1. Sugarcane
- 11.1.2. Corn
- 11.1.3. Wheat
- 11.1.4. Other Feedstock Types
- 11.2. Market Analysis, Insights and Forecast - by Application
- 11.2.1. Automotive and Transportation
- 11.2.2. Food and Beverage
- 11.2.3. Pharmaceutical
- 11.2.4. Cosmetics and Personal Care
- 11.2.5. Other Applications
- 11.1. Market Analysis, Insights and Forecast - by Feedstock Type
- 12. Competitive Analysis
- 12.1. Company Profiles
- 12.1.1 ADM
- 12.1.1.1. Company Overview
- 12.1.1.2. Products
- 12.1.1.3. Company Financials
- 12.1.1.4. SWOT Analysis
- 12.1.2 Cenovus Inc
- 12.1.2.1. Company Overview
- 12.1.2.2. Products
- 12.1.2.3. Company Financials
- 12.1.2.4. SWOT Analysis
- 12.1.3 Cropenergies AG
- 12.1.3.1. Company Overview
- 12.1.3.2. Products
- 12.1.3.3. Company Financials
- 12.1.3.4. SWOT Analysis
- 12.1.4 Henan Tianguan Group Co Ltd
- 12.1.4.1. Company Overview
- 12.1.4.2. Products
- 12.1.4.3. Company Financials
- 12.1.4.4. SWOT Analysis
- 12.1.5 Alto Ingredients Inc
- 12.1.5.1. Company Overview
- 12.1.5.2. Products
- 12.1.5.3. Company Financials
- 12.1.5.4. SWOT Analysis
- 12.1.6 Green Plains Inc
- 12.1.6.1. Company Overview
- 12.1.6.2. Products
- 12.1.6.3. Company Financials
- 12.1.6.4. SWOT Analysis
- 12.1.7 Suncor Energy Inc
- 12.1.7.1. Company Overview
- 12.1.7.2. Products
- 12.1.7.3. Company Financials
- 12.1.7.4. SWOT Analysis
- 12.1.8 Valero
- 12.1.8.1. Company Overview
- 12.1.8.2. Products
- 12.1.8.3. Company Financials
- 12.1.8.4. SWOT Analysis
- 12.1.9 Ethanol Technologies
- 12.1.9.1. Company Overview
- 12.1.9.2. Products
- 12.1.9.3. Company Financials
- 12.1.9.4. SWOT Analysis
- 12.1.10 Verbio Vereinigte Bioenergie AG*List Not Exhaustive
- 12.1.10.1. Company Overview
- 12.1.10.2. Products
- 12.1.10.3. Company Financials
- 12.1.10.4. SWOT Analysis
- 12.1.11 Abengoa
- 12.1.11.1. Company Overview
- 12.1.11.2. Products
- 12.1.11.3. Company Financials
- 12.1.11.4. SWOT Analysis
- 12.1.12 Granbio Investimentos SA
- 12.1.12.1. Company Overview
- 12.1.12.2. Products
- 12.1.12.3. Company Financials
- 12.1.12.4. SWOT Analysis
- 12.1.13 Sekab
- 12.1.13.1. Company Overview
- 12.1.13.2. Products
- 12.1.13.3. Company Financials
- 12.1.13.4. SWOT Analysis
- 12.1.14 Blue Bio Fuels Inc
- 12.1.14.1. Company Overview
- 12.1.14.2. Products
- 12.1.14.3. Company Financials
- 12.1.14.4. SWOT Analysis
- 12.1.15 Lantmannen
- 12.1.15.1. Company Overview
- 12.1.15.2. Products
- 12.1.15.3. Company Financials
- 12.1.15.4. SWOT Analysis
- 12.1.16 Tereos
- 12.1.16.1. Company Overview
- 12.1.16.2. Products
- 12.1.16.3. Company Financials
- 12.1.16.4. SWOT Analysis
- 12.1.17 Cristalco
- 12.1.17.1. Company Overview
- 12.1.17.2. Products
- 12.1.17.3. Company Financials
- 12.1.17.4. SWOT Analysis
- 12.1.18 Poet LLC
- 12.1.18.1. Company Overview
- 12.1.18.2. Products
- 12.1.18.3. Company Financials
- 12.1.18.4. SWOT Analysis
- 12.1.19 Jilin Fuel Ethanol Co Ltd
- 12.1.19.1. Company Overview
- 12.1.19.2. Products
- 12.1.19.3. Company Financials
- 12.1.19.4. SWOT Analysis
- 12.1.20 Raizen
- 12.1.20.1. Company Overview
- 12.1.20.2. Products
- 12.1.20.3. Company Financials
- 12.1.20.4. SWOT Analysis
- 12.1.21 KWST
- 12.1.21.1. Company Overview
- 12.1.21.2. Products
- 12.1.21.3. Company Financials
- 12.1.21.4. SWOT Analysis
- 12.1.1 ADM
- 12.2. Market Entropy
- 12.2.1 Company's Key Areas Served
- 12.2.2 Recent Developments
- 12.3. Company Market Share Analysis 2025
- 12.3.1 Top 5 Companies Market Share Analysis
- 12.3.2 Top 3 Companies Market Share Analysis
- 12.4. List of Potential Customers
- 13. Research Methodology
List of Figures
- Figure 1: Global Bioethanol Market Revenue Breakdown (billion, %) by Region 2025 & 2033
- Figure 2: Global Bioethanol Market Volume Breakdown (Billion, %) by Region 2025 & 2033
- Figure 3: Asia Pacific Bioethanol Market Revenue (billion), by Feedstock Type 2025 & 2033
- Figure 4: Asia Pacific Bioethanol Market Volume (Billion), by Feedstock Type 2025 & 2033
- Figure 5: Asia Pacific Bioethanol Market Revenue Share (%), by Feedstock Type 2025 & 2033
- Figure 6: Asia Pacific Bioethanol Market Volume Share (%), by Feedstock Type 2025 & 2033
- Figure 7: Asia Pacific Bioethanol Market Revenue (billion), by Application 2025 & 2033
- Figure 8: Asia Pacific Bioethanol Market Volume (Billion), by Application 2025 & 2033
- Figure 9: Asia Pacific Bioethanol Market Revenue Share (%), by Application 2025 & 2033
- Figure 10: Asia Pacific Bioethanol Market Volume Share (%), by Application 2025 & 2033
- Figure 11: Asia Pacific Bioethanol Market Revenue (billion), by Country 2025 & 2033
- Figure 12: Asia Pacific Bioethanol Market Volume (Billion), by Country 2025 & 2033
- Figure 13: Asia Pacific Bioethanol Market Revenue Share (%), by Country 2025 & 2033
- Figure 14: Asia Pacific Bioethanol Market Volume Share (%), by Country 2025 & 2033
- Figure 15: North America Bioethanol Market Revenue (billion), by Feedstock Type 2025 & 2033
- Figure 16: North America Bioethanol Market Volume (Billion), by Feedstock Type 2025 & 2033
- Figure 17: North America Bioethanol Market Revenue Share (%), by Feedstock Type 2025 & 2033
- Figure 18: North America Bioethanol Market Volume Share (%), by Feedstock Type 2025 & 2033
- Figure 19: North America Bioethanol Market Revenue (billion), by Application 2025 & 2033
- Figure 20: North America Bioethanol Market Volume (Billion), by Application 2025 & 2033
- Figure 21: North America Bioethanol Market Revenue Share (%), by Application 2025 & 2033
- Figure 22: North America Bioethanol Market Volume Share (%), by Application 2025 & 2033
- Figure 23: North America Bioethanol Market Revenue (billion), by Country 2025 & 2033
- Figure 24: North America Bioethanol Market Volume (Billion), by Country 2025 & 2033
- Figure 25: North America Bioethanol Market Revenue Share (%), by Country 2025 & 2033
- Figure 26: North America Bioethanol Market Volume Share (%), by Country 2025 & 2033
- Figure 27: Europe Bioethanol Market Revenue (billion), by Feedstock Type 2025 & 2033
- Figure 28: Europe Bioethanol Market Volume (Billion), by Feedstock Type 2025 & 2033
- Figure 29: Europe Bioethanol Market Revenue Share (%), by Feedstock Type 2025 & 2033
- Figure 30: Europe Bioethanol Market Volume Share (%), by Feedstock Type 2025 & 2033
- Figure 31: Europe Bioethanol Market Revenue (billion), by Application 2025 & 2033
- Figure 32: Europe Bioethanol Market Volume (Billion), by Application 2025 & 2033
- Figure 33: Europe Bioethanol Market Revenue Share (%), by Application 2025 & 2033
- Figure 34: Europe Bioethanol Market Volume Share (%), by Application 2025 & 2033
- Figure 35: Europe Bioethanol Market Revenue (billion), by Country 2025 & 2033
- Figure 36: Europe Bioethanol Market Volume (Billion), by Country 2025 & 2033
- Figure 37: Europe Bioethanol Market Revenue Share (%), by Country 2025 & 2033
- Figure 38: Europe Bioethanol Market Volume Share (%), by Country 2025 & 2033
- Figure 39: South America Bioethanol Market Revenue (billion), by Feedstock Type 2025 & 2033
- Figure 40: South America Bioethanol Market Volume (Billion), by Feedstock Type 2025 & 2033
- Figure 41: South America Bioethanol Market Revenue Share (%), by Feedstock Type 2025 & 2033
- Figure 42: South America Bioethanol Market Volume Share (%), by Feedstock Type 2025 & 2033
- Figure 43: South America Bioethanol Market Revenue (billion), by Application 2025 & 2033
- Figure 44: South America Bioethanol Market Volume (Billion), by Application 2025 & 2033
- Figure 45: South America Bioethanol Market Revenue Share (%), by Application 2025 & 2033
- Figure 46: South America Bioethanol Market Volume Share (%), by Application 2025 & 2033
- Figure 47: South America Bioethanol Market Revenue (billion), by Country 2025 & 2033
- Figure 48: South America Bioethanol Market Volume (Billion), by Country 2025 & 2033
- Figure 49: South America Bioethanol Market Revenue Share (%), by Country 2025 & 2033
- Figure 50: South America Bioethanol Market Volume Share (%), by Country 2025 & 2033
- Figure 51: Middle East and Africa Bioethanol Market Revenue (billion), by Feedstock Type 2025 & 2033
- Figure 52: Middle East and Africa Bioethanol Market Volume (Billion), by Feedstock Type 2025 & 2033
- Figure 53: Middle East and Africa Bioethanol Market Revenue Share (%), by Feedstock Type 2025 & 2033
- Figure 54: Middle East and Africa Bioethanol Market Volume Share (%), by Feedstock Type 2025 & 2033
- Figure 55: Middle East and Africa Bioethanol Market Revenue (billion), by Application 2025 & 2033
- Figure 56: Middle East and Africa Bioethanol Market Volume (Billion), by Application 2025 & 2033
- Figure 57: Middle East and Africa Bioethanol Market Revenue Share (%), by Application 2025 & 2033
- Figure 58: Middle East and Africa Bioethanol Market Volume Share (%), by Application 2025 & 2033
- Figure 59: Middle East and Africa Bioethanol Market Revenue (billion), by Country 2025 & 2033
- Figure 60: Middle East and Africa Bioethanol Market Volume (Billion), by Country 2025 & 2033
- Figure 61: Middle East and Africa Bioethanol Market Revenue Share (%), by Country 2025 & 2033
- Figure 62: Middle East and Africa Bioethanol Market Volume Share (%), by Country 2025 & 2033
List of Tables
- Table 1: Global Bioethanol Market Revenue billion Forecast, by Feedstock Type 2020 & 2033
- Table 2: Global Bioethanol Market Volume Billion Forecast, by Feedstock Type 2020 & 2033
- Table 3: Global Bioethanol Market Revenue billion Forecast, by Application 2020 & 2033
- Table 4: Global Bioethanol Market Volume Billion Forecast, by Application 2020 & 2033
- Table 5: Global Bioethanol Market Revenue billion Forecast, by Region 2020 & 2033
- Table 6: Global Bioethanol Market Volume Billion Forecast, by Region 2020 & 2033
- Table 7: Global Bioethanol Market Revenue billion Forecast, by Feedstock Type 2020 & 2033
- Table 8: Global Bioethanol Market Volume Billion Forecast, by Feedstock Type 2020 & 2033
- Table 9: Global Bioethanol Market Revenue billion Forecast, by Application 2020 & 2033
- Table 10: Global Bioethanol Market Volume Billion Forecast, by Application 2020 & 2033
- Table 11: Global Bioethanol Market Revenue billion Forecast, by Country 2020 & 2033
- Table 12: Global Bioethanol Market Volume Billion Forecast, by Country 2020 & 2033
- Table 13: China Bioethanol Market Revenue (billion) Forecast, by Application 2020 & 2033
- Table 14: China Bioethanol Market Volume (Billion) Forecast, by Application 2020 & 2033
- Table 15: India Bioethanol Market Revenue (billion) Forecast, by Application 2020 & 2033
- Table 16: India Bioethanol Market Volume (Billion) Forecast, by Application 2020 & 2033
- Table 17: Japan Bioethanol Market Revenue (billion) Forecast, by Application 2020 & 2033
- Table 18: Japan Bioethanol Market Volume (Billion) Forecast, by Application 2020 & 2033
- Table 19: South Korea Bioethanol Market Revenue (billion) Forecast, by Application 2020 & 2033
- Table 20: South Korea Bioethanol Market Volume (Billion) Forecast, by Application 2020 & 2033
- Table 21: Rest of Asia Pacific Bioethanol Market Revenue (billion) Forecast, by Application 2020 & 2033
- Table 22: Rest of Asia Pacific Bioethanol Market Volume (Billion) Forecast, by Application 2020 & 2033
- Table 23: Global Bioethanol Market Revenue billion Forecast, by Feedstock Type 2020 & 2033
- Table 24: Global Bioethanol Market Volume Billion Forecast, by Feedstock Type 2020 & 2033
- Table 25: Global Bioethanol Market Revenue billion Forecast, by Application 2020 & 2033
- Table 26: Global Bioethanol Market Volume Billion Forecast, by Application 2020 & 2033
- Table 27: Global Bioethanol Market Revenue billion Forecast, by Country 2020 & 2033
- Table 28: Global Bioethanol Market Volume Billion Forecast, by Country 2020 & 2033
- Table 29: United States Bioethanol Market Revenue (billion) Forecast, by Application 2020 & 2033
- Table 30: United States Bioethanol Market Volume (Billion) Forecast, by Application 2020 & 2033
- Table 31: Canada Bioethanol Market Revenue (billion) Forecast, by Application 2020 & 2033
- Table 32: Canada Bioethanol Market Volume (Billion) Forecast, by Application 2020 & 2033
- Table 33: Mexico Bioethanol Market Revenue (billion) Forecast, by Application 2020 & 2033
- Table 34: Mexico Bioethanol Market Volume (Billion) Forecast, by Application 2020 & 2033
- Table 35: Global Bioethanol Market Revenue billion Forecast, by Feedstock Type 2020 & 2033
- Table 36: Global Bioethanol Market Volume Billion Forecast, by Feedstock Type 2020 & 2033
- Table 37: Global Bioethanol Market Revenue billion Forecast, by Application 2020 & 2033
- Table 38: Global Bioethanol Market Volume Billion Forecast, by Application 2020 & 2033
- Table 39: Global Bioethanol Market Revenue billion Forecast, by Country 2020 & 2033
- Table 40: Global Bioethanol Market Volume Billion Forecast, by Country 2020 & 2033
- Table 41: Germany Bioethanol Market Revenue (billion) Forecast, by Application 2020 & 2033
- Table 42: Germany Bioethanol Market Volume (Billion) Forecast, by Application 2020 & 2033
- Table 43: United Kingdom Bioethanol Market Revenue (billion) Forecast, by Application 2020 & 2033
- Table 44: United Kingdom Bioethanol Market Volume (Billion) Forecast, by Application 2020 & 2033
- Table 45: France Bioethanol Market Revenue (billion) Forecast, by Application 2020 & 2033
- Table 46: France Bioethanol Market Volume (Billion) Forecast, by Application 2020 & 2033
- Table 47: Italy Bioethanol Market Revenue (billion) Forecast, by Application 2020 & 2033
- Table 48: Italy Bioethanol Market Volume (Billion) Forecast, by Application 2020 & 2033
- Table 49: Rest of Europe Bioethanol Market Revenue (billion) Forecast, by Application 2020 & 2033
- Table 50: Rest of Europe Bioethanol Market Volume (Billion) Forecast, by Application 2020 & 2033
- Table 51: Global Bioethanol Market Revenue billion Forecast, by Feedstock Type 2020 & 2033
- Table 52: Global Bioethanol Market Volume Billion Forecast, by Feedstock Type 2020 & 2033
- Table 53: Global Bioethanol Market Revenue billion Forecast, by Application 2020 & 2033
- Table 54: Global Bioethanol Market Volume Billion Forecast, by Application 2020 & 2033
- Table 55: Global Bioethanol Market Revenue billion Forecast, by Country 2020 & 2033
- Table 56: Global Bioethanol Market Volume Billion Forecast, by Country 2020 & 2033
- Table 57: Brazil Bioethanol Market Revenue (billion) Forecast, by Application 2020 & 2033
- Table 58: Brazil Bioethanol Market Volume (Billion) Forecast, by Application 2020 & 2033
- Table 59: Argentina Bioethanol Market Revenue (billion) Forecast, by Application 2020 & 2033
- Table 60: Argentina Bioethanol Market Volume (Billion) Forecast, by Application 2020 & 2033
- Table 61: Rest of South America Bioethanol Market Revenue (billion) Forecast, by Application 2020 & 2033
- Table 62: Rest of South America Bioethanol Market Volume (Billion) Forecast, by Application 2020 & 2033
- Table 63: Global Bioethanol Market Revenue billion Forecast, by Feedstock Type 2020 & 2033
- Table 64: Global Bioethanol Market Volume Billion Forecast, by Feedstock Type 2020 & 2033
- Table 65: Global Bioethanol Market Revenue billion Forecast, by Application 2020 & 2033
- Table 66: Global Bioethanol Market Volume Billion Forecast, by Application 2020 & 2033
- Table 67: Global Bioethanol Market Revenue billion Forecast, by Country 2020 & 2033
- Table 68: Global Bioethanol Market Volume Billion Forecast, by Country 2020 & 2033
- Table 69: Saudi Arabia Bioethanol Market Revenue (billion) Forecast, by Application 2020 & 2033
- Table 70: Saudi Arabia Bioethanol Market Volume (Billion) Forecast, by Application 2020 & 2033
- Table 71: South Africa Bioethanol Market Revenue (billion) Forecast, by Application 2020 & 2033
- Table 72: South Africa Bioethanol Market Volume (Billion) Forecast, by Application 2020 & 2033
- Table 73: Rest of Middle East and Africa Bioethanol Market Revenue (billion) Forecast, by Application 2020 & 2033
- Table 74: Rest of Middle East and Africa Bioethanol Market Volume (Billion) Forecast, by Application 2020 & 2033
Frequently Asked Questions
1. What is the projected Compound Annual Growth Rate (CAGR) of the Bioethanol Market?
The projected CAGR is approximately 11.7%.
2. Which companies are prominent players in the Bioethanol Market?
Key companies in the market include ADM, Cenovus Inc, Cropenergies AG, Henan Tianguan Group Co Ltd, Alto Ingredients Inc, Green Plains Inc, Suncor Energy Inc, Valero, Ethanol Technologies, Verbio Vereinigte Bioenergie AG*List Not Exhaustive, Abengoa, Granbio Investimentos SA, Sekab, Blue Bio Fuels Inc, Lantmannen, Tereos, Cristalco, Poet LLC, Jilin Fuel Ethanol Co Ltd, Raizen, KWST.
3. What are the main segments of the Bioethanol Market?
The market segments include Feedstock Type, Application.
4. Can you provide details about the market size?
The market size is estimated to be USD 66.99 billion as of 2022.
5. What are some drivers contributing to market growth?
Increasing Favorable Initiatives and Blending Mandates by Regulatory Bodies; Rising Environmental Concerns by the Use of Fossil Fuels and Need for the Bio-fuels.
6. What are the notable trends driving market growth?
Increasing Usage in the Automotive and Transportation Sector.
7. Are there any restraints impacting market growth?
Phasing out of Fuel-based Vehicles Due to Rising Demand for Electric Vehicles; Shifting Focus to Bio-butanol.
8. Can you provide examples of recent developments in the market?
January 2023: United Airlines, Tallgrass, and Green Plains Inc. announced a joint venture with Blue Blade Energy to develop and commercialize a novel Sustainable Aviation Fuel (SAF) technology that uses ethanol feedstock.
9. What pricing options are available for accessing the report?
Pricing options include single-user, multi-user, and enterprise licenses priced at USD 4750, USD 5250, and USD 8750 respectively.
10. Is the market size provided in terms of value or volume?
The market size is provided in terms of value, measured in billion and volume, measured in Billion.
11. Are there any specific market keywords associated with the report?
Yes, the market keyword associated with the report is "Bioethanol Market," which aids in identifying and referencing the specific market segment covered.
12. How do I determine which pricing option suits my needs best?
The pricing options vary based on user requirements and access needs. Individual users may opt for single-user licenses, while businesses requiring broader access may choose multi-user or enterprise licenses for cost-effective access to the report.
13. Are there any additional resources or data provided in the Bioethanol Market report?
While the report offers comprehensive insights, it's advisable to review the specific contents or supplementary materials provided to ascertain if additional resources or data are available.
14. How can I stay updated on further developments or reports in the Bioethanol Market?
To stay informed about further developments, trends, and reports in the Bioethanol Market, consider subscribing to industry newsletters, following relevant companies and organizations, or regularly checking reputable industry news sources and publications.
Methodology
Step 1 - Identification of Relevant Samples Size from Population Database


Step 2 - Approaches for Defining Global Market Size (Value, Volume* & Price*)

Note*: In applicable scenarios
Step 3 - Data Sources
Primary Research
- Web Analytics
- Survey Reports
- Research Institute
- Latest Research Reports
- Opinion Leaders
Secondary Research
- Annual Reports
- White Paper
- Latest Press Release
- Industry Association
- Paid Database
- Investor Presentations

Step 4 - Data Triangulation
Involves using different sources of information in order to increase the validity of a study
These sources are likely to be stakeholders in a program - participants, other researchers, program staff, other community members, and so on.
Then we put all data in single framework & apply various statistical tools to find out the dynamic on the market.
During the analysis stage, feedback from the stakeholder groups would be compared to determine areas of agreement as well as areas of divergence