

Key Insights
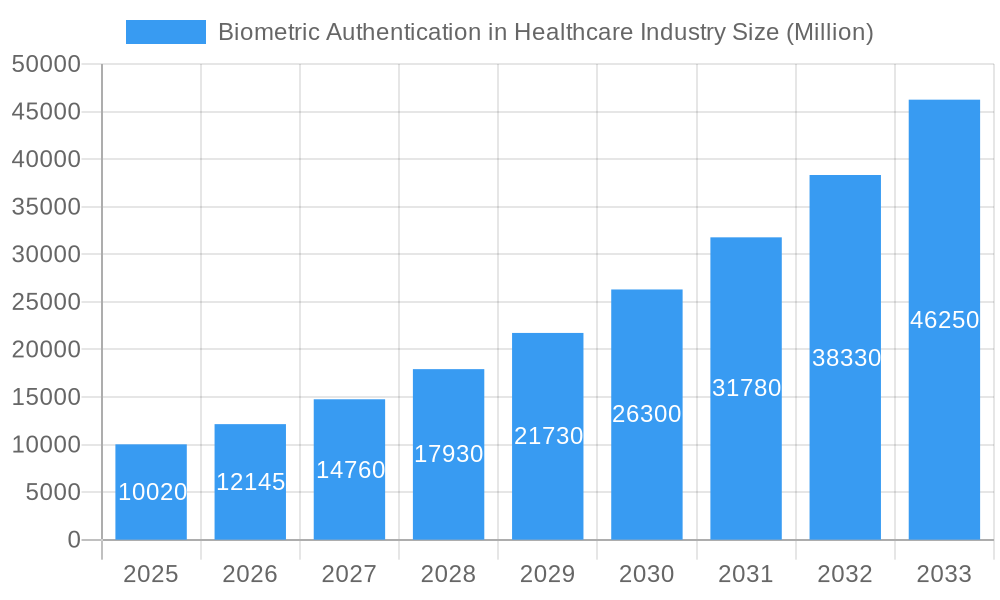
The global Biometric Authentication in Healthcare market is experiencing robust growth, projected to reach \$10.02 billion in 2025 and maintain a Compound Annual Growth Rate (CAGR) of 21.29% from 2025 to 2033. This expansion is driven by several key factors. Firstly, the increasing need for enhanced patient safety and security is fueling demand for reliable authentication systems. Data breaches and identity theft within healthcare are significant concerns, prompting the adoption of advanced biometric technologies like fingerprint, facial recognition, and iris scanning to secure sensitive patient information and medical records. Secondly, the rising adoption of telehealth and remote patient monitoring (RPM) is creating a surge in demand for secure authentication solutions that verify patient identity and ensure data integrity during remote interactions. This is further amplified by government regulations mandating stronger data protection measures in healthcare. Finally, advancements in biometric technology, such as improved accuracy, speed, and ease of use, are driving wider adoption across various healthcare settings. The market is segmented by technology (single-factor, multi-factor, others), application (medical record security, patient identification, care provider authentication, RPM, others), and end-user (hospitals, clinics, research labs, others). Multi-factor authentication is expected to dominate due to its enhanced security features. Hospitals and clinics represent the largest end-user segment due to the high volume of sensitive patient data they handle. North America is currently the leading region, owing to early adoption and stringent data privacy regulations, followed by Europe and Asia Pacific. Growth in developing economies like India and China will be significant in the coming years driven by increasing healthcare infrastructure and digitalization efforts.
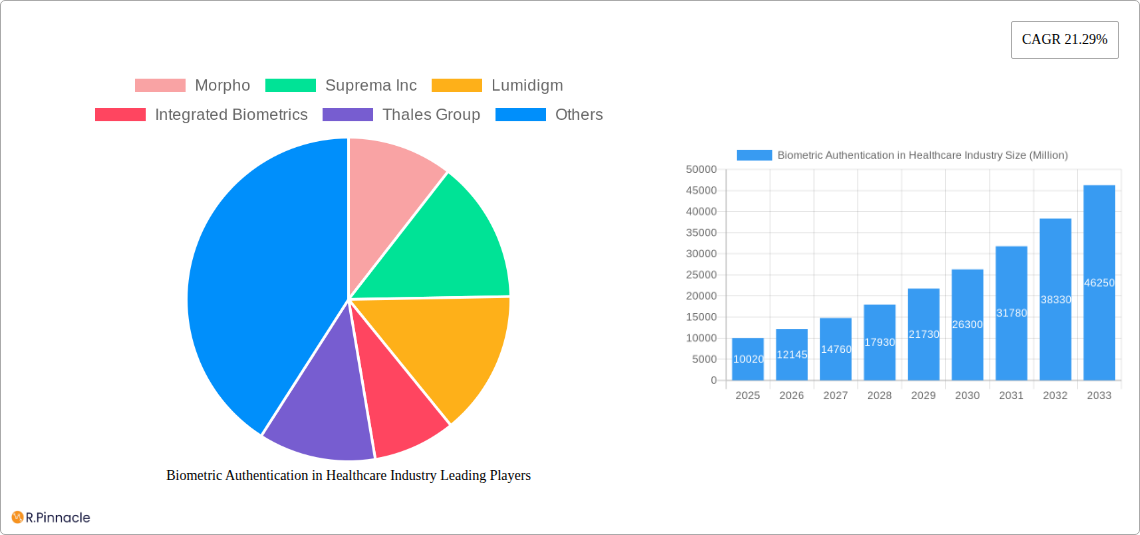
Biometric Authentication in Healthcare Industry Market Size (In Billion)
The market's continued growth trajectory is anticipated to be influenced by factors like increasing investments in healthcare IT infrastructure, the expansion of connected medical devices, and the growing adoption of cloud-based healthcare solutions. While the initial investment costs associated with implementing biometric authentication systems might pose a restraint, the long-term benefits in terms of improved security, reduced fraud, and enhanced patient experience will outweigh the initial investment. The competitive landscape is characterized by a mix of established players and emerging technology companies, with ongoing innovation focused on enhancing the accuracy, speed, and interoperability of biometric systems. The market is expected to witness strategic partnerships and collaborations between technology providers and healthcare institutions to accelerate adoption.
Biometric Authentication in Healthcare Industry Company Market Share
Biometric Authentication in Healthcare Industry: A Comprehensive Market Report (2019-2033)
This in-depth report provides a comprehensive analysis of the Biometric Authentication in Healthcare Industry market, projecting a market valuation of $XX Million by 2033. It offers invaluable insights for industry professionals, investors, and strategic decision-makers seeking to navigate this rapidly evolving landscape. The report covers the period from 2019 to 2033, with 2025 serving as the base and estimated year. The forecast period spans from 2025 to 2033, and the historical period encompasses 2019 to 2024.
Biometric Authentication in Healthcare Industry Market Structure & Innovation Trends
This section analyzes the market's competitive landscape, innovation drivers, regulatory influences, and market dynamics. The market is characterized by a moderately concentrated structure, with key players such as Morpho, Suprema Inc, Lumidigm, Integrated Biometrics, Thales Group, Fujitsu Limited, Facetec Inc, Crossmatch Technologies Inc, Bio-Key International Inc, Imprivata Inc, NEC Corporation, and Zkteco Inc holding significant market share. The exact market share percentages for each company are unavailable and will be provided in the full report but we estimate a combined market share of approximately 60% for the top 5 players.
Several factors drive innovation, including increasing concerns about data security, the rising adoption of electronic health records (EHRs), and the growing demand for improved patient care. Regulatory frameworks, such as HIPAA in the US and GDPR in Europe, significantly impact market development by setting stringent data protection standards. Product substitutes, such as traditional password-based authentication systems, pose a competitive threat, but the advantages of biometric systems in terms of security and convenience are driving market growth. Mergers and acquisitions (M&A) play a key role in shaping the market landscape. In the historical period (2019-2024), we estimate the total value of M&A deals in this sector to be approximately $XX Million.
- Market Concentration: Moderately concentrated, with a few major players holding significant market share.
- Innovation Drivers: Data security concerns, EHR adoption, demand for enhanced patient care.
- Regulatory Frameworks: HIPAA, GDPR, and other regional regulations influence market growth.
- M&A Activity: Estimated $XX Million in deal value during 2019-2024. Detailed analysis available in the full report.
Biometric Authentication in Healthcare Industry Market Dynamics & Trends
The Biometric Authentication in Healthcare Industry market exhibits robust growth, driven by the increasing need for secure patient identification and data protection, coupled with technological advancements that enhance accuracy and convenience. The market is witnessing a significant shift towards multi-factor authentication, driven by growing security concerns. The compound annual growth rate (CAGR) during the forecast period (2025-2033) is estimated at XX%. Market penetration is projected to reach XX% by 2033, indicating strong growth potential. Consumer preferences are shifting towards seamless, user-friendly biometric authentication solutions. Competitive dynamics are shaped by product innovation, pricing strategies, and strategic partnerships. The market is witnessing technological disruptions, particularly in the areas of artificial intelligence (AI) and machine learning (ML), which enhance the accuracy and speed of biometric authentication.
Dominant Regions & Segments in Biometric Authentication in Healthcare Industry
The North American region currently holds the largest market share, driven by high healthcare spending, stringent regulatory frameworks, and early adoption of advanced technologies. However, significant growth opportunities exist in other regions, particularly in Asia Pacific, due to increasing healthcare infrastructure development and rising adoption of digital healthcare solutions.
By Technology:
- Multi-factor Authentication: This segment is projected to experience the highest CAGR, driven by stringent security requirements.
- Single-factor Authentication: This segment holds a significant market share but its growth rate will be lower than multi-factor authentication.
- Other Technologies: This segment includes emerging technologies like behavioral biometrics, and is expected to witness moderate growth.
By Application:
- Medical Record and Data Center Security: This segment is a major driver of market growth, due to stringent data protection regulations.
- Patient Identification and Tracking: This segment is expected to see robust growth due to increasing patient volumes and the need for efficient healthcare delivery.
- Care Provider Authentication: This segment ensures secure access to patient data and systems.
- Home/Remote Patient Monitoring: This segment is experiencing rapid growth due to the increasing adoption of telehealth and remote patient monitoring solutions.
By End User:
- Hospital/Clinics: This segment constitutes the largest market share, driven by the high concentration of patient data and the need for enhanced security.
- Research and Clinical Laboratory: This segment is witnessing growth due to the rising use of biometrics in research and clinical trials.
Key drivers for regional dominance include robust healthcare infrastructure, favorable government policies promoting digital health initiatives, and high healthcare spending.
Biometric Authentication in Healthcare Industry Product Innovations
The market is witnessing continuous innovation in biometric authentication technologies, with a focus on improving accuracy, speed, and user experience. New products incorporate AI and ML algorithms to enhance security and reduce false acceptance/rejection rates. The integration of biometric authentication into existing healthcare IT infrastructure is streamlining workflows and improving efficiency. Companies are also developing specialized solutions for specific healthcare applications, such as remote patient monitoring and secure access to medical records. These innovations are tailored to meet the unique requirements of the healthcare industry, improving market fit and driving adoption.
Report Scope & Segmentation Analysis
This report segments the Biometric Authentication in Healthcare Industry market by technology (single-factor, multi-factor, other), application (medical record security, patient identification, care provider authentication, home/remote monitoring, other), and end-user (hospitals/clinics, research labs, other). Each segment's growth projections, market size, and competitive dynamics are thoroughly analyzed. The report provides granular details on market size and growth for each segment across different regions. Specific market sizes and growth projections will be detailed in the full report.
Key Drivers of Biometric Authentication in Healthcare Industry Growth
Several factors drive the growth of the biometric authentication market in healthcare: the increasing prevalence of data breaches and the consequent need for robust security measures; the rising adoption of EHRs and other digital health technologies; government regulations mandating data protection; the growing demand for seamless and convenient patient authentication; and advancements in biometric technology resulting in increased accuracy and reliability.
Challenges in the Biometric Authentication in Healthcare Industry Sector
Despite its growth potential, the market faces challenges, including the high initial investment costs associated with implementing biometric authentication systems; the need for robust data privacy and security measures to comply with regulations like HIPAA and GDPR; concerns regarding potential biases in biometric systems and the need for ethical considerations; and competitive pressures from traditional authentication methods. These factors can potentially restrain market growth and require careful consideration by stakeholders.
Emerging Opportunities in Biometric Authentication in Healthcare Industry
Emerging opportunities exist in the integration of biometric authentication with Internet of Medical Things (IoMT) devices, the expansion into underserved markets, the development of more user-friendly and accessible systems, and the application of advanced biometrics technologies like behavioral biometrics. The growing use of AI and ML to improve accuracy and security, coupled with the rise of telehealth and remote patient monitoring, present significant growth avenues for market players.
Leading Players in the Biometric Authentication in Healthcare Industry Market
- Morpho
- Suprema Inc
- Lumidigm
- Integrated Biometrics
- Thales Group
- Fujitsu Limited
- Facetec Inc
- Crossmatch Technologies Inc
- Bio-Key International Inc
- Imprivata Inc
- NEC Corporation
- Zkteco Inc
Key Developments in Biometric Authentication in Healthcare Industry Industry
- March 2022: BioIntelliSense launched its medical-grade BioButton Rechargeable wearable device, enabling continuous multi-parameter monitoring of vital signs.
- January 2022: Mitsubishi Electric Corporation unveiled HealthCam, a facial recognition health monitoring system tracking heartbeat rate, blood oxygen level, and temperature.
Future Outlook for Biometric Authentication in Healthcare Industry Market
The future of the Biometric Authentication in Healthcare Industry market looks promising, driven by continuous technological advancements, increasing demand for secure healthcare solutions, and favorable regulatory frameworks. The market is poised for significant growth, with strategic opportunities for companies focusing on innovation, partnerships, and expansion into new markets. The integration of advanced technologies like AI and ML, coupled with the growing adoption of telehealth and remote patient monitoring, will play a pivotal role in shaping the market's future trajectory.
Biometric Authentication in Healthcare Industry Segmentation
-
1. Technology
- 1.1. Single-factor Authentication
- 1.2. Multi-factor Authentication
- 1.3. Other Technologies
-
2. Application
- 2.1. Medical Record and Data Center Security
- 2.2. Patient Identification and Tracking
- 2.3. Care Provider Authentication
- 2.4. Home/Remote Patient Monitoring
- 2.5. Other Applications
-
3. End User
- 3.1. Hospital/Clinics
- 3.2. Research and Clinical Laboratory
- 3.3. Other End Users
Biometric Authentication in Healthcare Industry Segmentation By Geography
-
1. North America
- 1.1. United States
- 1.2. Canada
- 1.3. Mexico
-
2. Europe
- 2.1. Germany
- 2.2. United Kingdom
- 2.3. France
- 2.4. Italy
- 2.5. Spain
- 2.6. Rest of Europe
-
3. Asia Pacific
- 3.1. China
- 3.2. Japan
- 3.3. India
- 3.4. Australia
- 3.5. South Korea
- 3.6. Rest of Asia Pacific
-
4. Middle East and Africa
- 4.1. GCC
- 4.2. South Africa
- 4.3. Rest of Middle East and Africa
-
5. South America
- 5.1. Brazil
- 5.2. Argentina
- 5.3. Rest of South America
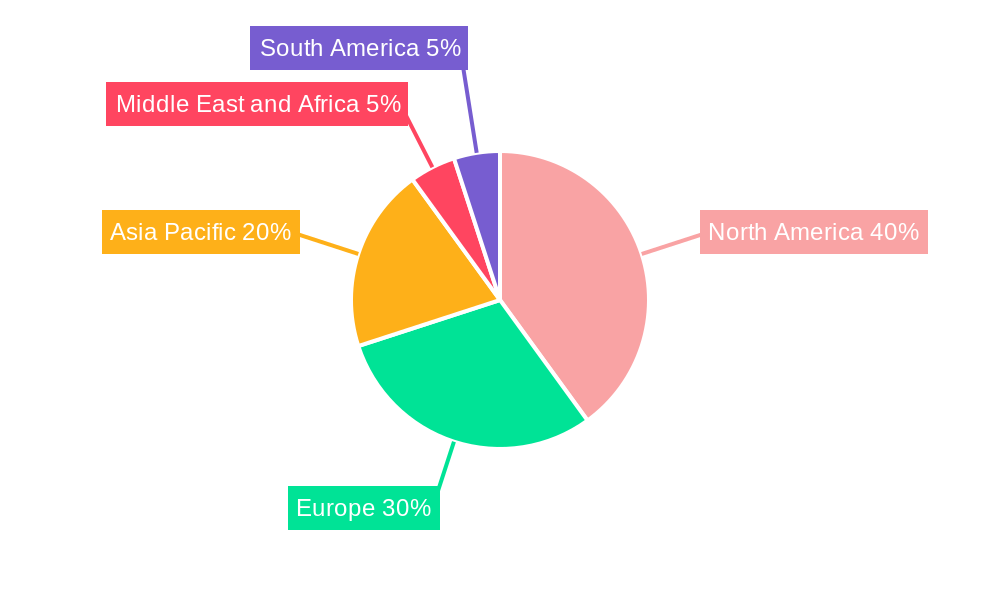
Biometric Authentication in Healthcare Industry Regional Market Share
Geographic Coverage of Biometric Authentication in Healthcare Industry
Biometric Authentication in Healthcare Industry REPORT HIGHLIGHTS
| Aspects | Details |
|---|---|
| Study Period | 2020-2034 |
| Base Year | 2025 |
| Estimated Year | 2026 |
| Forecast Period | 2026-2034 |
| Historical Period | 2020-2025 |
| Growth Rate | CAGR of 21.29% from 2020-2034 |
| Segmentation |
|
Table of Contents
- 1. Introduction
- 1.1. Research Scope
- 1.2. Market Segmentation
- 1.3. Research Objective
- 1.4. Definitions and Assumptions
- 2. Executive Summary
- 2.1. Market Snapshot
- 3. Market Dynamics
- 3.1. Market Drivers
- 3.2. Market Restrains
- 3.3. Market Trends
- 3.4. Market Opportunities
- 4. Market Factor Analysis
- 4.1. Porters Five Forces
- 4.1.1. Bargaining Power of Suppliers
- 4.1.2. Bargaining Power of Buyers
- 4.1.3. Threat of New Entrants
- 4.1.4. Threat of Substitutes
- 4.1.5. Competitive Rivalry
- 4.2. PESTEL analysis
- 4.3. BCG Analysis
- 4.3.1. Stars (High Growth, High Market Share)
- 4.3.2. Cash Cows (Low Growth, High Market Share)
- 4.3.3. Question Mark (High Growth, Low Market Share)
- 4.3.4. Dogs (Low Growth, Low Market Share)
- 4.4. Ansoff Matrix Analysis
- 4.5. Supply Chain Analysis
- 4.6. Regulatory Landscape
- 4.7. Current Market Potential and Opportunity Assessment (TAM–SAM–SOM Framework)
- 4.8. PRI Analyst Note
- 4.1. Porters Five Forces
- 5. Market Analysis, Insights and Forecast 2021-2033
- 5.1. Market Analysis, Insights and Forecast - by Technology
- 5.1.1. Single-factor Authentication
- 5.1.2. Multi-factor Authentication
- 5.1.3. Other Technologies
- 5.2. Market Analysis, Insights and Forecast - by Application
- 5.2.1. Medical Record and Data Center Security
- 5.2.2. Patient Identification and Tracking
- 5.2.3. Care Provider Authentication
- 5.2.4. Home/Remote Patient Monitoring
- 5.2.5. Other Applications
- 5.3. Market Analysis, Insights and Forecast - by End User
- 5.3.1. Hospital/Clinics
- 5.3.2. Research and Clinical Laboratory
- 5.3.3. Other End Users
- 5.4. Market Analysis, Insights and Forecast - by Region
- 5.4.1. North America
- 5.4.2. Europe
- 5.4.3. Asia Pacific
- 5.4.4. Middle East and Africa
- 5.4.5. South America
- 5.1. Market Analysis, Insights and Forecast - by Technology
- 6. Global Biometric Authentication in Healthcare Industry Analysis, Insights and Forecast, 2021-2033
- 6.1. Market Analysis, Insights and Forecast - by Technology
- 6.1.1. Single-factor Authentication
- 6.1.2. Multi-factor Authentication
- 6.1.3. Other Technologies
- 6.2. Market Analysis, Insights and Forecast - by Application
- 6.2.1. Medical Record and Data Center Security
- 6.2.2. Patient Identification and Tracking
- 6.2.3. Care Provider Authentication
- 6.2.4. Home/Remote Patient Monitoring
- 6.2.5. Other Applications
- 6.3. Market Analysis, Insights and Forecast - by End User
- 6.3.1. Hospital/Clinics
- 6.3.2. Research and Clinical Laboratory
- 6.3.3. Other End Users
- 6.1. Market Analysis, Insights and Forecast - by Technology
- 7. North America Biometric Authentication in Healthcare Industry Analysis, Insights and Forecast, 2020-2032
- 7.1. Market Analysis, Insights and Forecast - by Technology
- 7.1.1. Single-factor Authentication
- 7.1.2. Multi-factor Authentication
- 7.1.3. Other Technologies
- 7.2. Market Analysis, Insights and Forecast - by Application
- 7.2.1. Medical Record and Data Center Security
- 7.2.2. Patient Identification and Tracking
- 7.2.3. Care Provider Authentication
- 7.2.4. Home/Remote Patient Monitoring
- 7.2.5. Other Applications
- 7.3. Market Analysis, Insights and Forecast - by End User
- 7.3.1. Hospital/Clinics
- 7.3.2. Research and Clinical Laboratory
- 7.3.3. Other End Users
- 7.1. Market Analysis, Insights and Forecast - by Technology
- 8. Europe Biometric Authentication in Healthcare Industry Analysis, Insights and Forecast, 2020-2032
- 8.1. Market Analysis, Insights and Forecast - by Technology
- 8.1.1. Single-factor Authentication
- 8.1.2. Multi-factor Authentication
- 8.1.3. Other Technologies
- 8.2. Market Analysis, Insights and Forecast - by Application
- 8.2.1. Medical Record and Data Center Security
- 8.2.2. Patient Identification and Tracking
- 8.2.3. Care Provider Authentication
- 8.2.4. Home/Remote Patient Monitoring
- 8.2.5. Other Applications
- 8.3. Market Analysis, Insights and Forecast - by End User
- 8.3.1. Hospital/Clinics
- 8.3.2. Research and Clinical Laboratory
- 8.3.3. Other End Users
- 8.1. Market Analysis, Insights and Forecast - by Technology
- 9. Asia Pacific Biometric Authentication in Healthcare Industry Analysis, Insights and Forecast, 2020-2032
- 9.1. Market Analysis, Insights and Forecast - by Technology
- 9.1.1. Single-factor Authentication
- 9.1.2. Multi-factor Authentication
- 9.1.3. Other Technologies
- 9.2. Market Analysis, Insights and Forecast - by Application
- 9.2.1. Medical Record and Data Center Security
- 9.2.2. Patient Identification and Tracking
- 9.2.3. Care Provider Authentication
- 9.2.4. Home/Remote Patient Monitoring
- 9.2.5. Other Applications
- 9.3. Market Analysis, Insights and Forecast - by End User
- 9.3.1. Hospital/Clinics
- 9.3.2. Research and Clinical Laboratory
- 9.3.3. Other End Users
- 9.1. Market Analysis, Insights and Forecast - by Technology
- 10. Middle East and Africa Biometric Authentication in Healthcare Industry Analysis, Insights and Forecast, 2020-2032
- 10.1. Market Analysis, Insights and Forecast - by Technology
- 10.1.1. Single-factor Authentication
- 10.1.2. Multi-factor Authentication
- 10.1.3. Other Technologies
- 10.2. Market Analysis, Insights and Forecast - by Application
- 10.2.1. Medical Record and Data Center Security
- 10.2.2. Patient Identification and Tracking
- 10.2.3. Care Provider Authentication
- 10.2.4. Home/Remote Patient Monitoring
- 10.2.5. Other Applications
- 10.3. Market Analysis, Insights and Forecast - by End User
- 10.3.1. Hospital/Clinics
- 10.3.2. Research and Clinical Laboratory
- 10.3.3. Other End Users
- 10.1. Market Analysis, Insights and Forecast - by Technology
- 11. South America Biometric Authentication in Healthcare Industry Analysis, Insights and Forecast, 2020-2032
- 11.1. Market Analysis, Insights and Forecast - by Technology
- 11.1.1. Single-factor Authentication
- 11.1.2. Multi-factor Authentication
- 11.1.3. Other Technologies
- 11.2. Market Analysis, Insights and Forecast - by Application
- 11.2.1. Medical Record and Data Center Security
- 11.2.2. Patient Identification and Tracking
- 11.2.3. Care Provider Authentication
- 11.2.4. Home/Remote Patient Monitoring
- 11.2.5. Other Applications
- 11.3. Market Analysis, Insights and Forecast - by End User
- 11.3.1. Hospital/Clinics
- 11.3.2. Research and Clinical Laboratory
- 11.3.3. Other End Users
- 11.1. Market Analysis, Insights and Forecast - by Technology
- 12. Competitive Analysis
- 12.1. Company Profiles
- 12.1.1 Morpho
- 12.1.1.1. Company Overview
- 12.1.1.2. Products
- 12.1.1.3. Company Financials
- 12.1.1.4. SWOT Analysis
- 12.1.2 Suprema Inc
- 12.1.2.1. Company Overview
- 12.1.2.2. Products
- 12.1.2.3. Company Financials
- 12.1.2.4. SWOT Analysis
- 12.1.3 Lumidigm
- 12.1.3.1. Company Overview
- 12.1.3.2. Products
- 12.1.3.3. Company Financials
- 12.1.3.4. SWOT Analysis
- 12.1.4 Integrated Biometrics
- 12.1.4.1. Company Overview
- 12.1.4.2. Products
- 12.1.4.3. Company Financials
- 12.1.4.4. SWOT Analysis
- 12.1.5 Thales Group
- 12.1.5.1. Company Overview
- 12.1.5.2. Products
- 12.1.5.3. Company Financials
- 12.1.5.4. SWOT Analysis
- 12.1.6 Fujitsu Limited
- 12.1.6.1. Company Overview
- 12.1.6.2. Products
- 12.1.6.3. Company Financials
- 12.1.6.4. SWOT Analysis
- 12.1.7 Facetec Inc
- 12.1.7.1. Company Overview
- 12.1.7.2. Products
- 12.1.7.3. Company Financials
- 12.1.7.4. SWOT Analysis
- 12.1.8 Crossmatch Technologies Inc
- 12.1.8.1. Company Overview
- 12.1.8.2. Products
- 12.1.8.3. Company Financials
- 12.1.8.4. SWOT Analysis
- 12.1.9 Bio-Key International Inc
- 12.1.9.1. Company Overview
- 12.1.9.2. Products
- 12.1.9.3. Company Financials
- 12.1.9.4. SWOT Analysis
- 12.1.10 Imprivata Inc
- 12.1.10.1. Company Overview
- 12.1.10.2. Products
- 12.1.10.3. Company Financials
- 12.1.10.4. SWOT Analysis
- 12.1.11 NEC Corporation
- 12.1.11.1. Company Overview
- 12.1.11.2. Products
- 12.1.11.3. Company Financials
- 12.1.11.4. SWOT Analysis
- 12.1.12 Zkteco Inc
- 12.1.12.1. Company Overview
- 12.1.12.2. Products
- 12.1.12.3. Company Financials
- 12.1.12.4. SWOT Analysis
- 12.1.1 Morpho
- 12.2. Market Entropy
- 12.2.1 Company's Key Areas Served
- 12.2.2 Recent Developments
- 12.3. Company Market Share Analysis 2025
- 12.3.1 Top 5 Companies Market Share Analysis
- 12.3.2 Top 3 Companies Market Share Analysis
- 12.4. List of Potential Customers
- 13. Research Methodology
List of Figures
- Figure 1: Global Biometric Authentication in Healthcare Industry Revenue Breakdown (Million, %) by Region 2025 & 2033
- Figure 2: Global Biometric Authentication in Healthcare Industry Volume Breakdown (K Unit, %) by Region 2025 & 2033
- Figure 3: North America Biometric Authentication in Healthcare Industry Revenue (Million), by Technology 2025 & 2033
- Figure 4: North America Biometric Authentication in Healthcare Industry Volume (K Unit), by Technology 2025 & 2033
- Figure 5: North America Biometric Authentication in Healthcare Industry Revenue Share (%), by Technology 2025 & 2033
- Figure 6: North America Biometric Authentication in Healthcare Industry Volume Share (%), by Technology 2025 & 2033
- Figure 7: North America Biometric Authentication in Healthcare Industry Revenue (Million), by Application 2025 & 2033
- Figure 8: North America Biometric Authentication in Healthcare Industry Volume (K Unit), by Application 2025 & 2033
- Figure 9: North America Biometric Authentication in Healthcare Industry Revenue Share (%), by Application 2025 & 2033
- Figure 10: North America Biometric Authentication in Healthcare Industry Volume Share (%), by Application 2025 & 2033
- Figure 11: North America Biometric Authentication in Healthcare Industry Revenue (Million), by End User 2025 & 2033
- Figure 12: North America Biometric Authentication in Healthcare Industry Volume (K Unit), by End User 2025 & 2033
- Figure 13: North America Biometric Authentication in Healthcare Industry Revenue Share (%), by End User 2025 & 2033
- Figure 14: North America Biometric Authentication in Healthcare Industry Volume Share (%), by End User 2025 & 2033
- Figure 15: North America Biometric Authentication in Healthcare Industry Revenue (Million), by Country 2025 & 2033
- Figure 16: North America Biometric Authentication in Healthcare Industry Volume (K Unit), by Country 2025 & 2033
- Figure 17: North America Biometric Authentication in Healthcare Industry Revenue Share (%), by Country 2025 & 2033
- Figure 18: North America Biometric Authentication in Healthcare Industry Volume Share (%), by Country 2025 & 2033
- Figure 19: Europe Biometric Authentication in Healthcare Industry Revenue (Million), by Technology 2025 & 2033
- Figure 20: Europe Biometric Authentication in Healthcare Industry Volume (K Unit), by Technology 2025 & 2033
- Figure 21: Europe Biometric Authentication in Healthcare Industry Revenue Share (%), by Technology 2025 & 2033
- Figure 22: Europe Biometric Authentication in Healthcare Industry Volume Share (%), by Technology 2025 & 2033
- Figure 23: Europe Biometric Authentication in Healthcare Industry Revenue (Million), by Application 2025 & 2033
- Figure 24: Europe Biometric Authentication in Healthcare Industry Volume (K Unit), by Application 2025 & 2033
- Figure 25: Europe Biometric Authentication in Healthcare Industry Revenue Share (%), by Application 2025 & 2033
- Figure 26: Europe Biometric Authentication in Healthcare Industry Volume Share (%), by Application 2025 & 2033
- Figure 27: Europe Biometric Authentication in Healthcare Industry Revenue (Million), by End User 2025 & 2033
- Figure 28: Europe Biometric Authentication in Healthcare Industry Volume (K Unit), by End User 2025 & 2033
- Figure 29: Europe Biometric Authentication in Healthcare Industry Revenue Share (%), by End User 2025 & 2033
- Figure 30: Europe Biometric Authentication in Healthcare Industry Volume Share (%), by End User 2025 & 2033
- Figure 31: Europe Biometric Authentication in Healthcare Industry Revenue (Million), by Country 2025 & 2033
- Figure 32: Europe Biometric Authentication in Healthcare Industry Volume (K Unit), by Country 2025 & 2033
- Figure 33: Europe Biometric Authentication in Healthcare Industry Revenue Share (%), by Country 2025 & 2033
- Figure 34: Europe Biometric Authentication in Healthcare Industry Volume Share (%), by Country 2025 & 2033
- Figure 35: Asia Pacific Biometric Authentication in Healthcare Industry Revenue (Million), by Technology 2025 & 2033
- Figure 36: Asia Pacific Biometric Authentication in Healthcare Industry Volume (K Unit), by Technology 2025 & 2033
- Figure 37: Asia Pacific Biometric Authentication in Healthcare Industry Revenue Share (%), by Technology 2025 & 2033
- Figure 38: Asia Pacific Biometric Authentication in Healthcare Industry Volume Share (%), by Technology 2025 & 2033
- Figure 39: Asia Pacific Biometric Authentication in Healthcare Industry Revenue (Million), by Application 2025 & 2033
- Figure 40: Asia Pacific Biometric Authentication in Healthcare Industry Volume (K Unit), by Application 2025 & 2033
- Figure 41: Asia Pacific Biometric Authentication in Healthcare Industry Revenue Share (%), by Application 2025 & 2033
- Figure 42: Asia Pacific Biometric Authentication in Healthcare Industry Volume Share (%), by Application 2025 & 2033
- Figure 43: Asia Pacific Biometric Authentication in Healthcare Industry Revenue (Million), by End User 2025 & 2033
- Figure 44: Asia Pacific Biometric Authentication in Healthcare Industry Volume (K Unit), by End User 2025 & 2033
- Figure 45: Asia Pacific Biometric Authentication in Healthcare Industry Revenue Share (%), by End User 2025 & 2033
- Figure 46: Asia Pacific Biometric Authentication in Healthcare Industry Volume Share (%), by End User 2025 & 2033
- Figure 47: Asia Pacific Biometric Authentication in Healthcare Industry Revenue (Million), by Country 2025 & 2033
- Figure 48: Asia Pacific Biometric Authentication in Healthcare Industry Volume (K Unit), by Country 2025 & 2033
- Figure 49: Asia Pacific Biometric Authentication in Healthcare Industry Revenue Share (%), by Country 2025 & 2033
- Figure 50: Asia Pacific Biometric Authentication in Healthcare Industry Volume Share (%), by Country 2025 & 2033
- Figure 51: Middle East and Africa Biometric Authentication in Healthcare Industry Revenue (Million), by Technology 2025 & 2033
- Figure 52: Middle East and Africa Biometric Authentication in Healthcare Industry Volume (K Unit), by Technology 2025 & 2033
- Figure 53: Middle East and Africa Biometric Authentication in Healthcare Industry Revenue Share (%), by Technology 2025 & 2033
- Figure 54: Middle East and Africa Biometric Authentication in Healthcare Industry Volume Share (%), by Technology 2025 & 2033
- Figure 55: Middle East and Africa Biometric Authentication in Healthcare Industry Revenue (Million), by Application 2025 & 2033
- Figure 56: Middle East and Africa Biometric Authentication in Healthcare Industry Volume (K Unit), by Application 2025 & 2033
- Figure 57: Middle East and Africa Biometric Authentication in Healthcare Industry Revenue Share (%), by Application 2025 & 2033
- Figure 58: Middle East and Africa Biometric Authentication in Healthcare Industry Volume Share (%), by Application 2025 & 2033
- Figure 59: Middle East and Africa Biometric Authentication in Healthcare Industry Revenue (Million), by End User 2025 & 2033
- Figure 60: Middle East and Africa Biometric Authentication in Healthcare Industry Volume (K Unit), by End User 2025 & 2033
- Figure 61: Middle East and Africa Biometric Authentication in Healthcare Industry Revenue Share (%), by End User 2025 & 2033
- Figure 62: Middle East and Africa Biometric Authentication in Healthcare Industry Volume Share (%), by End User 2025 & 2033
- Figure 63: Middle East and Africa Biometric Authentication in Healthcare Industry Revenue (Million), by Country 2025 & 2033
- Figure 64: Middle East and Africa Biometric Authentication in Healthcare Industry Volume (K Unit), by Country 2025 & 2033
- Figure 65: Middle East and Africa Biometric Authentication in Healthcare Industry Revenue Share (%), by Country 2025 & 2033
- Figure 66: Middle East and Africa Biometric Authentication in Healthcare Industry Volume Share (%), by Country 2025 & 2033
- Figure 67: South America Biometric Authentication in Healthcare Industry Revenue (Million), by Technology 2025 & 2033
- Figure 68: South America Biometric Authentication in Healthcare Industry Volume (K Unit), by Technology 2025 & 2033
- Figure 69: South America Biometric Authentication in Healthcare Industry Revenue Share (%), by Technology 2025 & 2033
- Figure 70: South America Biometric Authentication in Healthcare Industry Volume Share (%), by Technology 2025 & 2033
- Figure 71: South America Biometric Authentication in Healthcare Industry Revenue (Million), by Application 2025 & 2033
- Figure 72: South America Biometric Authentication in Healthcare Industry Volume (K Unit), by Application 2025 & 2033
- Figure 73: South America Biometric Authentication in Healthcare Industry Revenue Share (%), by Application 2025 & 2033
- Figure 74: South America Biometric Authentication in Healthcare Industry Volume Share (%), by Application 2025 & 2033
- Figure 75: South America Biometric Authentication in Healthcare Industry Revenue (Million), by End User 2025 & 2033
- Figure 76: South America Biometric Authentication in Healthcare Industry Volume (K Unit), by End User 2025 & 2033
- Figure 77: South America Biometric Authentication in Healthcare Industry Revenue Share (%), by End User 2025 & 2033
- Figure 78: South America Biometric Authentication in Healthcare Industry Volume Share (%), by End User 2025 & 2033
- Figure 79: South America Biometric Authentication in Healthcare Industry Revenue (Million), by Country 2025 & 2033
- Figure 80: South America Biometric Authentication in Healthcare Industry Volume (K Unit), by Country 2025 & 2033
- Figure 81: South America Biometric Authentication in Healthcare Industry Revenue Share (%), by Country 2025 & 2033
- Figure 82: South America Biometric Authentication in Healthcare Industry Volume Share (%), by Country 2025 & 2033
List of Tables
- Table 1: Global Biometric Authentication in Healthcare Industry Revenue Million Forecast, by Technology 2020 & 2033
- Table 2: Global Biometric Authentication in Healthcare Industry Volume K Unit Forecast, by Technology 2020 & 2033
- Table 3: Global Biometric Authentication in Healthcare Industry Revenue Million Forecast, by Application 2020 & 2033
- Table 4: Global Biometric Authentication in Healthcare Industry Volume K Unit Forecast, by Application 2020 & 2033
- Table 5: Global Biometric Authentication in Healthcare Industry Revenue Million Forecast, by End User 2020 & 2033
- Table 6: Global Biometric Authentication in Healthcare Industry Volume K Unit Forecast, by End User 2020 & 2033
- Table 7: Global Biometric Authentication in Healthcare Industry Revenue Million Forecast, by Region 2020 & 2033
- Table 8: Global Biometric Authentication in Healthcare Industry Volume K Unit Forecast, by Region 2020 & 2033
- Table 9: Global Biometric Authentication in Healthcare Industry Revenue Million Forecast, by Technology 2020 & 2033
- Table 10: Global Biometric Authentication in Healthcare Industry Volume K Unit Forecast, by Technology 2020 & 2033
- Table 11: Global Biometric Authentication in Healthcare Industry Revenue Million Forecast, by Application 2020 & 2033
- Table 12: Global Biometric Authentication in Healthcare Industry Volume K Unit Forecast, by Application 2020 & 2033
- Table 13: Global Biometric Authentication in Healthcare Industry Revenue Million Forecast, by End User 2020 & 2033
- Table 14: Global Biometric Authentication in Healthcare Industry Volume K Unit Forecast, by End User 2020 & 2033
- Table 15: Global Biometric Authentication in Healthcare Industry Revenue Million Forecast, by Country 2020 & 2033
- Table 16: Global Biometric Authentication in Healthcare Industry Volume K Unit Forecast, by Country 2020 & 2033
- Table 17: United States Biometric Authentication in Healthcare Industry Revenue (Million) Forecast, by Application 2020 & 2033
- Table 18: United States Biometric Authentication in Healthcare Industry Volume (K Unit) Forecast, by Application 2020 & 2033
- Table 19: Canada Biometric Authentication in Healthcare Industry Revenue (Million) Forecast, by Application 2020 & 2033
- Table 20: Canada Biometric Authentication in Healthcare Industry Volume (K Unit) Forecast, by Application 2020 & 2033
- Table 21: Mexico Biometric Authentication in Healthcare Industry Revenue (Million) Forecast, by Application 2020 & 2033
- Table 22: Mexico Biometric Authentication in Healthcare Industry Volume (K Unit) Forecast, by Application 2020 & 2033
- Table 23: Global Biometric Authentication in Healthcare Industry Revenue Million Forecast, by Technology 2020 & 2033
- Table 24: Global Biometric Authentication in Healthcare Industry Volume K Unit Forecast, by Technology 2020 & 2033
- Table 25: Global Biometric Authentication in Healthcare Industry Revenue Million Forecast, by Application 2020 & 2033
- Table 26: Global Biometric Authentication in Healthcare Industry Volume K Unit Forecast, by Application 2020 & 2033
- Table 27: Global Biometric Authentication in Healthcare Industry Revenue Million Forecast, by End User 2020 & 2033
- Table 28: Global Biometric Authentication in Healthcare Industry Volume K Unit Forecast, by End User 2020 & 2033
- Table 29: Global Biometric Authentication in Healthcare Industry Revenue Million Forecast, by Country 2020 & 2033
- Table 30: Global Biometric Authentication in Healthcare Industry Volume K Unit Forecast, by Country 2020 & 2033
- Table 31: Germany Biometric Authentication in Healthcare Industry Revenue (Million) Forecast, by Application 2020 & 2033
- Table 32: Germany Biometric Authentication in Healthcare Industry Volume (K Unit) Forecast, by Application 2020 & 2033
- Table 33: United Kingdom Biometric Authentication in Healthcare Industry Revenue (Million) Forecast, by Application 2020 & 2033
- Table 34: United Kingdom Biometric Authentication in Healthcare Industry Volume (K Unit) Forecast, by Application 2020 & 2033
- Table 35: France Biometric Authentication in Healthcare Industry Revenue (Million) Forecast, by Application 2020 & 2033
- Table 36: France Biometric Authentication in Healthcare Industry Volume (K Unit) Forecast, by Application 2020 & 2033
- Table 37: Italy Biometric Authentication in Healthcare Industry Revenue (Million) Forecast, by Application 2020 & 2033
- Table 38: Italy Biometric Authentication in Healthcare Industry Volume (K Unit) Forecast, by Application 2020 & 2033
- Table 39: Spain Biometric Authentication in Healthcare Industry Revenue (Million) Forecast, by Application 2020 & 2033
- Table 40: Spain Biometric Authentication in Healthcare Industry Volume (K Unit) Forecast, by Application 2020 & 2033
- Table 41: Rest of Europe Biometric Authentication in Healthcare Industry Revenue (Million) Forecast, by Application 2020 & 2033
- Table 42: Rest of Europe Biometric Authentication in Healthcare Industry Volume (K Unit) Forecast, by Application 2020 & 2033
- Table 43: Global Biometric Authentication in Healthcare Industry Revenue Million Forecast, by Technology 2020 & 2033
- Table 44: Global Biometric Authentication in Healthcare Industry Volume K Unit Forecast, by Technology 2020 & 2033
- Table 45: Global Biometric Authentication in Healthcare Industry Revenue Million Forecast, by Application 2020 & 2033
- Table 46: Global Biometric Authentication in Healthcare Industry Volume K Unit Forecast, by Application 2020 & 2033
- Table 47: Global Biometric Authentication in Healthcare Industry Revenue Million Forecast, by End User 2020 & 2033
- Table 48: Global Biometric Authentication in Healthcare Industry Volume K Unit Forecast, by End User 2020 & 2033
- Table 49: Global Biometric Authentication in Healthcare Industry Revenue Million Forecast, by Country 2020 & 2033
- Table 50: Global Biometric Authentication in Healthcare Industry Volume K Unit Forecast, by Country 2020 & 2033
- Table 51: China Biometric Authentication in Healthcare Industry Revenue (Million) Forecast, by Application 2020 & 2033
- Table 52: China Biometric Authentication in Healthcare Industry Volume (K Unit) Forecast, by Application 2020 & 2033
- Table 53: Japan Biometric Authentication in Healthcare Industry Revenue (Million) Forecast, by Application 2020 & 2033
- Table 54: Japan Biometric Authentication in Healthcare Industry Volume (K Unit) Forecast, by Application 2020 & 2033
- Table 55: India Biometric Authentication in Healthcare Industry Revenue (Million) Forecast, by Application 2020 & 2033
- Table 56: India Biometric Authentication in Healthcare Industry Volume (K Unit) Forecast, by Application 2020 & 2033
- Table 57: Australia Biometric Authentication in Healthcare Industry Revenue (Million) Forecast, by Application 2020 & 2033
- Table 58: Australia Biometric Authentication in Healthcare Industry Volume (K Unit) Forecast, by Application 2020 & 2033
- Table 59: South Korea Biometric Authentication in Healthcare Industry Revenue (Million) Forecast, by Application 2020 & 2033
- Table 60: South Korea Biometric Authentication in Healthcare Industry Volume (K Unit) Forecast, by Application 2020 & 2033
- Table 61: Rest of Asia Pacific Biometric Authentication in Healthcare Industry Revenue (Million) Forecast, by Application 2020 & 2033
- Table 62: Rest of Asia Pacific Biometric Authentication in Healthcare Industry Volume (K Unit) Forecast, by Application 2020 & 2033
- Table 63: Global Biometric Authentication in Healthcare Industry Revenue Million Forecast, by Technology 2020 & 2033
- Table 64: Global Biometric Authentication in Healthcare Industry Volume K Unit Forecast, by Technology 2020 & 2033
- Table 65: Global Biometric Authentication in Healthcare Industry Revenue Million Forecast, by Application 2020 & 2033
- Table 66: Global Biometric Authentication in Healthcare Industry Volume K Unit Forecast, by Application 2020 & 2033
- Table 67: Global Biometric Authentication in Healthcare Industry Revenue Million Forecast, by End User 2020 & 2033
- Table 68: Global Biometric Authentication in Healthcare Industry Volume K Unit Forecast, by End User 2020 & 2033
- Table 69: Global Biometric Authentication in Healthcare Industry Revenue Million Forecast, by Country 2020 & 2033
- Table 70: Global Biometric Authentication in Healthcare Industry Volume K Unit Forecast, by Country 2020 & 2033
- Table 71: GCC Biometric Authentication in Healthcare Industry Revenue (Million) Forecast, by Application 2020 & 2033
- Table 72: GCC Biometric Authentication in Healthcare Industry Volume (K Unit) Forecast, by Application 2020 & 2033
- Table 73: South Africa Biometric Authentication in Healthcare Industry Revenue (Million) Forecast, by Application 2020 & 2033
- Table 74: South Africa Biometric Authentication in Healthcare Industry Volume (K Unit) Forecast, by Application 2020 & 2033
- Table 75: Rest of Middle East and Africa Biometric Authentication in Healthcare Industry Revenue (Million) Forecast, by Application 2020 & 2033
- Table 76: Rest of Middle East and Africa Biometric Authentication in Healthcare Industry Volume (K Unit) Forecast, by Application 2020 & 2033
- Table 77: Global Biometric Authentication in Healthcare Industry Revenue Million Forecast, by Technology 2020 & 2033
- Table 78: Global Biometric Authentication in Healthcare Industry Volume K Unit Forecast, by Technology 2020 & 2033
- Table 79: Global Biometric Authentication in Healthcare Industry Revenue Million Forecast, by Application 2020 & 2033
- Table 80: Global Biometric Authentication in Healthcare Industry Volume K Unit Forecast, by Application 2020 & 2033
- Table 81: Global Biometric Authentication in Healthcare Industry Revenue Million Forecast, by End User 2020 & 2033
- Table 82: Global Biometric Authentication in Healthcare Industry Volume K Unit Forecast, by End User 2020 & 2033
- Table 83: Global Biometric Authentication in Healthcare Industry Revenue Million Forecast, by Country 2020 & 2033
- Table 84: Global Biometric Authentication in Healthcare Industry Volume K Unit Forecast, by Country 2020 & 2033
- Table 85: Brazil Biometric Authentication in Healthcare Industry Revenue (Million) Forecast, by Application 2020 & 2033
- Table 86: Brazil Biometric Authentication in Healthcare Industry Volume (K Unit) Forecast, by Application 2020 & 2033
- Table 87: Argentina Biometric Authentication in Healthcare Industry Revenue (Million) Forecast, by Application 2020 & 2033
- Table 88: Argentina Biometric Authentication in Healthcare Industry Volume (K Unit) Forecast, by Application 2020 & 2033
- Table 89: Rest of South America Biometric Authentication in Healthcare Industry Revenue (Million) Forecast, by Application 2020 & 2033
- Table 90: Rest of South America Biometric Authentication in Healthcare Industry Volume (K Unit) Forecast, by Application 2020 & 2033
Frequently Asked Questions
1. What is the projected Compound Annual Growth Rate (CAGR) of the Biometric Authentication in Healthcare Industry?
The projected CAGR is approximately 21.29%.
2. Which companies are prominent players in the Biometric Authentication in Healthcare Industry?
Key companies in the market include Morpho, Suprema Inc, Lumidigm, Integrated Biometrics, Thales Group, Fujitsu Limited, Facetec Inc , Crossmatch Technologies Inc, Bio-Key International Inc, Imprivata Inc, NEC Corporation, Zkteco Inc.
3. What are the main segments of the Biometric Authentication in Healthcare Industry?
The market segments include Technology, Application, End User.
4. Can you provide details about the market size?
The market size is estimated to be USD 10.02 Million as of 2022.
5. What are some drivers contributing to market growth?
Implementation of Government Initiatives Supporting the Adoption of Biometrics in Healthcare; Rising Incidence of Healthcare Data Breaches and Medical Identity Theft.
6. What are the notable trends driving market growth?
Multifactor-factor Authentication is Expected to Cover a Large Share of the Market Over the Forecast Period.
7. Are there any restraints impacting market growth?
High Cost of Biometric Devices; Issues Related to the Use of Biometric Technologies.
8. Can you provide examples of recent developments in the market?
In March 2022, BioIntelliSense, has launched its medical-grade BioButton Rechargeable wearable device. The new BioButton Rechargeable device allows for continuous multi-parameter monitoring of a broad range of 20+ vital signs and physiologic biometrics for up to 30 days on a single charge, based on configuration.
9. What pricing options are available for accessing the report?
Pricing options include single-user, multi-user, and enterprise licenses priced at USD 4750, USD 5250, and USD 8750 respectively.
10. Is the market size provided in terms of value or volume?
The market size is provided in terms of value, measured in Million and volume, measured in K Unit.
11. Are there any specific market keywords associated with the report?
Yes, the market keyword associated with the report is "Biometric Authentication in Healthcare Industry," which aids in identifying and referencing the specific market segment covered.
12. How do I determine which pricing option suits my needs best?
The pricing options vary based on user requirements and access needs. Individual users may opt for single-user licenses, while businesses requiring broader access may choose multi-user or enterprise licenses for cost-effective access to the report.
13. Are there any additional resources or data provided in the Biometric Authentication in Healthcare Industry report?
While the report offers comprehensive insights, it's advisable to review the specific contents or supplementary materials provided to ascertain if additional resources or data are available.
14. How can I stay updated on further developments or reports in the Biometric Authentication in Healthcare Industry?
To stay informed about further developments, trends, and reports in the Biometric Authentication in Healthcare Industry, consider subscribing to industry newsletters, following relevant companies and organizations, or regularly checking reputable industry news sources and publications.
Methodology
Step 1 - Identification of Relevant Samples Size from Population Database


Step 2 - Approaches for Defining Global Market Size (Value, Volume* & Price*)

Note*: In applicable scenarios
Step 3 - Data Sources
Primary Research
- Web Analytics
- Survey Reports
- Research Institute
- Latest Research Reports
- Opinion Leaders
Secondary Research
- Annual Reports
- White Paper
- Latest Press Release
- Industry Association
- Paid Database
- Investor Presentations

Step 4 - Data Triangulation
Involves using different sources of information in order to increase the validity of a study
These sources are likely to be stakeholders in a program - participants, other researchers, program staff, other community members, and so on.
Then we put all data in single framework & apply various statistical tools to find out the dynamic on the market.
During the analysis stage, feedback from the stakeholder groups would be compared to determine areas of agreement as well as areas of divergence