

Key Insights
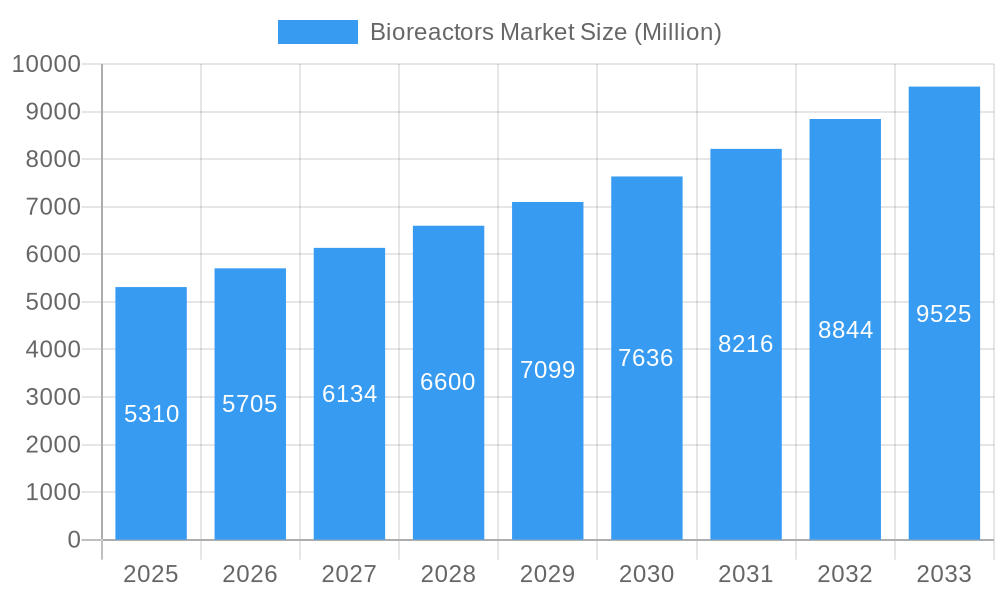
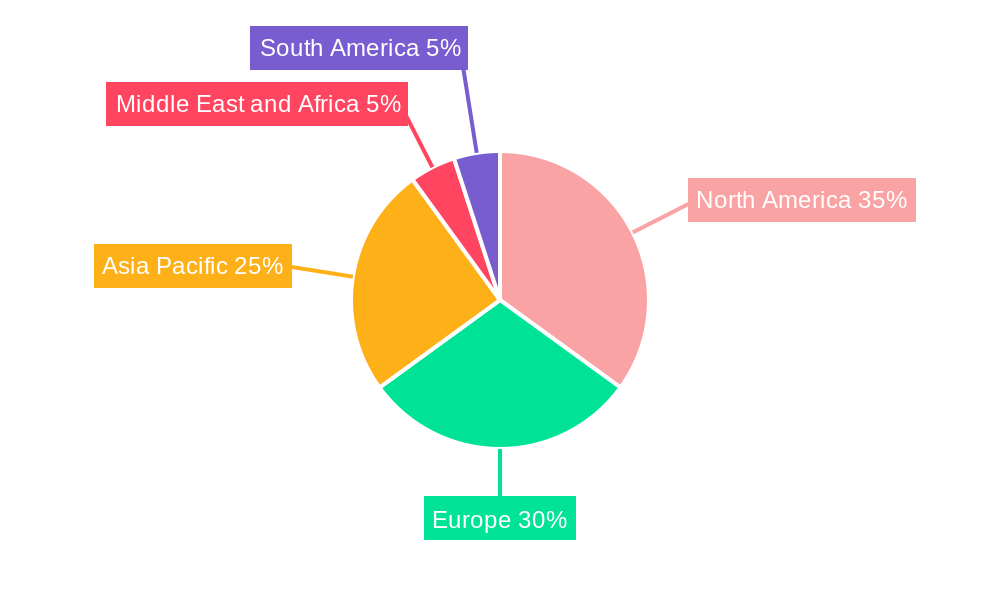
The global bioreactors market, valued at $5.31 billion in 2025, is projected to experience robust growth, driven by a Compound Annual Growth Rate (CAGR) of 7.45% from 2025 to 2033. This expansion is fueled by several key factors. The burgeoning pharmaceutical and biotechnology industries are significantly increasing demand for bioreactors across various scales, from lab-scale research to large-scale manufacturing of biologics, including monoclonal antibodies, vaccines, and recombinant proteins. Advancements in bioreactor technology, such as the development of single-use bioreactors and automated systems (MFCs), are enhancing efficiency, reducing contamination risks, and lowering operational costs, thereby further boosting market growth. Growing investments in research and development, coupled with increasing government support for biopharmaceutical initiatives, are also contributing to market expansion. The market is segmented by control type (manual and automated), material (glass, stainless steel, and single-use), usage (lab-scale, pilot-scale, and full-scale production), and scale (5L-20L, 20L-200L, 200L-1,500L, and above 1,500L). North America and Europe currently hold significant market share due to the presence of established biopharmaceutical companies and robust regulatory frameworks. However, the Asia-Pacific region is expected to witness rapid growth in the coming years, driven by increasing investments in biotechnology infrastructure and rising demand for biopharmaceuticals in developing economies.
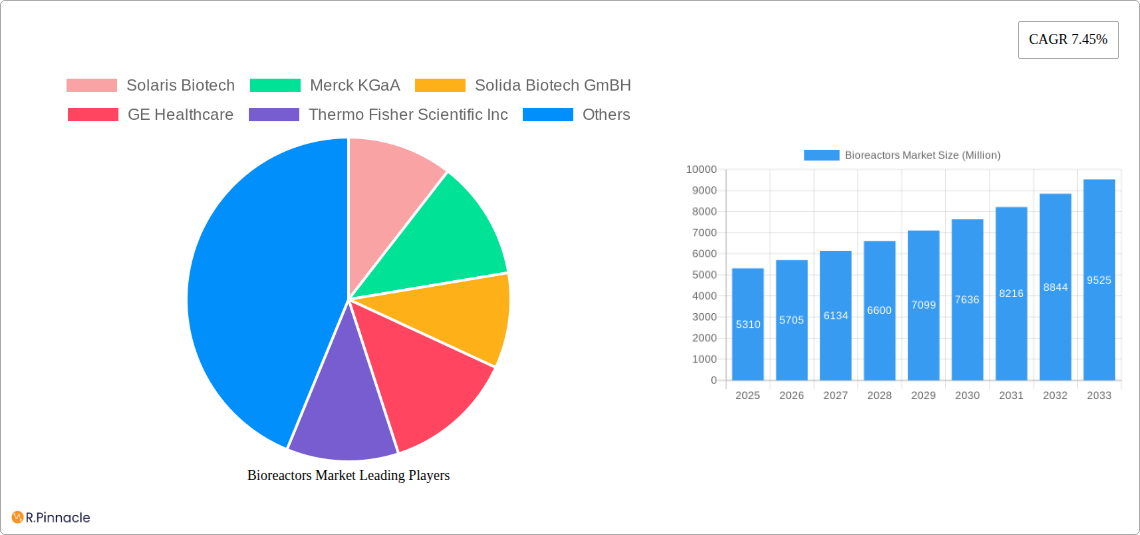
Bioreactors Market Market Size (In Billion)
Competition in the bioreactors market is intense, with major players including Solaris Biotech, Merck KGaA, Solida Biotech GmBH, GE Healthcare, Thermo Fisher Scientific Inc, Eppendorf AG, Bioengineering AG, Pall Corporation (Danaher Corporation), Sartorius AG, Getinge AB, Esco Lifesciences Group Ltd, and Infors HT constantly innovating to gain a competitive edge. These companies are focusing on developing advanced bioreactor designs, offering comprehensive services and support, and expanding their global reach to cater to the growing demand. While the market faces challenges such as high initial investment costs and stringent regulatory requirements, the long-term growth prospects remain highly positive, driven by the sustained growth of the biopharmaceutical industry and continuous advancements in bioreactor technology. The market is poised for substantial expansion, presenting lucrative opportunities for established players and new entrants alike.
Bioreactors Market Company Market Share
Bioreactors Market: A Comprehensive Report (2019-2033)
This in-depth report provides a comprehensive analysis of the Bioreactors Market, offering valuable insights for industry professionals, investors, and researchers. Covering the period from 2019 to 2033, with a base year of 2025 and a forecast period of 2025-2033, this report delves into market dynamics, segmentation, key players, and future trends. The market is expected to reach xx Million by 2033, exhibiting a CAGR of xx% during the forecast period.
Bioreactors Market Structure & Innovation Trends
The Bioreactors market exhibits a moderately concentrated structure, with key players such as Thermo Fisher Scientific Inc, Sartorius AG, and GE Healthcare holding significant market share (estimated at xx%, xx%, and xx% respectively in 2024). However, the presence of several smaller, specialized companies fosters innovation. Market concentration is influenced by factors including technological advancements, regulatory approvals, and M&A activities. Recent years have seen several strategic acquisitions, with deal values exceeding xx Million in some cases. These acquisitions have primarily focused on expanding product portfolios and geographical reach. The regulatory landscape is dynamic, with varying standards across different regions, influencing product development and market entry strategies. Substitutes for bioreactors are limited; however, alternative cell culture techniques pose a potential competitive threat. The end-user demographics span diverse sectors, including pharmaceuticals, biotechnology, and academic research, each with unique requirements impacting market demand.
- Market Share (2024): Thermo Fisher Scientific Inc (xx%), Sartorius AG (xx%), GE Healthcare (xx%), Others (xx%)
- M&A Activity (2019-2024): xx deals, with total value exceeding xx Million.
- Key Innovation Drivers: Advancements in single-use technologies, automation, and process control.
Bioreactors Market Dynamics & Trends
The Bioreactors market is experiencing robust growth, driven by several factors. The rising demand for biologics, including therapeutic proteins and vaccines, is a primary catalyst. Technological advancements, such as the development of miniaturized and single-use bioreactors, are enhancing efficiency and reducing costs. Furthermore, the increasing adoption of personalized medicine and cell-based therapies is creating new opportunities for bioreactor applications. The market exhibits strong growth potential in emerging economies due to expanding healthcare infrastructure and rising research and development activities. However, challenges such as high capital investment costs and stringent regulatory requirements can impede market growth. The competitive landscape is characterized by intense rivalry among established players and emerging companies, leading to continuous innovation and price competition.
Dominant Regions & Segments in Bioreactors Market
North America currently holds the largest market share in the Bioreactors market, driven by strong research and development activities, a robust healthcare infrastructure, and high adoption rates of advanced bioprocessing technologies. Europe follows as the second-largest market, fueled by substantial investments in biotechnology and pharmaceutical sectors. The Asia-Pacific region is exhibiting the fastest growth rate, driven by increasing demand for biopharmaceuticals and government initiatives to support the development of the biotechnology industry.
Key Drivers:
- North America: Strong R&D investments, advanced healthcare infrastructure, high adoption of advanced technologies.
- Europe: Robust pharmaceutical and biotechnology industries, supportive regulatory environment.
- Asia-Pacific: Rapid economic growth, increasing healthcare expenditure, government support for biotechnology.
Dominant Segments:
- Control Type: Automated (MFCs) is the dominant segment, due to increased process efficiency and data acquisition capabilities.
- Type: Single-use bioreactors are experiencing rapid growth, owing to reduced cleaning validation needs and lower risk of cross-contamination.
- Usage: Lab-scale production currently holds the largest market share; however, pilot-scale and full-scale production are expected to show significant growth in the coming years.
- Scale: The 20L-200L segment is currently dominant, followed by the 5L-20L scale, reflecting the prevalent demand for pilot and process development applications.
Bioreactors Market Product Innovations
Recent product innovations in the bioreactors market focus on enhancing scalability, efficiency, and process control. Single-use technologies are gaining significant traction, offering advantages such as reduced cleaning and sterilization time, and minimized risk of cross-contamination. Miniaturized bioreactors are also emerging, enabling high-throughput screening and reducing the cost of research and development. The integration of advanced sensors and automation systems further improves process monitoring and optimization. These innovations are enhancing the efficiency and flexibility of bioprocessing, thereby driving market growth.
Report Scope & Segmentation Analysis
This report segments the Bioreactors Market based on Control Type (Manual, Automated (MFCs)), Type (Glass, Stainless Steel, Single-use), Usage (Lab-scale Production, Pilot-scale Production, Full-scale Production), and Scale (5L-20L, 20L-200L, 200L-1,500L, Above 1,500L). Each segment's market size, growth rate, and competitive dynamics are analyzed in detail. For example, the single-use bioreactor segment is expected to exhibit significant growth due to its advantages in terms of cost-effectiveness and reduced contamination risk. Similarly, the automated bioreactor segment is projected to grow rapidly due to increasing demands for enhanced process control and data acquisition capabilities. The different scales represent different stages in the production pipeline, from research and development to commercial production.
Key Drivers of Bioreactors Market Growth
The Bioreactors market is propelled by several key factors: the rising demand for biologics, advancements in single-use technology minimizing cross-contamination risks, and the increasing adoption of automated systems for enhanced efficiency and data management. Government initiatives promoting biotechnology and pharmaceutical research further fuel market expansion. The shift towards personalized medicine and cell therapies also necessitates the use of bioreactors, driving growth.
Challenges in the Bioreactors Market Sector
The Bioreactors market faces challenges such as high initial investment costs for advanced systems, stringent regulatory requirements impacting time to market, and the complexity of scaling-up production. Supply chain disruptions can also impact availability and costs. Intense competition among established and emerging players exerts downward pressure on prices, affecting profitability. The need for skilled personnel to operate and maintain these sophisticated systems also poses a challenge.
Emerging Opportunities in Bioreactors Market
Emerging opportunities exist in the development of novel bioreactor designs for specific applications, such as continuous manufacturing and the production of cell-based therapies. The integration of artificial intelligence (AI) and machine learning (ML) into bioreactor systems offers potential for improved process control and optimization. Expansion into emerging markets with growing healthcare sectors provides significant growth potential. The focus on sustainability and reducing environmental impact also presents opportunities for eco-friendly bioreactor designs.
Leading Players in the Bioreactors Market Market
- Solaris Biotech
- Merck KGaA
- Solida Biotech GmBH
- GE Healthcare
- Thermo Fisher Scientific Inc
- Eppendorf AG
- Bioengineering AG
- Pall Corporation (Danaher Corporation)
- Sartorius AG
- Getinge AB
- Esco Lifesciences Group Ltd
- Infors HT
Key Developments in Bioreactors Market Industry
- October 2022: Getinge AB announced that their bioreactors will support the Dutch government's initiative to produce animal products such as meat and milk proteins directly from animal and microbial cells. This highlights the expanding applications of bioreactors beyond traditional pharmaceuticals.
- May 2022: Pall Corporation announced that its ICELL, a nano bioreactor, helped the Institute of Biomedicine of Seville (IBIS) develop viral vectors for CAR-T therapy. This demonstrates the role of advanced bioreactor technology in cutting-edge therapeutic development.
Future Outlook for Bioreactors Market Market
The Bioreactors market is poised for continued growth, driven by factors such as technological advancements, increasing demand for biologics, and the expansion of the cell and gene therapy markets. Strategic partnerships and acquisitions will likely shape the competitive landscape. The focus on automation, single-use technologies, and process intensification will drive innovation and efficiency gains. The market's future potential is significant, offering ample opportunities for growth and investment.
Bioreactors Market Segmentation
-
1. Type
- 1.1. Glass
- 1.2. Stainless Steel
- 1.3. Single-use
-
2. Usage
- 2.1. Lab-scale Production
- 2.2. Pilot-scale Production
- 2.3. Full-scale Production
-
3. Scale
- 3.1. 5L-20L
- 3.2. 20L-200L
- 3.3. 200L-1,500L
- 3.4. Above 1,500L
-
4. Control Type
- 4.1. Manual
- 4.2. Automated (MFCs)
Bioreactors Market Segmentation By Geography
-
1. North America
- 1.1. United States
- 1.2. Canada
- 1.3. Mexico
-
2. Europe
- 2.1. Germany
- 2.2. United Kingdom
- 2.3. France
- 2.4. Italy
- 2.5. Spain
- 2.6. Rest of Europe
-
3. Asia Pacific
- 3.1. China
- 3.2. Japan
- 3.3. India
- 3.4. Australia
- 3.5. South Korea
- 3.6. Rest of Asia Pacific
-
4. Middle East and Africa
- 4.1. GCC
- 4.2. South Africa
- 4.3. Rest of Middle East and Africa
-
5. South America
- 5.1. Brazil
- 5.2. Argentina
- 5.3. Rest of South America
Bioreactors Market Regional Market Share
Geographic Coverage of Bioreactors Market
Bioreactors Market REPORT HIGHLIGHTS
| Aspects | Details |
|---|---|
| Study Period | 2020-2034 |
| Base Year | 2025 |
| Estimated Year | 2026 |
| Forecast Period | 2026-2034 |
| Historical Period | 2020-2025 |
| Growth Rate | CAGR of 7.45% from 2020-2034 |
| Segmentation |
|
Table of Contents
- 1. Introduction
- 1.1. Research Scope
- 1.2. Market Segmentation
- 1.3. Research Objective
- 1.4. Definitions and Assumptions
- 2. Executive Summary
- 2.1. Market Snapshot
- 3. Market Dynamics
- 3.1. Market Drivers
- 3.2. Market Restrains
- 3.3. Market Trends
- 3.4. Market Opportunities
- 4. Market Factor Analysis
- 4.1. Porters Five Forces
- 4.1.1. Bargaining Power of Suppliers
- 4.1.2. Bargaining Power of Buyers
- 4.1.3. Threat of New Entrants
- 4.1.4. Threat of Substitutes
- 4.1.5. Competitive Rivalry
- 4.2. PESTEL analysis
- 4.3. BCG Analysis
- 4.3.1. Stars (High Growth, High Market Share)
- 4.3.2. Cash Cows (Low Growth, High Market Share)
- 4.3.3. Question Mark (High Growth, Low Market Share)
- 4.3.4. Dogs (Low Growth, Low Market Share)
- 4.4. Ansoff Matrix Analysis
- 4.5. Supply Chain Analysis
- 4.6. Regulatory Landscape
- 4.7. Current Market Potential and Opportunity Assessment (TAM–SAM–SOM Framework)
- 4.8. PRI Analyst Note
- 4.1. Porters Five Forces
- 5. Market Analysis, Insights and Forecast 2021-2033
- 5.1. Market Analysis, Insights and Forecast - by Type
- 5.1.1. Glass
- 5.1.2. Stainless Steel
- 5.1.3. Single-use
- 5.2. Market Analysis, Insights and Forecast - by Usage
- 5.2.1. Lab-scale Production
- 5.2.2. Pilot-scale Production
- 5.2.3. Full-scale Production
- 5.3. Market Analysis, Insights and Forecast - by Scale
- 5.3.1. 5L-20L
- 5.3.2. 20L-200L
- 5.3.3. 200L-1,500L
- 5.3.4. Above 1,500L
- 5.4. Market Analysis, Insights and Forecast - by Control Type
- 5.4.1. Manual
- 5.4.2. Automated (MFCs)
- 5.5. Market Analysis, Insights and Forecast - by Region
- 5.5.1. North America
- 5.5.2. Europe
- 5.5.3. Asia Pacific
- 5.5.4. Middle East and Africa
- 5.5.5. South America
- 5.1. Market Analysis, Insights and Forecast - by Type
- 6. Global Bioreactors Market Analysis, Insights and Forecast, 2021-2033
- 6.1. Market Analysis, Insights and Forecast - by Type
- 6.1.1. Glass
- 6.1.2. Stainless Steel
- 6.1.3. Single-use
- 6.2. Market Analysis, Insights and Forecast - by Usage
- 6.2.1. Lab-scale Production
- 6.2.2. Pilot-scale Production
- 6.2.3. Full-scale Production
- 6.3. Market Analysis, Insights and Forecast - by Scale
- 6.3.1. 5L-20L
- 6.3.2. 20L-200L
- 6.3.3. 200L-1,500L
- 6.3.4. Above 1,500L
- 6.4. Market Analysis, Insights and Forecast - by Control Type
- 6.4.1. Manual
- 6.4.2. Automated (MFCs)
- 6.1. Market Analysis, Insights and Forecast - by Type
- 7. North America Bioreactors Market Analysis, Insights and Forecast, 2020-2032
- 7.1. Market Analysis, Insights and Forecast - by Type
- 7.1.1. Glass
- 7.1.2. Stainless Steel
- 7.1.3. Single-use
- 7.2. Market Analysis, Insights and Forecast - by Usage
- 7.2.1. Lab-scale Production
- 7.2.2. Pilot-scale Production
- 7.2.3. Full-scale Production
- 7.3. Market Analysis, Insights and Forecast - by Scale
- 7.3.1. 5L-20L
- 7.3.2. 20L-200L
- 7.3.3. 200L-1,500L
- 7.3.4. Above 1,500L
- 7.4. Market Analysis, Insights and Forecast - by Control Type
- 7.4.1. Manual
- 7.4.2. Automated (MFCs)
- 7.1. Market Analysis, Insights and Forecast - by Type
- 8. Europe Bioreactors Market Analysis, Insights and Forecast, 2020-2032
- 8.1. Market Analysis, Insights and Forecast - by Type
- 8.1.1. Glass
- 8.1.2. Stainless Steel
- 8.1.3. Single-use
- 8.2. Market Analysis, Insights and Forecast - by Usage
- 8.2.1. Lab-scale Production
- 8.2.2. Pilot-scale Production
- 8.2.3. Full-scale Production
- 8.3. Market Analysis, Insights and Forecast - by Scale
- 8.3.1. 5L-20L
- 8.3.2. 20L-200L
- 8.3.3. 200L-1,500L
- 8.3.4. Above 1,500L
- 8.4. Market Analysis, Insights and Forecast - by Control Type
- 8.4.1. Manual
- 8.4.2. Automated (MFCs)
- 8.1. Market Analysis, Insights and Forecast - by Type
- 9. Asia Pacific Bioreactors Market Analysis, Insights and Forecast, 2020-2032
- 9.1. Market Analysis, Insights and Forecast - by Type
- 9.1.1. Glass
- 9.1.2. Stainless Steel
- 9.1.3. Single-use
- 9.2. Market Analysis, Insights and Forecast - by Usage
- 9.2.1. Lab-scale Production
- 9.2.2. Pilot-scale Production
- 9.2.3. Full-scale Production
- 9.3. Market Analysis, Insights and Forecast - by Scale
- 9.3.1. 5L-20L
- 9.3.2. 20L-200L
- 9.3.3. 200L-1,500L
- 9.3.4. Above 1,500L
- 9.4. Market Analysis, Insights and Forecast - by Control Type
- 9.4.1. Manual
- 9.4.2. Automated (MFCs)
- 9.1. Market Analysis, Insights and Forecast - by Type
- 10. Middle East and Africa Bioreactors Market Analysis, Insights and Forecast, 2020-2032
- 10.1. Market Analysis, Insights and Forecast - by Type
- 10.1.1. Glass
- 10.1.2. Stainless Steel
- 10.1.3. Single-use
- 10.2. Market Analysis, Insights and Forecast - by Usage
- 10.2.1. Lab-scale Production
- 10.2.2. Pilot-scale Production
- 10.2.3. Full-scale Production
- 10.3. Market Analysis, Insights and Forecast - by Scale
- 10.3.1. 5L-20L
- 10.3.2. 20L-200L
- 10.3.3. 200L-1,500L
- 10.3.4. Above 1,500L
- 10.4. Market Analysis, Insights and Forecast - by Control Type
- 10.4.1. Manual
- 10.4.2. Automated (MFCs)
- 10.1. Market Analysis, Insights and Forecast - by Type
- 11. South America Bioreactors Market Analysis, Insights and Forecast, 2020-2032
- 11.1. Market Analysis, Insights and Forecast - by Type
- 11.1.1. Glass
- 11.1.2. Stainless Steel
- 11.1.3. Single-use
- 11.2. Market Analysis, Insights and Forecast - by Usage
- 11.2.1. Lab-scale Production
- 11.2.2. Pilot-scale Production
- 11.2.3. Full-scale Production
- 11.3. Market Analysis, Insights and Forecast - by Scale
- 11.3.1. 5L-20L
- 11.3.2. 20L-200L
- 11.3.3. 200L-1,500L
- 11.3.4. Above 1,500L
- 11.4. Market Analysis, Insights and Forecast - by Control Type
- 11.4.1. Manual
- 11.4.2. Automated (MFCs)
- 11.1. Market Analysis, Insights and Forecast - by Type
- 12. Competitive Analysis
- 12.1. Company Profiles
- 12.1.1 Solaris Biotech
- 12.1.1.1. Company Overview
- 12.1.1.2. Products
- 12.1.1.3. Company Financials
- 12.1.1.4. SWOT Analysis
- 12.1.2 Merck KGaA
- 12.1.2.1. Company Overview
- 12.1.2.2. Products
- 12.1.2.3. Company Financials
- 12.1.2.4. SWOT Analysis
- 12.1.3 Solida Biotech GmBH
- 12.1.3.1. Company Overview
- 12.1.3.2. Products
- 12.1.3.3. Company Financials
- 12.1.3.4. SWOT Analysis
- 12.1.4 GE Healthcare
- 12.1.4.1. Company Overview
- 12.1.4.2. Products
- 12.1.4.3. Company Financials
- 12.1.4.4. SWOT Analysis
- 12.1.5 Thermo Fisher Scientific Inc
- 12.1.5.1. Company Overview
- 12.1.5.2. Products
- 12.1.5.3. Company Financials
- 12.1.5.4. SWOT Analysis
- 12.1.6 Eppendorf AG
- 12.1.6.1. Company Overview
- 12.1.6.2. Products
- 12.1.6.3. Company Financials
- 12.1.6.4. SWOT Analysis
- 12.1.7 Bioengineering AG
- 12.1.7.1. Company Overview
- 12.1.7.2. Products
- 12.1.7.3. Company Financials
- 12.1.7.4. SWOT Analysis
- 12.1.8 Pall Corporation (Danaher Corporation)
- 12.1.8.1. Company Overview
- 12.1.8.2. Products
- 12.1.8.3. Company Financials
- 12.1.8.4. SWOT Analysis
- 12.1.9 Sartorius AG
- 12.1.9.1. Company Overview
- 12.1.9.2. Products
- 12.1.9.3. Company Financials
- 12.1.9.4. SWOT Analysis
- 12.1.10 Getinge AB
- 12.1.10.1. Company Overview
- 12.1.10.2. Products
- 12.1.10.3. Company Financials
- 12.1.10.4. SWOT Analysis
- 12.1.11 Esco Lifesciences Group Ltd
- 12.1.11.1. Company Overview
- 12.1.11.2. Products
- 12.1.11.3. Company Financials
- 12.1.11.4. SWOT Analysis
- 12.1.12 Infors HT
- 12.1.12.1. Company Overview
- 12.1.12.2. Products
- 12.1.12.3. Company Financials
- 12.1.12.4. SWOT Analysis
- 12.1.1 Solaris Biotech
- 12.2. Market Entropy
- 12.2.1 Company's Key Areas Served
- 12.2.2 Recent Developments
- 12.3. Company Market Share Analysis 2025
- 12.3.1 Top 5 Companies Market Share Analysis
- 12.3.2 Top 3 Companies Market Share Analysis
- 12.4. List of Potential Customers
- 13. Research Methodology
List of Figures
- Figure 1: Global Bioreactors Market Revenue Breakdown (Million, %) by Region 2025 & 2033
- Figure 2: North America Bioreactors Market Revenue (Million), by Type 2025 & 2033
- Figure 3: North America Bioreactors Market Revenue Share (%), by Type 2025 & 2033
- Figure 4: North America Bioreactors Market Revenue (Million), by Usage 2025 & 2033
- Figure 5: North America Bioreactors Market Revenue Share (%), by Usage 2025 & 2033
- Figure 6: North America Bioreactors Market Revenue (Million), by Scale 2025 & 2033
- Figure 7: North America Bioreactors Market Revenue Share (%), by Scale 2025 & 2033
- Figure 8: North America Bioreactors Market Revenue (Million), by Control Type 2025 & 2033
- Figure 9: North America Bioreactors Market Revenue Share (%), by Control Type 2025 & 2033
- Figure 10: North America Bioreactors Market Revenue (Million), by Country 2025 & 2033
- Figure 11: North America Bioreactors Market Revenue Share (%), by Country 2025 & 2033
- Figure 12: Europe Bioreactors Market Revenue (Million), by Type 2025 & 2033
- Figure 13: Europe Bioreactors Market Revenue Share (%), by Type 2025 & 2033
- Figure 14: Europe Bioreactors Market Revenue (Million), by Usage 2025 & 2033
- Figure 15: Europe Bioreactors Market Revenue Share (%), by Usage 2025 & 2033
- Figure 16: Europe Bioreactors Market Revenue (Million), by Scale 2025 & 2033
- Figure 17: Europe Bioreactors Market Revenue Share (%), by Scale 2025 & 2033
- Figure 18: Europe Bioreactors Market Revenue (Million), by Control Type 2025 & 2033
- Figure 19: Europe Bioreactors Market Revenue Share (%), by Control Type 2025 & 2033
- Figure 20: Europe Bioreactors Market Revenue (Million), by Country 2025 & 2033
- Figure 21: Europe Bioreactors Market Revenue Share (%), by Country 2025 & 2033
- Figure 22: Asia Pacific Bioreactors Market Revenue (Million), by Type 2025 & 2033
- Figure 23: Asia Pacific Bioreactors Market Revenue Share (%), by Type 2025 & 2033
- Figure 24: Asia Pacific Bioreactors Market Revenue (Million), by Usage 2025 & 2033
- Figure 25: Asia Pacific Bioreactors Market Revenue Share (%), by Usage 2025 & 2033
- Figure 26: Asia Pacific Bioreactors Market Revenue (Million), by Scale 2025 & 2033
- Figure 27: Asia Pacific Bioreactors Market Revenue Share (%), by Scale 2025 & 2033
- Figure 28: Asia Pacific Bioreactors Market Revenue (Million), by Control Type 2025 & 2033
- Figure 29: Asia Pacific Bioreactors Market Revenue Share (%), by Control Type 2025 & 2033
- Figure 30: Asia Pacific Bioreactors Market Revenue (Million), by Country 2025 & 2033
- Figure 31: Asia Pacific Bioreactors Market Revenue Share (%), by Country 2025 & 2033
- Figure 32: Middle East and Africa Bioreactors Market Revenue (Million), by Type 2025 & 2033
- Figure 33: Middle East and Africa Bioreactors Market Revenue Share (%), by Type 2025 & 2033
- Figure 34: Middle East and Africa Bioreactors Market Revenue (Million), by Usage 2025 & 2033
- Figure 35: Middle East and Africa Bioreactors Market Revenue Share (%), by Usage 2025 & 2033
- Figure 36: Middle East and Africa Bioreactors Market Revenue (Million), by Scale 2025 & 2033
- Figure 37: Middle East and Africa Bioreactors Market Revenue Share (%), by Scale 2025 & 2033
- Figure 38: Middle East and Africa Bioreactors Market Revenue (Million), by Control Type 2025 & 2033
- Figure 39: Middle East and Africa Bioreactors Market Revenue Share (%), by Control Type 2025 & 2033
- Figure 40: Middle East and Africa Bioreactors Market Revenue (Million), by Country 2025 & 2033
- Figure 41: Middle East and Africa Bioreactors Market Revenue Share (%), by Country 2025 & 2033
- Figure 42: South America Bioreactors Market Revenue (Million), by Type 2025 & 2033
- Figure 43: South America Bioreactors Market Revenue Share (%), by Type 2025 & 2033
- Figure 44: South America Bioreactors Market Revenue (Million), by Usage 2025 & 2033
- Figure 45: South America Bioreactors Market Revenue Share (%), by Usage 2025 & 2033
- Figure 46: South America Bioreactors Market Revenue (Million), by Scale 2025 & 2033
- Figure 47: South America Bioreactors Market Revenue Share (%), by Scale 2025 & 2033
- Figure 48: South America Bioreactors Market Revenue (Million), by Control Type 2025 & 2033
- Figure 49: South America Bioreactors Market Revenue Share (%), by Control Type 2025 & 2033
- Figure 50: South America Bioreactors Market Revenue (Million), by Country 2025 & 2033
- Figure 51: South America Bioreactors Market Revenue Share (%), by Country 2025 & 2033
List of Tables
- Table 1: Global Bioreactors Market Revenue Million Forecast, by Type 2020 & 2033
- Table 2: Global Bioreactors Market Revenue Million Forecast, by Usage 2020 & 2033
- Table 3: Global Bioreactors Market Revenue Million Forecast, by Scale 2020 & 2033
- Table 4: Global Bioreactors Market Revenue Million Forecast, by Control Type 2020 & 2033
- Table 5: Global Bioreactors Market Revenue Million Forecast, by Region 2020 & 2033
- Table 6: Global Bioreactors Market Revenue Million Forecast, by Type 2020 & 2033
- Table 7: Global Bioreactors Market Revenue Million Forecast, by Usage 2020 & 2033
- Table 8: Global Bioreactors Market Revenue Million Forecast, by Scale 2020 & 2033
- Table 9: Global Bioreactors Market Revenue Million Forecast, by Control Type 2020 & 2033
- Table 10: Global Bioreactors Market Revenue Million Forecast, by Country 2020 & 2033
- Table 11: United States Bioreactors Market Revenue (Million) Forecast, by Application 2020 & 2033
- Table 12: Canada Bioreactors Market Revenue (Million) Forecast, by Application 2020 & 2033
- Table 13: Mexico Bioreactors Market Revenue (Million) Forecast, by Application 2020 & 2033
- Table 14: Global Bioreactors Market Revenue Million Forecast, by Type 2020 & 2033
- Table 15: Global Bioreactors Market Revenue Million Forecast, by Usage 2020 & 2033
- Table 16: Global Bioreactors Market Revenue Million Forecast, by Scale 2020 & 2033
- Table 17: Global Bioreactors Market Revenue Million Forecast, by Control Type 2020 & 2033
- Table 18: Global Bioreactors Market Revenue Million Forecast, by Country 2020 & 2033
- Table 19: Germany Bioreactors Market Revenue (Million) Forecast, by Application 2020 & 2033
- Table 20: United Kingdom Bioreactors Market Revenue (Million) Forecast, by Application 2020 & 2033
- Table 21: France Bioreactors Market Revenue (Million) Forecast, by Application 2020 & 2033
- Table 22: Italy Bioreactors Market Revenue (Million) Forecast, by Application 2020 & 2033
- Table 23: Spain Bioreactors Market Revenue (Million) Forecast, by Application 2020 & 2033
- Table 24: Rest of Europe Bioreactors Market Revenue (Million) Forecast, by Application 2020 & 2033
- Table 25: Global Bioreactors Market Revenue Million Forecast, by Type 2020 & 2033
- Table 26: Global Bioreactors Market Revenue Million Forecast, by Usage 2020 & 2033
- Table 27: Global Bioreactors Market Revenue Million Forecast, by Scale 2020 & 2033
- Table 28: Global Bioreactors Market Revenue Million Forecast, by Control Type 2020 & 2033
- Table 29: Global Bioreactors Market Revenue Million Forecast, by Country 2020 & 2033
- Table 30: China Bioreactors Market Revenue (Million) Forecast, by Application 2020 & 2033
- Table 31: Japan Bioreactors Market Revenue (Million) Forecast, by Application 2020 & 2033
- Table 32: India Bioreactors Market Revenue (Million) Forecast, by Application 2020 & 2033
- Table 33: Australia Bioreactors Market Revenue (Million) Forecast, by Application 2020 & 2033
- Table 34: South Korea Bioreactors Market Revenue (Million) Forecast, by Application 2020 & 2033
- Table 35: Rest of Asia Pacific Bioreactors Market Revenue (Million) Forecast, by Application 2020 & 2033
- Table 36: Global Bioreactors Market Revenue Million Forecast, by Type 2020 & 2033
- Table 37: Global Bioreactors Market Revenue Million Forecast, by Usage 2020 & 2033
- Table 38: Global Bioreactors Market Revenue Million Forecast, by Scale 2020 & 2033
- Table 39: Global Bioreactors Market Revenue Million Forecast, by Control Type 2020 & 2033
- Table 40: Global Bioreactors Market Revenue Million Forecast, by Country 2020 & 2033
- Table 41: GCC Bioreactors Market Revenue (Million) Forecast, by Application 2020 & 2033
- Table 42: South Africa Bioreactors Market Revenue (Million) Forecast, by Application 2020 & 2033
- Table 43: Rest of Middle East and Africa Bioreactors Market Revenue (Million) Forecast, by Application 2020 & 2033
- Table 44: Global Bioreactors Market Revenue Million Forecast, by Type 2020 & 2033
- Table 45: Global Bioreactors Market Revenue Million Forecast, by Usage 2020 & 2033
- Table 46: Global Bioreactors Market Revenue Million Forecast, by Scale 2020 & 2033
- Table 47: Global Bioreactors Market Revenue Million Forecast, by Control Type 2020 & 2033
- Table 48: Global Bioreactors Market Revenue Million Forecast, by Country 2020 & 2033
- Table 49: Brazil Bioreactors Market Revenue (Million) Forecast, by Application 2020 & 2033
- Table 50: Argentina Bioreactors Market Revenue (Million) Forecast, by Application 2020 & 2033
- Table 51: Rest of South America Bioreactors Market Revenue (Million) Forecast, by Application 2020 & 2033
Frequently Asked Questions
1. What is the projected Compound Annual Growth Rate (CAGR) of the Bioreactors Market?
The projected CAGR is approximately 7.45%.
2. Which companies are prominent players in the Bioreactors Market?
Key companies in the market include Solaris Biotech, Merck KGaA, Solida Biotech GmBH, GE Healthcare, Thermo Fisher Scientific Inc, Eppendorf AG, Bioengineering AG, Pall Corporation (Danaher Corporation), Sartorius AG, Getinge AB, Esco Lifesciences Group Ltd, Infors HT.
3. What are the main segments of the Bioreactors Market?
The market segments include Type, Usage, Scale, Control Type.
4. Can you provide details about the market size?
The market size is estimated to be USD 5.31 Million as of 2022.
5. What are some drivers contributing to market growth?
Growth of Bioreactors in Pharmaceuticals; Technological Advancements in Bioreactors; Adoption of Single-use bioreactors (SUBs) and Hybrid Bioreactors.
6. What are the notable trends driving market growth?
The Single-use Bioreactors Segment is Expected to Have A High Growth Rate During the Forecast Period.
7. Are there any restraints impacting market growth?
Concerns Regarding the Use of Single-use Bioreactors (SUBs); Limited Storage Capacity.
8. Can you provide examples of recent developments in the market?
October 2022: Getinge AB announced that their bioreactors will support the Dutch government's initiative to produce animal products such as meat and milk proteins directly from animal and microbial cells.
9. What pricing options are available for accessing the report?
Pricing options include single-user, multi-user, and enterprise licenses priced at USD 4750, USD 5250, and USD 8750 respectively.
10. Is the market size provided in terms of value or volume?
The market size is provided in terms of value, measured in Million.
11. Are there any specific market keywords associated with the report?
Yes, the market keyword associated with the report is "Bioreactors Market," which aids in identifying and referencing the specific market segment covered.
12. How do I determine which pricing option suits my needs best?
The pricing options vary based on user requirements and access needs. Individual users may opt for single-user licenses, while businesses requiring broader access may choose multi-user or enterprise licenses for cost-effective access to the report.
13. Are there any additional resources or data provided in the Bioreactors Market report?
While the report offers comprehensive insights, it's advisable to review the specific contents or supplementary materials provided to ascertain if additional resources or data are available.
14. How can I stay updated on further developments or reports in the Bioreactors Market?
To stay informed about further developments, trends, and reports in the Bioreactors Market, consider subscribing to industry newsletters, following relevant companies and organizations, or regularly checking reputable industry news sources and publications.
Methodology
Step 1 - Identification of Relevant Samples Size from Population Database


Step 2 - Approaches for Defining Global Market Size (Value, Volume* & Price*)

Note*: In applicable scenarios
Step 3 - Data Sources
Primary Research
- Web Analytics
- Survey Reports
- Research Institute
- Latest Research Reports
- Opinion Leaders
Secondary Research
- Annual Reports
- White Paper
- Latest Press Release
- Industry Association
- Paid Database
- Investor Presentations

Step 4 - Data Triangulation
Involves using different sources of information in order to increase the validity of a study
These sources are likely to be stakeholders in a program - participants, other researchers, program staff, other community members, and so on.
Then we put all data in single framework & apply various statistical tools to find out the dynamic on the market.
During the analysis stage, feedback from the stakeholder groups would be compared to determine areas of agreement as well as areas of divergence