

Key Insights
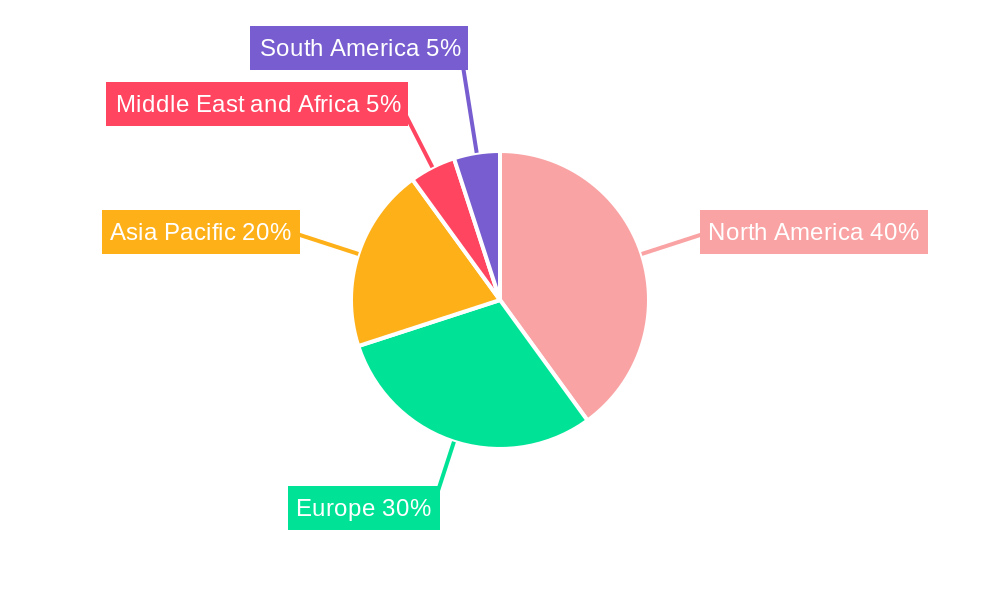
The global biosafety testing services market, valued at $5.38 billion in 2025, is projected for significant expansion with a compound annual growth rate (CAGR) of 10.69% from 2025 to 2033. This growth is driven by increased global demand for infectious disease containment, the rapid advancement of biotechnology and pharmaceutical sectors (particularly in vaccines, cell and gene therapies), and stringent regulatory mandates. The market is segmented by product (reagents, kits, instruments), application (vaccines, therapeutics, cell and gene therapy, blood products), and test type (sterility, bioburden, endotoxin). North America leads market share, supported by advanced research infrastructure and strict regulatory compliance, followed by Europe and Asia-Pacific.
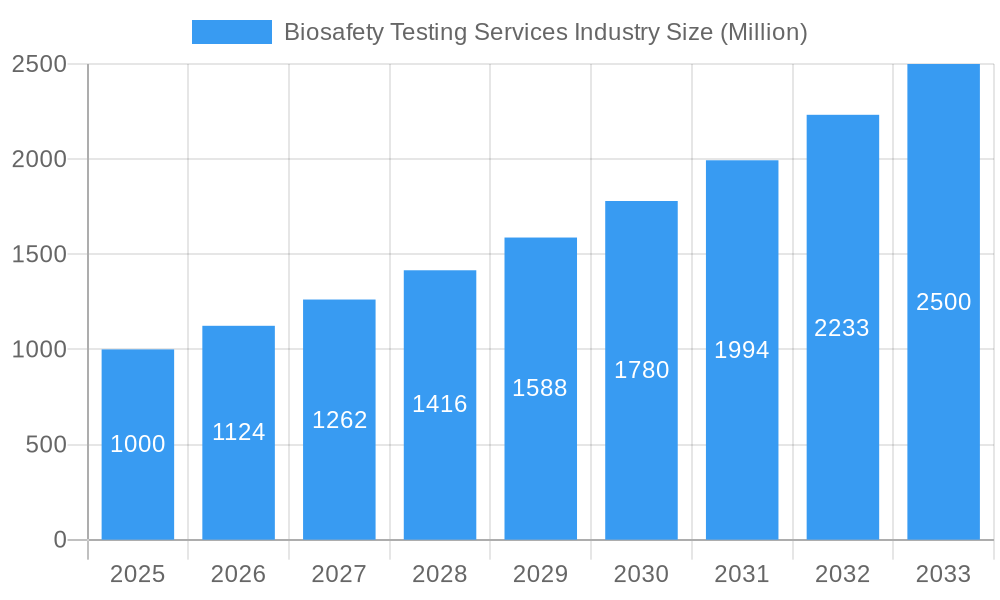
Biosafety Testing Services Industry Market Size (In Billion)
The Asia-Pacific region is anticipated to exhibit the fastest growth due to rising healthcare investments and escalating R&D in the life sciences. Key growth inhibitors include high testing costs and regulatory complexity. However, advancements in testing technologies, automation, and the growing trend of outsourcing testing services are expected to counter these challenges. Prominent market players like Promega Corporation, Merck KGaA, Eurofins Scientific, and Thermo Fisher Scientific are actively innovating to deliver comprehensive and efficient biosafety solutions.
Biosafety Testing Services Industry Company Market Share
Biosafety Testing Services Market Analysis: 2025-2033
This in-depth report analyzes the Biosafety Testing Services market, providing critical insights for stakeholders. The analysis covers the period 2025-2033, with 2025 as the base year. The global market size is expected to reach $5.38 billion by 2033, with a projected CAGR of 10.69%.
Biosafety Testing Services Industry Market Structure & Innovation Trends
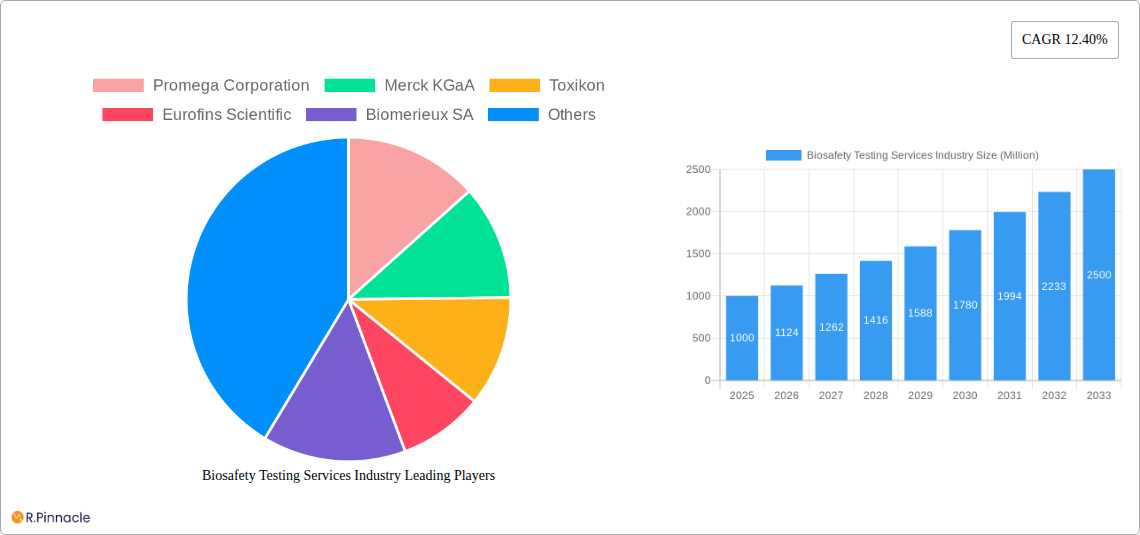
The Biosafety Testing Services market is moderately concentrated, with several key players holding significant market share. Promega Corporation, Merck KGaA, Toxikon, Eurofins Scientific, Biomerieux SA, Cytovance Biologics, WuXi AppTec, Lonza, Avance Biosciences, and Thermo Fisher Scientific are among the dominant companies, collectively accounting for an estimated xx% of the market in 2025. Market share dynamics are influenced by factors such as technological advancements, regulatory changes, and strategic mergers and acquisitions (M&A). The industry has witnessed several significant M&A deals in recent years, with total deal values exceeding xx Million.
- Market Concentration: Moderately concentrated, with top 10 players holding xx% market share (2025).
- Innovation Drivers: Advancements in automation, high-throughput technologies, and rapid diagnostic testing are key drivers.
- Regulatory Framework: Stringent regulatory guidelines (e.g., FDA, EMA) significantly influence market growth and product development.
- Product Substitutes: Limited direct substitutes exist; however, cost-effective alternatives are emerging, posing competitive pressure.
- End-User Demographics: Primarily pharmaceutical and biotechnology companies, research institutions, and healthcare providers.
- M&A Activities: Significant M&A activity observed, driving consolidation and market expansion (total deal value exceeding xx Million in the last five years).
Biosafety Testing Services Industry Market Dynamics & Trends
The Biosafety Testing Services market is experiencing robust growth, driven by several key factors. The increasing prevalence of infectious diseases, the rising demand for biologics and biosimilars, and the growing focus on ensuring product safety and quality are significant market drivers. Technological advancements, such as automation and miniaturization, are enhancing testing efficiency and reducing costs. Consumer preference for safer and more effective healthcare products fuels market expansion. Intense competition among established players and emerging companies is shaping market dynamics. The market penetration of advanced testing technologies is steadily increasing, with an expected xx% penetration by 2033.
The market is projected to grow at a CAGR of xx% from 2025 to 2033, driven by factors such as increased R&D investment in biopharmaceuticals, stringent regulatory requirements, and rising awareness of biosafety. Technological advancements in automation, AI-driven analysis and rapid diagnostic tests are further accelerating market growth. However, the high cost of testing, particularly for advanced technologies, and the need for skilled personnel could restrain growth to some extent.
Dominant Regions & Segments in Biosafety Testing Services Industry
North America currently holds the largest market share in the Biosafety Testing Services industry, driven by robust R&D investments, stringent regulations, and the high prevalence of biopharmaceutical companies. Europe and Asia Pacific are also significant markets, exhibiting strong growth potential.
- Leading Region: North America (driven by strong R&D and regulatory environment).
- Leading Segment (Product): Reagents and Kits (largest market share due to high demand and lower cost).
- Leading Segment (Application): Vaccines and Therapeutics (largest demand due to stringent regulatory requirements and high volume production).
- Leading Segment (Test): Sterility Tests (highest demand due to regulatory compliance needs).
Key Drivers by Region:
- North America: Strong R&D investments, stringent regulatory environment, high concentration of biopharmaceutical companies.
- Europe: Well-established pharmaceutical industry, increasing adoption of advanced testing technologies, favorable government policies.
- Asia Pacific: Rapid growth of pharmaceutical and biotechnology sectors, increasing healthcare spending, rising awareness of biosafety.
Biosafety Testing Services Industry Product Innovations
Recent years have witnessed significant product innovations in the Biosafety Testing Services industry. The introduction of automated systems like Lonza’s PyroTec PRO and Redberry’s Red One Automated Bioburden Detection has streamlined testing processes and improved efficiency. These innovations focus on enhancing speed, accuracy, and reducing manual labor. The market is witnessing a shift towards faster, more sensitive, and automated testing methods, reflecting technological advances and customer demand for improved efficiency and cost reduction.
Report Scope & Segmentation Analysis
This report segments the Biosafety Testing Services market based on product (Reagents and Kits, Instruments, Other Products), application (Vaccines and Therapeutics, Cellular and Gene Therapy, Blood and Blood-based Therapy, Other Applications), and test type (Sterility Tests, Bioburden Tests, Endotoxin Tests, Other Tests). Each segment is analyzed in detail, including market size, growth projections, and competitive dynamics. Significant growth is projected for segments like cellular and gene therapy testing due to the increasing investments in these therapeutic areas.
Key Drivers of Biosafety Testing Services Industry Growth
The growth of the Biosafety Testing Services industry is propelled by several factors:
- Stringent Regulatory Compliance: Growing regulatory pressure necessitates thorough biosafety testing for pharmaceutical and biological products.
- Technological Advancements: Automation, miniaturization, and advanced analytical techniques are enhancing testing capabilities.
- Rising Demand for Biologics: The increasing demand for biologics and biosimilars drives the need for comprehensive biosafety testing.
Challenges in the Biosafety Testing Services Industry Sector
The Biosafety Testing Services industry faces several challenges:
- High Testing Costs: Advanced technologies can be expensive, potentially limiting accessibility for smaller companies.
- Supply Chain Disruptions: Global supply chain challenges can impact the availability of essential reagents and equipment.
- Skilled Personnel Shortage: The need for specialized expertise can create a bottleneck in testing capacity.
Emerging Opportunities in Biosafety Testing Services Industry
Several emerging opportunities exist within the Biosafety Testing Services industry:
- Point-of-care diagnostics: Development of rapid, on-site testing solutions will drive market expansion.
- Personalized medicine: Tailored testing solutions for individual patients represent a significant growth area.
- Expansion into emerging markets: Developing economies offer significant untapped potential for biosafety testing services.
Leading Players in the Biosafety Testing Services Industry Market
- Promega Corporation
- Merck KGaA
- Toxikon
- Eurofins Scientific
- Biomerieux SA
- Cytovance Biologics
- WuXi AppTec
- Lonza
- Avance Biosciences
- Thermo Fisher Scientific
Key Developments in Biosafety Testing Services Industry Industry
- April 2021: Lonza expanded its product "PyroTec PRO Automated Robotic Solution" for endotoxin testing.
- December 2020: Redberry introduced a new product "Red One Automated Bioburden Detection" for instantaneous bioburden detection.
Future Outlook for Biosafety Testing Services Industry Market
The Biosafety Testing Services market is poised for sustained growth, driven by technological innovation, increasing regulatory scrutiny, and the expanding biopharmaceutical industry. Strategic partnerships, acquisitions, and investments in R&D will further shape market dynamics. The focus on developing faster, more accurate, and cost-effective testing methods will continue to drive market expansion, creating opportunities for both established players and emerging companies.
Biosafety Testing Services Industry Segmentation
-
1. Product
- 1.1. Reagents and Kits
- 1.2. Instruments
- 1.3. Other Products
-
2. Application
- 2.1. Vaccines and Therapeutics
- 2.2. Cellular and Gene Therapy
- 2.3. Blood and Blood-based Therapy
- 2.4. Other Applications
-
3. Test
- 3.1. Sterility Tests
- 3.2. Bioburden Tests
- 3.3. Endotoxin Tests
- 3.4. Other Tests
Biosafety Testing Services Industry Segmentation By Geography
-
1. North America
- 1.1. United States
- 1.2. Canada
- 1.3. Mexico
-
2. Europe
- 2.1. Germany
- 2.2. United Kingdom
- 2.3. France
- 2.4. Italy
- 2.5. Spain
- 2.6. Rest of Europe
-
3. Asia Pacific
- 3.1. China
- 3.2. Japan
- 3.3. India
- 3.4. Australia
- 3.5. South Korea
- 3.6. Rest of Asia Pacific
-
4. Middle East and Africa
- 4.1. GCC
- 4.2. South Africa
- 4.3. Rest of Middle East and Africa
-
5. South America
- 5.1. Brazil
- 5.2. Argentina
- 5.3. Rest of South America
Biosafety Testing Services Industry Regional Market Share
Geographic Coverage of Biosafety Testing Services Industry
Biosafety Testing Services Industry REPORT HIGHLIGHTS
| Aspects | Details |
|---|---|
| Study Period | 2020-2034 |
| Base Year | 2025 |
| Estimated Year | 2026 |
| Forecast Period | 2026-2034 |
| Historical Period | 2020-2025 |
| Growth Rate | CAGR of 10.69% from 2020-2034 |
| Segmentation |
|
Table of Contents
- 1. Introduction
- 1.1. Research Scope
- 1.2. Market Segmentation
- 1.3. Research Objective
- 1.4. Definitions and Assumptions
- 2. Executive Summary
- 2.1. Market Snapshot
- 3. Market Dynamics
- 3.1. Market Drivers
- 3.2. Market Restrains
- 3.3. Market Trends
- 3.4. Market Opportunities
- 4. Market Factor Analysis
- 4.1. Porters Five Forces
- 4.1.1. Bargaining Power of Suppliers
- 4.1.2. Bargaining Power of Buyers
- 4.1.3. Threat of New Entrants
- 4.1.4. Threat of Substitutes
- 4.1.5. Competitive Rivalry
- 4.2. PESTEL analysis
- 4.3. BCG Analysis
- 4.3.1. Stars (High Growth, High Market Share)
- 4.3.2. Cash Cows (Low Growth, High Market Share)
- 4.3.3. Question Mark (High Growth, Low Market Share)
- 4.3.4. Dogs (Low Growth, Low Market Share)
- 4.4. Ansoff Matrix Analysis
- 4.5. Supply Chain Analysis
- 4.6. Regulatory Landscape
- 4.7. Current Market Potential and Opportunity Assessment (TAM–SAM–SOM Framework)
- 4.8. PRI Analyst Note
- 4.1. Porters Five Forces
- 5. Market Analysis, Insights and Forecast 2021-2033
- 5.1. Market Analysis, Insights and Forecast - by Product
- 5.1.1. Reagents and Kits
- 5.1.2. Instruments
- 5.1.3. Other Products
- 5.2. Market Analysis, Insights and Forecast - by Application
- 5.2.1. Vaccines and Therapeutics
- 5.2.2. Cellular and Gene Therapy
- 5.2.3. Blood and Blood-based Therapy
- 5.2.4. Other Applications
- 5.3. Market Analysis, Insights and Forecast - by Test
- 5.3.1. Sterility Tests
- 5.3.2. Bioburden Tests
- 5.3.3. Endotoxin Tests
- 5.3.4. Other Tests
- 5.4. Market Analysis, Insights and Forecast - by Region
- 5.4.1. North America
- 5.4.2. Europe
- 5.4.3. Asia Pacific
- 5.4.4. Middle East and Africa
- 5.4.5. South America
- 5.1. Market Analysis, Insights and Forecast - by Product
- 6. Global Biosafety Testing Services Industry Analysis, Insights and Forecast, 2021-2033
- 6.1. Market Analysis, Insights and Forecast - by Product
- 6.1.1. Reagents and Kits
- 6.1.2. Instruments
- 6.1.3. Other Products
- 6.2. Market Analysis, Insights and Forecast - by Application
- 6.2.1. Vaccines and Therapeutics
- 6.2.2. Cellular and Gene Therapy
- 6.2.3. Blood and Blood-based Therapy
- 6.2.4. Other Applications
- 6.3. Market Analysis, Insights and Forecast - by Test
- 6.3.1. Sterility Tests
- 6.3.2. Bioburden Tests
- 6.3.3. Endotoxin Tests
- 6.3.4. Other Tests
- 6.1. Market Analysis, Insights and Forecast - by Product
- 7. North America Biosafety Testing Services Industry Analysis, Insights and Forecast, 2020-2032
- 7.1. Market Analysis, Insights and Forecast - by Product
- 7.1.1. Reagents and Kits
- 7.1.2. Instruments
- 7.1.3. Other Products
- 7.2. Market Analysis, Insights and Forecast - by Application
- 7.2.1. Vaccines and Therapeutics
- 7.2.2. Cellular and Gene Therapy
- 7.2.3. Blood and Blood-based Therapy
- 7.2.4. Other Applications
- 7.3. Market Analysis, Insights and Forecast - by Test
- 7.3.1. Sterility Tests
- 7.3.2. Bioburden Tests
- 7.3.3. Endotoxin Tests
- 7.3.4. Other Tests
- 7.1. Market Analysis, Insights and Forecast - by Product
- 8. Europe Biosafety Testing Services Industry Analysis, Insights and Forecast, 2020-2032
- 8.1. Market Analysis, Insights and Forecast - by Product
- 8.1.1. Reagents and Kits
- 8.1.2. Instruments
- 8.1.3. Other Products
- 8.2. Market Analysis, Insights and Forecast - by Application
- 8.2.1. Vaccines and Therapeutics
- 8.2.2. Cellular and Gene Therapy
- 8.2.3. Blood and Blood-based Therapy
- 8.2.4. Other Applications
- 8.3. Market Analysis, Insights and Forecast - by Test
- 8.3.1. Sterility Tests
- 8.3.2. Bioburden Tests
- 8.3.3. Endotoxin Tests
- 8.3.4. Other Tests
- 8.1. Market Analysis, Insights and Forecast - by Product
- 9. Asia Pacific Biosafety Testing Services Industry Analysis, Insights and Forecast, 2020-2032
- 9.1. Market Analysis, Insights and Forecast - by Product
- 9.1.1. Reagents and Kits
- 9.1.2. Instruments
- 9.1.3. Other Products
- 9.2. Market Analysis, Insights and Forecast - by Application
- 9.2.1. Vaccines and Therapeutics
- 9.2.2. Cellular and Gene Therapy
- 9.2.3. Blood and Blood-based Therapy
- 9.2.4. Other Applications
- 9.3. Market Analysis, Insights and Forecast - by Test
- 9.3.1. Sterility Tests
- 9.3.2. Bioburden Tests
- 9.3.3. Endotoxin Tests
- 9.3.4. Other Tests
- 9.1. Market Analysis, Insights and Forecast - by Product
- 10. Middle East and Africa Biosafety Testing Services Industry Analysis, Insights and Forecast, 2020-2032
- 10.1. Market Analysis, Insights and Forecast - by Product
- 10.1.1. Reagents and Kits
- 10.1.2. Instruments
- 10.1.3. Other Products
- 10.2. Market Analysis, Insights and Forecast - by Application
- 10.2.1. Vaccines and Therapeutics
- 10.2.2. Cellular and Gene Therapy
- 10.2.3. Blood and Blood-based Therapy
- 10.2.4. Other Applications
- 10.3. Market Analysis, Insights and Forecast - by Test
- 10.3.1. Sterility Tests
- 10.3.2. Bioburden Tests
- 10.3.3. Endotoxin Tests
- 10.3.4. Other Tests
- 10.1. Market Analysis, Insights and Forecast - by Product
- 11. South America Biosafety Testing Services Industry Analysis, Insights and Forecast, 2020-2032
- 11.1. Market Analysis, Insights and Forecast - by Product
- 11.1.1. Reagents and Kits
- 11.1.2. Instruments
- 11.1.3. Other Products
- 11.2. Market Analysis, Insights and Forecast - by Application
- 11.2.1. Vaccines and Therapeutics
- 11.2.2. Cellular and Gene Therapy
- 11.2.3. Blood and Blood-based Therapy
- 11.2.4. Other Applications
- 11.3. Market Analysis, Insights and Forecast - by Test
- 11.3.1. Sterility Tests
- 11.3.2. Bioburden Tests
- 11.3.3. Endotoxin Tests
- 11.3.4. Other Tests
- 11.1. Market Analysis, Insights and Forecast - by Product
- 12. Competitive Analysis
- 12.1. Company Profiles
- 12.1.1 Promega Corporation
- 12.1.1.1. Company Overview
- 12.1.1.2. Products
- 12.1.1.3. Company Financials
- 12.1.1.4. SWOT Analysis
- 12.1.2 Merck KGaA
- 12.1.2.1. Company Overview
- 12.1.2.2. Products
- 12.1.2.3. Company Financials
- 12.1.2.4. SWOT Analysis
- 12.1.3 Toxikon
- 12.1.3.1. Company Overview
- 12.1.3.2. Products
- 12.1.3.3. Company Financials
- 12.1.3.4. SWOT Analysis
- 12.1.4 Eurofins Scientific
- 12.1.4.1. Company Overview
- 12.1.4.2. Products
- 12.1.4.3. Company Financials
- 12.1.4.4. SWOT Analysis
- 12.1.5 Biomerieux SA
- 12.1.5.1. Company Overview
- 12.1.5.2. Products
- 12.1.5.3. Company Financials
- 12.1.5.4. SWOT Analysis
- 12.1.6 Cytovance Biologics
- 12.1.6.1. Company Overview
- 12.1.6.2. Products
- 12.1.6.3. Company Financials
- 12.1.6.4. SWOT Analysis
- 12.1.7 WuXi AppTec
- 12.1.7.1. Company Overview
- 12.1.7.2. Products
- 12.1.7.3. Company Financials
- 12.1.7.4. SWOT Analysis
- 12.1.8 Lonza
- 12.1.8.1. Company Overview
- 12.1.8.2. Products
- 12.1.8.3. Company Financials
- 12.1.8.4. SWOT Analysis
- 12.1.9 Avance Biosciences
- 12.1.9.1. Company Overview
- 12.1.9.2. Products
- 12.1.9.3. Company Financials
- 12.1.9.4. SWOT Analysis
- 12.1.10 Thermo Fisher Scientific
- 12.1.10.1. Company Overview
- 12.1.10.2. Products
- 12.1.10.3. Company Financials
- 12.1.10.4. SWOT Analysis
- 12.1.1 Promega Corporation
- 12.2. Market Entropy
- 12.2.1 Company's Key Areas Served
- 12.2.2 Recent Developments
- 12.3. Company Market Share Analysis 2025
- 12.3.1 Top 5 Companies Market Share Analysis
- 12.3.2 Top 3 Companies Market Share Analysis
- 12.4. List of Potential Customers
- 13. Research Methodology
List of Figures
- Figure 1: Global Biosafety Testing Services Industry Revenue Breakdown (billion, %) by Region 2025 & 2033
- Figure 2: Global Biosafety Testing Services Industry Volume Breakdown (K Unit, %) by Region 2025 & 2033
- Figure 3: North America Biosafety Testing Services Industry Revenue (billion), by Product 2025 & 2033
- Figure 4: North America Biosafety Testing Services Industry Volume (K Unit), by Product 2025 & 2033
- Figure 5: North America Biosafety Testing Services Industry Revenue Share (%), by Product 2025 & 2033
- Figure 6: North America Biosafety Testing Services Industry Volume Share (%), by Product 2025 & 2033
- Figure 7: North America Biosafety Testing Services Industry Revenue (billion), by Application 2025 & 2033
- Figure 8: North America Biosafety Testing Services Industry Volume (K Unit), by Application 2025 & 2033
- Figure 9: North America Biosafety Testing Services Industry Revenue Share (%), by Application 2025 & 2033
- Figure 10: North America Biosafety Testing Services Industry Volume Share (%), by Application 2025 & 2033
- Figure 11: North America Biosafety Testing Services Industry Revenue (billion), by Test 2025 & 2033
- Figure 12: North America Biosafety Testing Services Industry Volume (K Unit), by Test 2025 & 2033
- Figure 13: North America Biosafety Testing Services Industry Revenue Share (%), by Test 2025 & 2033
- Figure 14: North America Biosafety Testing Services Industry Volume Share (%), by Test 2025 & 2033
- Figure 15: North America Biosafety Testing Services Industry Revenue (billion), by Country 2025 & 2033
- Figure 16: North America Biosafety Testing Services Industry Volume (K Unit), by Country 2025 & 2033
- Figure 17: North America Biosafety Testing Services Industry Revenue Share (%), by Country 2025 & 2033
- Figure 18: North America Biosafety Testing Services Industry Volume Share (%), by Country 2025 & 2033
- Figure 19: Europe Biosafety Testing Services Industry Revenue (billion), by Product 2025 & 2033
- Figure 20: Europe Biosafety Testing Services Industry Volume (K Unit), by Product 2025 & 2033
- Figure 21: Europe Biosafety Testing Services Industry Revenue Share (%), by Product 2025 & 2033
- Figure 22: Europe Biosafety Testing Services Industry Volume Share (%), by Product 2025 & 2033
- Figure 23: Europe Biosafety Testing Services Industry Revenue (billion), by Application 2025 & 2033
- Figure 24: Europe Biosafety Testing Services Industry Volume (K Unit), by Application 2025 & 2033
- Figure 25: Europe Biosafety Testing Services Industry Revenue Share (%), by Application 2025 & 2033
- Figure 26: Europe Biosafety Testing Services Industry Volume Share (%), by Application 2025 & 2033
- Figure 27: Europe Biosafety Testing Services Industry Revenue (billion), by Test 2025 & 2033
- Figure 28: Europe Biosafety Testing Services Industry Volume (K Unit), by Test 2025 & 2033
- Figure 29: Europe Biosafety Testing Services Industry Revenue Share (%), by Test 2025 & 2033
- Figure 30: Europe Biosafety Testing Services Industry Volume Share (%), by Test 2025 & 2033
- Figure 31: Europe Biosafety Testing Services Industry Revenue (billion), by Country 2025 & 2033
- Figure 32: Europe Biosafety Testing Services Industry Volume (K Unit), by Country 2025 & 2033
- Figure 33: Europe Biosafety Testing Services Industry Revenue Share (%), by Country 2025 & 2033
- Figure 34: Europe Biosafety Testing Services Industry Volume Share (%), by Country 2025 & 2033
- Figure 35: Asia Pacific Biosafety Testing Services Industry Revenue (billion), by Product 2025 & 2033
- Figure 36: Asia Pacific Biosafety Testing Services Industry Volume (K Unit), by Product 2025 & 2033
- Figure 37: Asia Pacific Biosafety Testing Services Industry Revenue Share (%), by Product 2025 & 2033
- Figure 38: Asia Pacific Biosafety Testing Services Industry Volume Share (%), by Product 2025 & 2033
- Figure 39: Asia Pacific Biosafety Testing Services Industry Revenue (billion), by Application 2025 & 2033
- Figure 40: Asia Pacific Biosafety Testing Services Industry Volume (K Unit), by Application 2025 & 2033
- Figure 41: Asia Pacific Biosafety Testing Services Industry Revenue Share (%), by Application 2025 & 2033
- Figure 42: Asia Pacific Biosafety Testing Services Industry Volume Share (%), by Application 2025 & 2033
- Figure 43: Asia Pacific Biosafety Testing Services Industry Revenue (billion), by Test 2025 & 2033
- Figure 44: Asia Pacific Biosafety Testing Services Industry Volume (K Unit), by Test 2025 & 2033
- Figure 45: Asia Pacific Biosafety Testing Services Industry Revenue Share (%), by Test 2025 & 2033
- Figure 46: Asia Pacific Biosafety Testing Services Industry Volume Share (%), by Test 2025 & 2033
- Figure 47: Asia Pacific Biosafety Testing Services Industry Revenue (billion), by Country 2025 & 2033
- Figure 48: Asia Pacific Biosafety Testing Services Industry Volume (K Unit), by Country 2025 & 2033
- Figure 49: Asia Pacific Biosafety Testing Services Industry Revenue Share (%), by Country 2025 & 2033
- Figure 50: Asia Pacific Biosafety Testing Services Industry Volume Share (%), by Country 2025 & 2033
- Figure 51: Middle East and Africa Biosafety Testing Services Industry Revenue (billion), by Product 2025 & 2033
- Figure 52: Middle East and Africa Biosafety Testing Services Industry Volume (K Unit), by Product 2025 & 2033
- Figure 53: Middle East and Africa Biosafety Testing Services Industry Revenue Share (%), by Product 2025 & 2033
- Figure 54: Middle East and Africa Biosafety Testing Services Industry Volume Share (%), by Product 2025 & 2033
- Figure 55: Middle East and Africa Biosafety Testing Services Industry Revenue (billion), by Application 2025 & 2033
- Figure 56: Middle East and Africa Biosafety Testing Services Industry Volume (K Unit), by Application 2025 & 2033
- Figure 57: Middle East and Africa Biosafety Testing Services Industry Revenue Share (%), by Application 2025 & 2033
- Figure 58: Middle East and Africa Biosafety Testing Services Industry Volume Share (%), by Application 2025 & 2033
- Figure 59: Middle East and Africa Biosafety Testing Services Industry Revenue (billion), by Test 2025 & 2033
- Figure 60: Middle East and Africa Biosafety Testing Services Industry Volume (K Unit), by Test 2025 & 2033
- Figure 61: Middle East and Africa Biosafety Testing Services Industry Revenue Share (%), by Test 2025 & 2033
- Figure 62: Middle East and Africa Biosafety Testing Services Industry Volume Share (%), by Test 2025 & 2033
- Figure 63: Middle East and Africa Biosafety Testing Services Industry Revenue (billion), by Country 2025 & 2033
- Figure 64: Middle East and Africa Biosafety Testing Services Industry Volume (K Unit), by Country 2025 & 2033
- Figure 65: Middle East and Africa Biosafety Testing Services Industry Revenue Share (%), by Country 2025 & 2033
- Figure 66: Middle East and Africa Biosafety Testing Services Industry Volume Share (%), by Country 2025 & 2033
- Figure 67: South America Biosafety Testing Services Industry Revenue (billion), by Product 2025 & 2033
- Figure 68: South America Biosafety Testing Services Industry Volume (K Unit), by Product 2025 & 2033
- Figure 69: South America Biosafety Testing Services Industry Revenue Share (%), by Product 2025 & 2033
- Figure 70: South America Biosafety Testing Services Industry Volume Share (%), by Product 2025 & 2033
- Figure 71: South America Biosafety Testing Services Industry Revenue (billion), by Application 2025 & 2033
- Figure 72: South America Biosafety Testing Services Industry Volume (K Unit), by Application 2025 & 2033
- Figure 73: South America Biosafety Testing Services Industry Revenue Share (%), by Application 2025 & 2033
- Figure 74: South America Biosafety Testing Services Industry Volume Share (%), by Application 2025 & 2033
- Figure 75: South America Biosafety Testing Services Industry Revenue (billion), by Test 2025 & 2033
- Figure 76: South America Biosafety Testing Services Industry Volume (K Unit), by Test 2025 & 2033
- Figure 77: South America Biosafety Testing Services Industry Revenue Share (%), by Test 2025 & 2033
- Figure 78: South America Biosafety Testing Services Industry Volume Share (%), by Test 2025 & 2033
- Figure 79: South America Biosafety Testing Services Industry Revenue (billion), by Country 2025 & 2033
- Figure 80: South America Biosafety Testing Services Industry Volume (K Unit), by Country 2025 & 2033
- Figure 81: South America Biosafety Testing Services Industry Revenue Share (%), by Country 2025 & 2033
- Figure 82: South America Biosafety Testing Services Industry Volume Share (%), by Country 2025 & 2033
List of Tables
- Table 1: Global Biosafety Testing Services Industry Revenue billion Forecast, by Product 2020 & 2033
- Table 2: Global Biosafety Testing Services Industry Volume K Unit Forecast, by Product 2020 & 2033
- Table 3: Global Biosafety Testing Services Industry Revenue billion Forecast, by Application 2020 & 2033
- Table 4: Global Biosafety Testing Services Industry Volume K Unit Forecast, by Application 2020 & 2033
- Table 5: Global Biosafety Testing Services Industry Revenue billion Forecast, by Test 2020 & 2033
- Table 6: Global Biosafety Testing Services Industry Volume K Unit Forecast, by Test 2020 & 2033
- Table 7: Global Biosafety Testing Services Industry Revenue billion Forecast, by Region 2020 & 2033
- Table 8: Global Biosafety Testing Services Industry Volume K Unit Forecast, by Region 2020 & 2033
- Table 9: Global Biosafety Testing Services Industry Revenue billion Forecast, by Product 2020 & 2033
- Table 10: Global Biosafety Testing Services Industry Volume K Unit Forecast, by Product 2020 & 2033
- Table 11: Global Biosafety Testing Services Industry Revenue billion Forecast, by Application 2020 & 2033
- Table 12: Global Biosafety Testing Services Industry Volume K Unit Forecast, by Application 2020 & 2033
- Table 13: Global Biosafety Testing Services Industry Revenue billion Forecast, by Test 2020 & 2033
- Table 14: Global Biosafety Testing Services Industry Volume K Unit Forecast, by Test 2020 & 2033
- Table 15: Global Biosafety Testing Services Industry Revenue billion Forecast, by Country 2020 & 2033
- Table 16: Global Biosafety Testing Services Industry Volume K Unit Forecast, by Country 2020 & 2033
- Table 17: United States Biosafety Testing Services Industry Revenue (billion) Forecast, by Application 2020 & 2033
- Table 18: United States Biosafety Testing Services Industry Volume (K Unit) Forecast, by Application 2020 & 2033
- Table 19: Canada Biosafety Testing Services Industry Revenue (billion) Forecast, by Application 2020 & 2033
- Table 20: Canada Biosafety Testing Services Industry Volume (K Unit) Forecast, by Application 2020 & 2033
- Table 21: Mexico Biosafety Testing Services Industry Revenue (billion) Forecast, by Application 2020 & 2033
- Table 22: Mexico Biosafety Testing Services Industry Volume (K Unit) Forecast, by Application 2020 & 2033
- Table 23: Global Biosafety Testing Services Industry Revenue billion Forecast, by Product 2020 & 2033
- Table 24: Global Biosafety Testing Services Industry Volume K Unit Forecast, by Product 2020 & 2033
- Table 25: Global Biosafety Testing Services Industry Revenue billion Forecast, by Application 2020 & 2033
- Table 26: Global Biosafety Testing Services Industry Volume K Unit Forecast, by Application 2020 & 2033
- Table 27: Global Biosafety Testing Services Industry Revenue billion Forecast, by Test 2020 & 2033
- Table 28: Global Biosafety Testing Services Industry Volume K Unit Forecast, by Test 2020 & 2033
- Table 29: Global Biosafety Testing Services Industry Revenue billion Forecast, by Country 2020 & 2033
- Table 30: Global Biosafety Testing Services Industry Volume K Unit Forecast, by Country 2020 & 2033
- Table 31: Germany Biosafety Testing Services Industry Revenue (billion) Forecast, by Application 2020 & 2033
- Table 32: Germany Biosafety Testing Services Industry Volume (K Unit) Forecast, by Application 2020 & 2033
- Table 33: United Kingdom Biosafety Testing Services Industry Revenue (billion) Forecast, by Application 2020 & 2033
- Table 34: United Kingdom Biosafety Testing Services Industry Volume (K Unit) Forecast, by Application 2020 & 2033
- Table 35: France Biosafety Testing Services Industry Revenue (billion) Forecast, by Application 2020 & 2033
- Table 36: France Biosafety Testing Services Industry Volume (K Unit) Forecast, by Application 2020 & 2033
- Table 37: Italy Biosafety Testing Services Industry Revenue (billion) Forecast, by Application 2020 & 2033
- Table 38: Italy Biosafety Testing Services Industry Volume (K Unit) Forecast, by Application 2020 & 2033
- Table 39: Spain Biosafety Testing Services Industry Revenue (billion) Forecast, by Application 2020 & 2033
- Table 40: Spain Biosafety Testing Services Industry Volume (K Unit) Forecast, by Application 2020 & 2033
- Table 41: Rest of Europe Biosafety Testing Services Industry Revenue (billion) Forecast, by Application 2020 & 2033
- Table 42: Rest of Europe Biosafety Testing Services Industry Volume (K Unit) Forecast, by Application 2020 & 2033
- Table 43: Global Biosafety Testing Services Industry Revenue billion Forecast, by Product 2020 & 2033
- Table 44: Global Biosafety Testing Services Industry Volume K Unit Forecast, by Product 2020 & 2033
- Table 45: Global Biosafety Testing Services Industry Revenue billion Forecast, by Application 2020 & 2033
- Table 46: Global Biosafety Testing Services Industry Volume K Unit Forecast, by Application 2020 & 2033
- Table 47: Global Biosafety Testing Services Industry Revenue billion Forecast, by Test 2020 & 2033
- Table 48: Global Biosafety Testing Services Industry Volume K Unit Forecast, by Test 2020 & 2033
- Table 49: Global Biosafety Testing Services Industry Revenue billion Forecast, by Country 2020 & 2033
- Table 50: Global Biosafety Testing Services Industry Volume K Unit Forecast, by Country 2020 & 2033
- Table 51: China Biosafety Testing Services Industry Revenue (billion) Forecast, by Application 2020 & 2033
- Table 52: China Biosafety Testing Services Industry Volume (K Unit) Forecast, by Application 2020 & 2033
- Table 53: Japan Biosafety Testing Services Industry Revenue (billion) Forecast, by Application 2020 & 2033
- Table 54: Japan Biosafety Testing Services Industry Volume (K Unit) Forecast, by Application 2020 & 2033
- Table 55: India Biosafety Testing Services Industry Revenue (billion) Forecast, by Application 2020 & 2033
- Table 56: India Biosafety Testing Services Industry Volume (K Unit) Forecast, by Application 2020 & 2033
- Table 57: Australia Biosafety Testing Services Industry Revenue (billion) Forecast, by Application 2020 & 2033
- Table 58: Australia Biosafety Testing Services Industry Volume (K Unit) Forecast, by Application 2020 & 2033
- Table 59: South Korea Biosafety Testing Services Industry Revenue (billion) Forecast, by Application 2020 & 2033
- Table 60: South Korea Biosafety Testing Services Industry Volume (K Unit) Forecast, by Application 2020 & 2033
- Table 61: Rest of Asia Pacific Biosafety Testing Services Industry Revenue (billion) Forecast, by Application 2020 & 2033
- Table 62: Rest of Asia Pacific Biosafety Testing Services Industry Volume (K Unit) Forecast, by Application 2020 & 2033
- Table 63: Global Biosafety Testing Services Industry Revenue billion Forecast, by Product 2020 & 2033
- Table 64: Global Biosafety Testing Services Industry Volume K Unit Forecast, by Product 2020 & 2033
- Table 65: Global Biosafety Testing Services Industry Revenue billion Forecast, by Application 2020 & 2033
- Table 66: Global Biosafety Testing Services Industry Volume K Unit Forecast, by Application 2020 & 2033
- Table 67: Global Biosafety Testing Services Industry Revenue billion Forecast, by Test 2020 & 2033
- Table 68: Global Biosafety Testing Services Industry Volume K Unit Forecast, by Test 2020 & 2033
- Table 69: Global Biosafety Testing Services Industry Revenue billion Forecast, by Country 2020 & 2033
- Table 70: Global Biosafety Testing Services Industry Volume K Unit Forecast, by Country 2020 & 2033
- Table 71: GCC Biosafety Testing Services Industry Revenue (billion) Forecast, by Application 2020 & 2033
- Table 72: GCC Biosafety Testing Services Industry Volume (K Unit) Forecast, by Application 2020 & 2033
- Table 73: South Africa Biosafety Testing Services Industry Revenue (billion) Forecast, by Application 2020 & 2033
- Table 74: South Africa Biosafety Testing Services Industry Volume (K Unit) Forecast, by Application 2020 & 2033
- Table 75: Rest of Middle East and Africa Biosafety Testing Services Industry Revenue (billion) Forecast, by Application 2020 & 2033
- Table 76: Rest of Middle East and Africa Biosafety Testing Services Industry Volume (K Unit) Forecast, by Application 2020 & 2033
- Table 77: Global Biosafety Testing Services Industry Revenue billion Forecast, by Product 2020 & 2033
- Table 78: Global Biosafety Testing Services Industry Volume K Unit Forecast, by Product 2020 & 2033
- Table 79: Global Biosafety Testing Services Industry Revenue billion Forecast, by Application 2020 & 2033
- Table 80: Global Biosafety Testing Services Industry Volume K Unit Forecast, by Application 2020 & 2033
- Table 81: Global Biosafety Testing Services Industry Revenue billion Forecast, by Test 2020 & 2033
- Table 82: Global Biosafety Testing Services Industry Volume K Unit Forecast, by Test 2020 & 2033
- Table 83: Global Biosafety Testing Services Industry Revenue billion Forecast, by Country 2020 & 2033
- Table 84: Global Biosafety Testing Services Industry Volume K Unit Forecast, by Country 2020 & 2033
- Table 85: Brazil Biosafety Testing Services Industry Revenue (billion) Forecast, by Application 2020 & 2033
- Table 86: Brazil Biosafety Testing Services Industry Volume (K Unit) Forecast, by Application 2020 & 2033
- Table 87: Argentina Biosafety Testing Services Industry Revenue (billion) Forecast, by Application 2020 & 2033
- Table 88: Argentina Biosafety Testing Services Industry Volume (K Unit) Forecast, by Application 2020 & 2033
- Table 89: Rest of South America Biosafety Testing Services Industry Revenue (billion) Forecast, by Application 2020 & 2033
- Table 90: Rest of South America Biosafety Testing Services Industry Volume (K Unit) Forecast, by Application 2020 & 2033
Frequently Asked Questions
1. What is the projected Compound Annual Growth Rate (CAGR) of the Biosafety Testing Services Industry?
The projected CAGR is approximately 10.69%.
2. Which companies are prominent players in the Biosafety Testing Services Industry?
Key companies in the market include Promega Corporation, Merck KGaA, Toxikon, Eurofins Scientific, Biomerieux SA, Cytovance Biologics, WuXi AppTec, Lonza, Avance Biosciences, Thermo Fisher Scientific.
3. What are the main segments of the Biosafety Testing Services Industry?
The market segments include Product, Application, Test.
4. Can you provide details about the market size?
The market size is estimated to be USD 5.38 billion as of 2022.
5. What are some drivers contributing to market growth?
Growth in the Pharmaceutical and Biotechnology Industries. along with Increasing Investments; Rising Production of New Biologics due to High Disease Burden.
6. What are the notable trends driving market growth?
Bioburden Testing Segment is Expected to Hold Significant Share in the Test Segment of the Market Over the Forecast Period.
7. Are there any restraints impacting market growth?
Time Consuming Approval Process.
8. Can you provide examples of recent developments in the market?
In April 2021, Lonza expanded its product ''PyroTec PRO Automated Robotic Solution'' for endotoxin testing. It is compatible with the company's product PYROGENT-5000 Turbidimetric LAL (Limulus Amebocyte Lysate) Assay, Kinetic-QCL Chromogenic LAL Assay, and the PyroGene rFC Assay.
9. What pricing options are available for accessing the report?
Pricing options include single-user, multi-user, and enterprise licenses priced at USD 4750, USD 5250, and USD 8750 respectively.
10. Is the market size provided in terms of value or volume?
The market size is provided in terms of value, measured in billion and volume, measured in K Unit.
11. Are there any specific market keywords associated with the report?
Yes, the market keyword associated with the report is "Biosafety Testing Services Industry," which aids in identifying and referencing the specific market segment covered.
12. How do I determine which pricing option suits my needs best?
The pricing options vary based on user requirements and access needs. Individual users may opt for single-user licenses, while businesses requiring broader access may choose multi-user or enterprise licenses for cost-effective access to the report.
13. Are there any additional resources or data provided in the Biosafety Testing Services Industry report?
While the report offers comprehensive insights, it's advisable to review the specific contents or supplementary materials provided to ascertain if additional resources or data are available.
14. How can I stay updated on further developments or reports in the Biosafety Testing Services Industry?
To stay informed about further developments, trends, and reports in the Biosafety Testing Services Industry, consider subscribing to industry newsletters, following relevant companies and organizations, or regularly checking reputable industry news sources and publications.
Methodology
Step 1 - Identification of Relevant Samples Size from Population Database


Step 2 - Approaches for Defining Global Market Size (Value, Volume* & Price*)

Note*: In applicable scenarios
Step 3 - Data Sources
Primary Research
- Web Analytics
- Survey Reports
- Research Institute
- Latest Research Reports
- Opinion Leaders
Secondary Research
- Annual Reports
- White Paper
- Latest Press Release
- Industry Association
- Paid Database
- Investor Presentations

Step 4 - Data Triangulation
Involves using different sources of information in order to increase the validity of a study
These sources are likely to be stakeholders in a program - participants, other researchers, program staff, other community members, and so on.
Then we put all data in single framework & apply various statistical tools to find out the dynamic on the market.
During the analysis stage, feedback from the stakeholder groups would be compared to determine areas of agreement as well as areas of divergence