

Key Insights
The global bleaching clay market is projected for significant expansion, expected to reach approximately $1.7 billion by 2025, with a Compound Annual Growth Rate (CAGR) of 5.5% through 2033. This growth is primarily fueled by escalating demand for refined vegetable oils and animal fats within the food and beverage sector. The increasing consumer preference for natural and sustainable ingredients in cosmetics and personal care products also contributes to market expansion. Furthermore, the global rise in processed food consumption directly drives the need for high-quality bleached oils. Activated bauxite and activated clays are the dominant product segments, while industrial oil processing represents the largest application. The Asia-Pacific region, led by China and India, holds a substantial market share due to significant processed food and industrial goods production and consumption. However, challenges such as fluctuating raw material prices and stringent environmental regulations may impede growth. The competitive landscape features established multinational corporations and regional players, fostering innovation in product development and sustainable sourcing. Emerging applications in the chemical industry and the expansion of end-user industries are anticipated to drive future market growth.
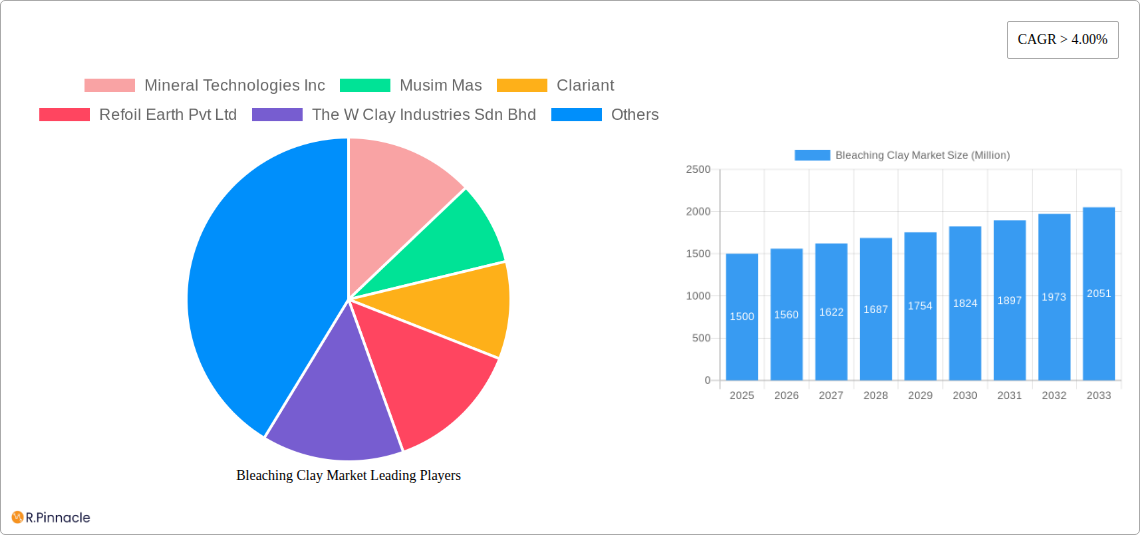
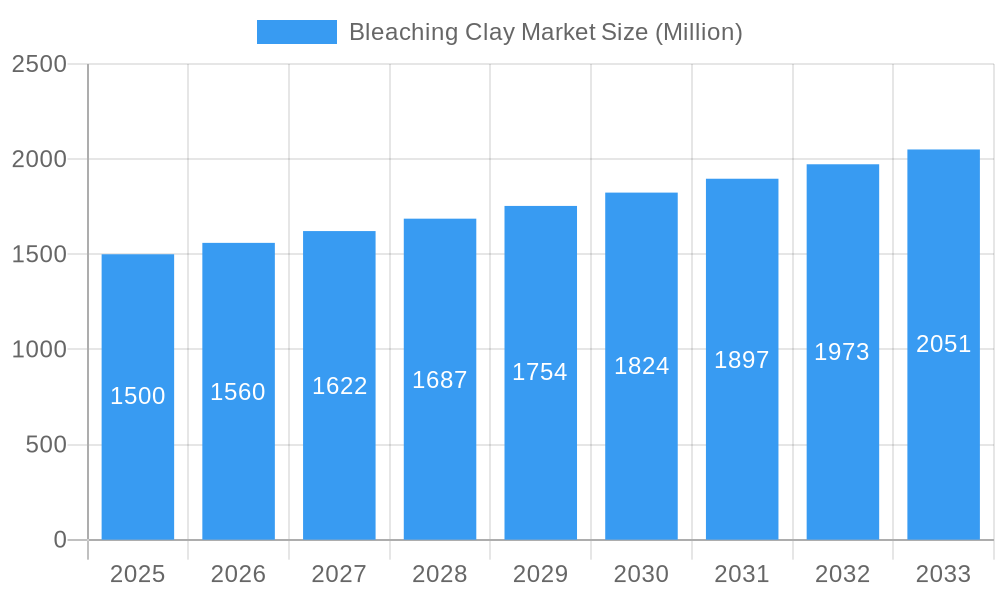
Bleaching Clay Market Market Size (In Billion)
The extensive utility of bleaching clay across food processing, cosmetics, and pharmaceuticals presents considerable market expansion opportunities. Nevertheless, the market confronts challenges stemming from volatile raw material costs and the imperative for eco-friendly processing methodologies. Technological advancements in clay refinement and processing are poised to enhance efficiency and sustainability, thereby shaping the future trajectory of the bleaching clay industry. Regional regulatory variations and distinct consumer preferences will influence market dynamics, especially in burgeoning economies exhibiting the highest demand. Intense competition among established and emerging players will continue to mold the market landscape, necessitating adaptability and innovation for enduring success. The growing emphasis on sustainability and environmentally benign alternatives may mandate the adoption of cleaner production processes and the development of biodegradable substitutes.
Bleaching Clay Market Company Market Share
Bleaching Clay Market: A Comprehensive Report (2019-2033)
This comprehensive report provides a detailed analysis of the Bleaching Clay market, offering invaluable insights for industry professionals, investors, and stakeholders. With a study period spanning 2019-2033, a base year of 2025, and a forecast period of 2025-2033, this report offers a thorough understanding of past performance, current dynamics, and future projections. The market size is expected to reach xx Million by 2033, exhibiting a CAGR of xx% during the forecast period.
Bleaching Clay Market Market Structure & Innovation Trends
This section analyzes the competitive landscape of the Bleaching Clay market, encompassing market concentration, innovation drivers, regulatory frameworks, product substitutes, end-user demographics, and mergers & acquisitions (M&A) activities.
The market exhibits a moderately concentrated structure, with key players such as Mineral Technologies Inc, Musim Mas, Clariant, and EP Minerals holding significant market share. However, several smaller players also contribute to the market dynamics. Precise market share figures for each company are detailed within the full report.
- Innovation Drivers: The demand for high-quality, efficient bleaching agents drives innovation in clay processing and modification techniques. Sustainable and environmentally friendly bleaching solutions are gaining prominence.
- Regulatory Frameworks: Government regulations regarding the use of bleaching agents in various industries, particularly in food and cosmetics, significantly influence market growth. Stringent quality and safety standards impact product development and market access.
- Product Substitutes: Synthetic bleaching agents pose competitive pressure; however, the natural and sustainable nature of bleaching clay continues to be a key selling point.
- End-User Demographics: The growing demand for processed foods, cosmetics, and pharmaceuticals fuels the market's expansion across diverse end-user industries.
- M&A Activities: The past five years have seen xx Million in M&A activity within the bleaching clay sector, primarily focused on expanding production capacity and market reach. The full report details specific deals and their impacts.
Bleaching Clay Market Market Dynamics & Trends
This section delves into the market dynamics and trends influencing the Bleaching Clay market's growth trajectory. It includes an in-depth analysis of growth drivers, technological disruptions, consumer preferences, and competitive dynamics, providing a comprehensive overview of the market's evolution. The market is experiencing robust growth, driven by increasing demand from various sectors and advancements in bleaching clay technology. Specific CAGR and penetration rate data for each segment are included within the full report.
Several factors contribute to this positive trend. The rising global demand for processed foods, driven by changing lifestyles and urbanization, has significantly increased the need for efficient bleaching agents. Moreover, the growing cosmetic and personal care industry is fueling demand for high-quality bleaching clays. Technological advancements, particularly in clay refinement and processing, are further enhancing the efficiency and effectiveness of these products. However, fluctuating raw material prices and competitive pressures from synthetic substitutes pose challenges to the market's sustained growth.
Dominant Regions & Segments in Bleaching Clay Market
This section highlights the leading regions, countries, and segments within the Bleaching Clay market. The full report provides a detailed geographical and segmental breakdown, including market size and growth projections for each area.
Leading Regions: Asia-Pacific currently dominates the market, driven by strong demand from the food and beverage and cosmetic industries. North America and Europe follow, exhibiting steady growth.
Dominant Segments:
- Type: Activated Clays hold the largest market share, followed by Fuller's Earth and Activated Bauxite. Detailed growth projections for each type are provided in the full report.
- Application: Industrial Oil, Mineral Oil and Waxes represent a significant market share, driven by the large-scale processing of these materials.
- End-user Industry: The Food and Beverage industry is a major consumer of bleaching clays, followed by the Cosmetics and Personal Care and Chemicals sectors.
Key Drivers (Examples):
- Asia-Pacific: Rapid economic growth, rising disposable incomes, and expanding food processing industries.
- North America: Stringent quality standards and regulations in the food and cosmetic industries drive demand for high-quality bleaching clays.
Bleaching Clay Market Product Innovations
Recent product innovations focus on enhancing the efficiency, sustainability, and application versatility of bleaching clays. Companies are developing specialized clay formulations tailored to specific industry needs, addressing concerns about environmental impact and cost-effectiveness. Nanotechnology and other advanced techniques are being explored to improve performance and create new applications.
Report Scope & Segmentation Analysis
This report provides a comprehensive analysis of the Bleaching Clay market, segmented by type (Activated Bauxite, Activated Clays, Fuller's Earth), application (Industrial Oil, Mineral Oil and Waxes, Vegetable Oil and Animal Fats), and end-user industry (Food and Beverage, Cosmetics and Personal Care, Chemicals, Other End-user Industries). Each segment's market size, growth projections, and competitive landscape are detailed within the full report.
Key Drivers of Bleaching Clay Market Growth
The Bleaching Clay market's growth is fueled by several key factors: increasing demand from the food and beverage industry, the expanding cosmetics and personal care sector, and advancements in clay processing technologies. Government regulations promoting sustainable solutions and the inherent advantages of natural bleaching agents also contribute to market expansion.
Challenges in the Bleaching Clay Market Sector
The Bleaching Clay market faces challenges including fluctuating raw material prices, competition from synthetic alternatives, and stringent regulatory requirements. Supply chain disruptions and environmental concerns also impact market dynamics. The full report quantifies the impact of these challenges.
Emerging Opportunities in Bleaching Clay Market
Emerging opportunities lie in developing innovative applications for bleaching clays in new industries, such as pharmaceuticals and biofuels. Advancements in nanotechnology and sustainable processing techniques offer significant potential for market expansion.
Leading Players in the Bleaching Clay Market Market
- Mineral Technologies Inc
- Musim Mas
- Clariant
- Refoil Earth Pvt Ltd
- The W Clay Industries Sdn Bhd
- HRP Industries
- Ashapura Group
- Oil-Dri Corporation of America
- EP Minerals
- Taiko Clay Marketing Sdn Bhd
Key Developments in Bleaching Clay Market Industry
- 2022 Q3: Clariant launched a new line of sustainable bleaching clays.
- 2023 Q1: Mineral Technologies Inc announced a major expansion of its production facility.
- Further details of key industry developments are provided within the full report, including dates and impacts.
Future Outlook for Bleaching Clay Market Market
The Bleaching Clay market is poised for continued growth, driven by increasing demand, technological advancements, and the growing focus on sustainability. Strategic partnerships, product diversification, and expansion into emerging markets will be crucial for companies to maintain a competitive edge.
Bleaching Clay Market Segmentation
-
1. Type
- 1.1. Activated Bauxite
- 1.2. Activated Clays
- 1.3. Fuller's Earth
-
2. Application
- 2.1. Industrial Oil
- 2.2. Mineral Oil and Waxes
- 2.3. Vegetable Oil and Animal Fats
-
3. End-user Industry
- 3.1. Food and Beverage
- 3.2. Cosmetics and Personal Care
- 3.3. Chemicals
- 3.4. Other End-user Industries
Bleaching Clay Market Segmentation By Geography
-
1. Asia Pacific
- 1.1. China
- 1.2. India
- 1.3. Japan
- 1.4. South Korea
- 1.5. Rest of Asia Pacific
-
2. North America
- 2.1. United States
- 2.2. Canada
- 2.3. Mexico
-
3. Europe
- 3.1. Germany
- 3.2. United Kingdom
- 3.3. Italy
- 3.4. France
- 3.5. Rest of Europe
-
4. South America
- 4.1. Brazil
- 4.2. Argentina
- 4.3. Rest of South America
-
5. Middle East and Africa
- 5.1. Saudi Arabia
- 5.2. South Africa
- 5.3. Rest of Middle East and Africa
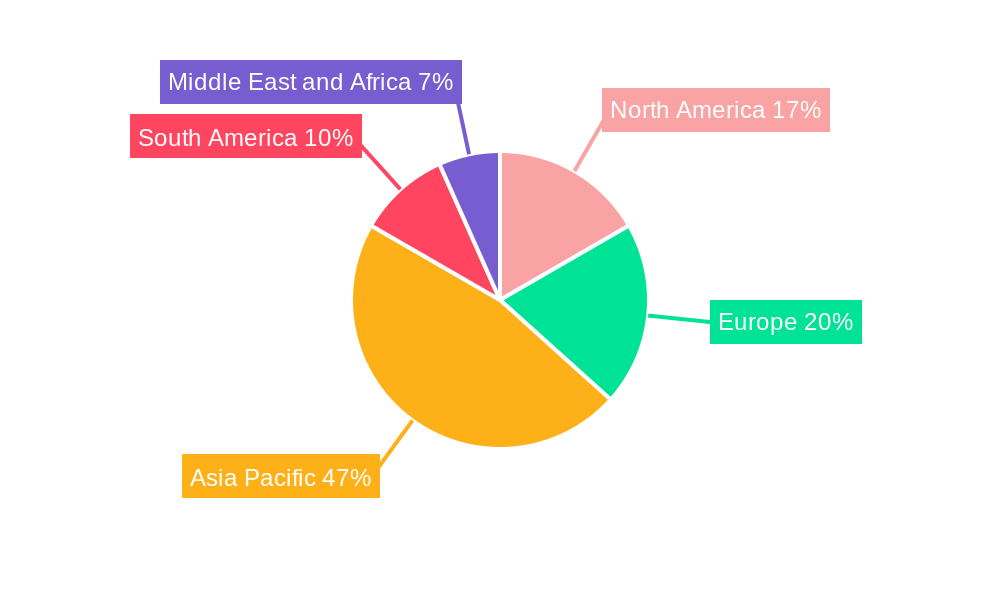
Bleaching Clay Market Regional Market Share
Geographic Coverage of Bleaching Clay Market
Bleaching Clay Market REPORT HIGHLIGHTS
| Aspects | Details |
|---|---|
| Study Period | 2020-2034 |
| Base Year | 2025 |
| Estimated Year | 2026 |
| Forecast Period | 2026-2034 |
| Historical Period | 2020-2025 |
| Growth Rate | CAGR of 5.5% from 2020-2034 |
| Segmentation |
|
Table of Contents
- 1. Introduction
- 1.1. Research Scope
- 1.2. Market Segmentation
- 1.3. Research Objective
- 1.4. Definitions and Assumptions
- 2. Executive Summary
- 2.1. Market Snapshot
- 3. Market Dynamics
- 3.1. Market Drivers
- 3.2. Market Restrains
- 3.3. Market Trends
- 3.4. Market Opportunities
- 4. Market Factor Analysis
- 4.1. Porters Five Forces
- 4.1.1. Bargaining Power of Suppliers
- 4.1.2. Bargaining Power of Buyers
- 4.1.3. Threat of New Entrants
- 4.1.4. Threat of Substitutes
- 4.1.5. Competitive Rivalry
- 4.2. PESTEL analysis
- 4.3. BCG Analysis
- 4.3.1. Stars (High Growth, High Market Share)
- 4.3.2. Cash Cows (Low Growth, High Market Share)
- 4.3.3. Question Mark (High Growth, Low Market Share)
- 4.3.4. Dogs (Low Growth, Low Market Share)
- 4.4. Ansoff Matrix Analysis
- 4.5. Supply Chain Analysis
- 4.6. Regulatory Landscape
- 4.7. Current Market Potential and Opportunity Assessment (TAM–SAM–SOM Framework)
- 4.8. PRI Analyst Note
- 4.1. Porters Five Forces
- 5. Market Analysis, Insights and Forecast 2021-2033
- 5.1. Market Analysis, Insights and Forecast - by Type
- 5.1.1. Activated Bauxite
- 5.1.2. Activated Clays
- 5.1.3. Fuller's Earth
- 5.2. Market Analysis, Insights and Forecast - by Application
- 5.2.1. Industrial Oil
- 5.2.2. Mineral Oil and Waxes
- 5.2.3. Vegetable Oil and Animal Fats
- 5.3. Market Analysis, Insights and Forecast - by End-user Industry
- 5.3.1. Food and Beverage
- 5.3.2. Cosmetics and Personal Care
- 5.3.3. Chemicals
- 5.3.4. Other End-user Industries
- 5.4. Market Analysis, Insights and Forecast - by Region
- 5.4.1. Asia Pacific
- 5.4.2. North America
- 5.4.3. Europe
- 5.4.4. South America
- 5.4.5. Middle East and Africa
- 5.1. Market Analysis, Insights and Forecast - by Type
- 6. Global Bleaching Clay Market Analysis, Insights and Forecast, 2021-2033
- 6.1. Market Analysis, Insights and Forecast - by Type
- 6.1.1. Activated Bauxite
- 6.1.2. Activated Clays
- 6.1.3. Fuller's Earth
- 6.2. Market Analysis, Insights and Forecast - by Application
- 6.2.1. Industrial Oil
- 6.2.2. Mineral Oil and Waxes
- 6.2.3. Vegetable Oil and Animal Fats
- 6.3. Market Analysis, Insights and Forecast - by End-user Industry
- 6.3.1. Food and Beverage
- 6.3.2. Cosmetics and Personal Care
- 6.3.3. Chemicals
- 6.3.4. Other End-user Industries
- 6.1. Market Analysis, Insights and Forecast - by Type
- 7. Asia Pacific Bleaching Clay Market Analysis, Insights and Forecast, 2020-2032
- 7.1. Market Analysis, Insights and Forecast - by Type
- 7.1.1. Activated Bauxite
- 7.1.2. Activated Clays
- 7.1.3. Fuller's Earth
- 7.2. Market Analysis, Insights and Forecast - by Application
- 7.2.1. Industrial Oil
- 7.2.2. Mineral Oil and Waxes
- 7.2.3. Vegetable Oil and Animal Fats
- 7.3. Market Analysis, Insights and Forecast - by End-user Industry
- 7.3.1. Food and Beverage
- 7.3.2. Cosmetics and Personal Care
- 7.3.3. Chemicals
- 7.3.4. Other End-user Industries
- 7.1. Market Analysis, Insights and Forecast - by Type
- 8. North America Bleaching Clay Market Analysis, Insights and Forecast, 2020-2032
- 8.1. Market Analysis, Insights and Forecast - by Type
- 8.1.1. Activated Bauxite
- 8.1.2. Activated Clays
- 8.1.3. Fuller's Earth
- 8.2. Market Analysis, Insights and Forecast - by Application
- 8.2.1. Industrial Oil
- 8.2.2. Mineral Oil and Waxes
- 8.2.3. Vegetable Oil and Animal Fats
- 8.3. Market Analysis, Insights and Forecast - by End-user Industry
- 8.3.1. Food and Beverage
- 8.3.2. Cosmetics and Personal Care
- 8.3.3. Chemicals
- 8.3.4. Other End-user Industries
- 8.1. Market Analysis, Insights and Forecast - by Type
- 9. Europe Bleaching Clay Market Analysis, Insights and Forecast, 2020-2032
- 9.1. Market Analysis, Insights and Forecast - by Type
- 9.1.1. Activated Bauxite
- 9.1.2. Activated Clays
- 9.1.3. Fuller's Earth
- 9.2. Market Analysis, Insights and Forecast - by Application
- 9.2.1. Industrial Oil
- 9.2.2. Mineral Oil and Waxes
- 9.2.3. Vegetable Oil and Animal Fats
- 9.3. Market Analysis, Insights and Forecast - by End-user Industry
- 9.3.1. Food and Beverage
- 9.3.2. Cosmetics and Personal Care
- 9.3.3. Chemicals
- 9.3.4. Other End-user Industries
- 9.1. Market Analysis, Insights and Forecast - by Type
- 10. South America Bleaching Clay Market Analysis, Insights and Forecast, 2020-2032
- 10.1. Market Analysis, Insights and Forecast - by Type
- 10.1.1. Activated Bauxite
- 10.1.2. Activated Clays
- 10.1.3. Fuller's Earth
- 10.2. Market Analysis, Insights and Forecast - by Application
- 10.2.1. Industrial Oil
- 10.2.2. Mineral Oil and Waxes
- 10.2.3. Vegetable Oil and Animal Fats
- 10.3. Market Analysis, Insights and Forecast - by End-user Industry
- 10.3.1. Food and Beverage
- 10.3.2. Cosmetics and Personal Care
- 10.3.3. Chemicals
- 10.3.4. Other End-user Industries
- 10.1. Market Analysis, Insights and Forecast - by Type
- 11. Middle East and Africa Bleaching Clay Market Analysis, Insights and Forecast, 2020-2032
- 11.1. Market Analysis, Insights and Forecast - by Type
- 11.1.1. Activated Bauxite
- 11.1.2. Activated Clays
- 11.1.3. Fuller's Earth
- 11.2. Market Analysis, Insights and Forecast - by Application
- 11.2.1. Industrial Oil
- 11.2.2. Mineral Oil and Waxes
- 11.2.3. Vegetable Oil and Animal Fats
- 11.3. Market Analysis, Insights and Forecast - by End-user Industry
- 11.3.1. Food and Beverage
- 11.3.2. Cosmetics and Personal Care
- 11.3.3. Chemicals
- 11.3.4. Other End-user Industries
- 11.1. Market Analysis, Insights and Forecast - by Type
- 12. Competitive Analysis
- 12.1. Company Profiles
- 12.1.1 Mineral Technologies Inc
- 12.1.1.1. Company Overview
- 12.1.1.2. Products
- 12.1.1.3. Company Financials
- 12.1.1.4. SWOT Analysis
- 12.1.2 Musim Mas
- 12.1.2.1. Company Overview
- 12.1.2.2. Products
- 12.1.2.3. Company Financials
- 12.1.2.4. SWOT Analysis
- 12.1.3 Clariant
- 12.1.3.1. Company Overview
- 12.1.3.2. Products
- 12.1.3.3. Company Financials
- 12.1.3.4. SWOT Analysis
- 12.1.4 Refoil Earth Pvt Ltd
- 12.1.4.1. Company Overview
- 12.1.4.2. Products
- 12.1.4.3. Company Financials
- 12.1.4.4. SWOT Analysis
- 12.1.5 The W Clay Industries Sdn Bhd
- 12.1.5.1. Company Overview
- 12.1.5.2. Products
- 12.1.5.3. Company Financials
- 12.1.5.4. SWOT Analysis
- 12.1.6 HRP Industries
- 12.1.6.1. Company Overview
- 12.1.6.2. Products
- 12.1.6.3. Company Financials
- 12.1.6.4. SWOT Analysis
- 12.1.7 Ashapura Group
- 12.1.7.1. Company Overview
- 12.1.7.2. Products
- 12.1.7.3. Company Financials
- 12.1.7.4. SWOT Analysis
- 12.1.8 Oil-Dri Corporation of America
- 12.1.8.1. Company Overview
- 12.1.8.2. Products
- 12.1.8.3. Company Financials
- 12.1.8.4. SWOT Analysis
- 12.1.9 EP Minerals
- 12.1.9.1. Company Overview
- 12.1.9.2. Products
- 12.1.9.3. Company Financials
- 12.1.9.4. SWOT Analysis
- 12.1.10 Taiko Clay Marketing Sdn Bhd
- 12.1.10.1. Company Overview
- 12.1.10.2. Products
- 12.1.10.3. Company Financials
- 12.1.10.4. SWOT Analysis
- 12.1.1 Mineral Technologies Inc
- 12.2. Market Entropy
- 12.2.1 Company's Key Areas Served
- 12.2.2 Recent Developments
- 12.3. Company Market Share Analysis 2025
- 12.3.1 Top 5 Companies Market Share Analysis
- 12.3.2 Top 3 Companies Market Share Analysis
- 12.4. List of Potential Customers
- 13. Research Methodology
List of Figures
- Figure 1: Global Bleaching Clay Market Revenue Breakdown (billion, %) by Region 2025 & 2033
- Figure 2: Global Bleaching Clay Market Volume Breakdown (K Tons, %) by Region 2025 & 2033
- Figure 3: Asia Pacific Bleaching Clay Market Revenue (billion), by Type 2025 & 2033
- Figure 4: Asia Pacific Bleaching Clay Market Volume (K Tons), by Type 2025 & 2033
- Figure 5: Asia Pacific Bleaching Clay Market Revenue Share (%), by Type 2025 & 2033
- Figure 6: Asia Pacific Bleaching Clay Market Volume Share (%), by Type 2025 & 2033
- Figure 7: Asia Pacific Bleaching Clay Market Revenue (billion), by Application 2025 & 2033
- Figure 8: Asia Pacific Bleaching Clay Market Volume (K Tons), by Application 2025 & 2033
- Figure 9: Asia Pacific Bleaching Clay Market Revenue Share (%), by Application 2025 & 2033
- Figure 10: Asia Pacific Bleaching Clay Market Volume Share (%), by Application 2025 & 2033
- Figure 11: Asia Pacific Bleaching Clay Market Revenue (billion), by End-user Industry 2025 & 2033
- Figure 12: Asia Pacific Bleaching Clay Market Volume (K Tons), by End-user Industry 2025 & 2033
- Figure 13: Asia Pacific Bleaching Clay Market Revenue Share (%), by End-user Industry 2025 & 2033
- Figure 14: Asia Pacific Bleaching Clay Market Volume Share (%), by End-user Industry 2025 & 2033
- Figure 15: Asia Pacific Bleaching Clay Market Revenue (billion), by Country 2025 & 2033
- Figure 16: Asia Pacific Bleaching Clay Market Volume (K Tons), by Country 2025 & 2033
- Figure 17: Asia Pacific Bleaching Clay Market Revenue Share (%), by Country 2025 & 2033
- Figure 18: Asia Pacific Bleaching Clay Market Volume Share (%), by Country 2025 & 2033
- Figure 19: North America Bleaching Clay Market Revenue (billion), by Type 2025 & 2033
- Figure 20: North America Bleaching Clay Market Volume (K Tons), by Type 2025 & 2033
- Figure 21: North America Bleaching Clay Market Revenue Share (%), by Type 2025 & 2033
- Figure 22: North America Bleaching Clay Market Volume Share (%), by Type 2025 & 2033
- Figure 23: North America Bleaching Clay Market Revenue (billion), by Application 2025 & 2033
- Figure 24: North America Bleaching Clay Market Volume (K Tons), by Application 2025 & 2033
- Figure 25: North America Bleaching Clay Market Revenue Share (%), by Application 2025 & 2033
- Figure 26: North America Bleaching Clay Market Volume Share (%), by Application 2025 & 2033
- Figure 27: North America Bleaching Clay Market Revenue (billion), by End-user Industry 2025 & 2033
- Figure 28: North America Bleaching Clay Market Volume (K Tons), by End-user Industry 2025 & 2033
- Figure 29: North America Bleaching Clay Market Revenue Share (%), by End-user Industry 2025 & 2033
- Figure 30: North America Bleaching Clay Market Volume Share (%), by End-user Industry 2025 & 2033
- Figure 31: North America Bleaching Clay Market Revenue (billion), by Country 2025 & 2033
- Figure 32: North America Bleaching Clay Market Volume (K Tons), by Country 2025 & 2033
- Figure 33: North America Bleaching Clay Market Revenue Share (%), by Country 2025 & 2033
- Figure 34: North America Bleaching Clay Market Volume Share (%), by Country 2025 & 2033
- Figure 35: Europe Bleaching Clay Market Revenue (billion), by Type 2025 & 2033
- Figure 36: Europe Bleaching Clay Market Volume (K Tons), by Type 2025 & 2033
- Figure 37: Europe Bleaching Clay Market Revenue Share (%), by Type 2025 & 2033
- Figure 38: Europe Bleaching Clay Market Volume Share (%), by Type 2025 & 2033
- Figure 39: Europe Bleaching Clay Market Revenue (billion), by Application 2025 & 2033
- Figure 40: Europe Bleaching Clay Market Volume (K Tons), by Application 2025 & 2033
- Figure 41: Europe Bleaching Clay Market Revenue Share (%), by Application 2025 & 2033
- Figure 42: Europe Bleaching Clay Market Volume Share (%), by Application 2025 & 2033
- Figure 43: Europe Bleaching Clay Market Revenue (billion), by End-user Industry 2025 & 2033
- Figure 44: Europe Bleaching Clay Market Volume (K Tons), by End-user Industry 2025 & 2033
- Figure 45: Europe Bleaching Clay Market Revenue Share (%), by End-user Industry 2025 & 2033
- Figure 46: Europe Bleaching Clay Market Volume Share (%), by End-user Industry 2025 & 2033
- Figure 47: Europe Bleaching Clay Market Revenue (billion), by Country 2025 & 2033
- Figure 48: Europe Bleaching Clay Market Volume (K Tons), by Country 2025 & 2033
- Figure 49: Europe Bleaching Clay Market Revenue Share (%), by Country 2025 & 2033
- Figure 50: Europe Bleaching Clay Market Volume Share (%), by Country 2025 & 2033
- Figure 51: South America Bleaching Clay Market Revenue (billion), by Type 2025 & 2033
- Figure 52: South America Bleaching Clay Market Volume (K Tons), by Type 2025 & 2033
- Figure 53: South America Bleaching Clay Market Revenue Share (%), by Type 2025 & 2033
- Figure 54: South America Bleaching Clay Market Volume Share (%), by Type 2025 & 2033
- Figure 55: South America Bleaching Clay Market Revenue (billion), by Application 2025 & 2033
- Figure 56: South America Bleaching Clay Market Volume (K Tons), by Application 2025 & 2033
- Figure 57: South America Bleaching Clay Market Revenue Share (%), by Application 2025 & 2033
- Figure 58: South America Bleaching Clay Market Volume Share (%), by Application 2025 & 2033
- Figure 59: South America Bleaching Clay Market Revenue (billion), by End-user Industry 2025 & 2033
- Figure 60: South America Bleaching Clay Market Volume (K Tons), by End-user Industry 2025 & 2033
- Figure 61: South America Bleaching Clay Market Revenue Share (%), by End-user Industry 2025 & 2033
- Figure 62: South America Bleaching Clay Market Volume Share (%), by End-user Industry 2025 & 2033
- Figure 63: South America Bleaching Clay Market Revenue (billion), by Country 2025 & 2033
- Figure 64: South America Bleaching Clay Market Volume (K Tons), by Country 2025 & 2033
- Figure 65: South America Bleaching Clay Market Revenue Share (%), by Country 2025 & 2033
- Figure 66: South America Bleaching Clay Market Volume Share (%), by Country 2025 & 2033
- Figure 67: Middle East and Africa Bleaching Clay Market Revenue (billion), by Type 2025 & 2033
- Figure 68: Middle East and Africa Bleaching Clay Market Volume (K Tons), by Type 2025 & 2033
- Figure 69: Middle East and Africa Bleaching Clay Market Revenue Share (%), by Type 2025 & 2033
- Figure 70: Middle East and Africa Bleaching Clay Market Volume Share (%), by Type 2025 & 2033
- Figure 71: Middle East and Africa Bleaching Clay Market Revenue (billion), by Application 2025 & 2033
- Figure 72: Middle East and Africa Bleaching Clay Market Volume (K Tons), by Application 2025 & 2033
- Figure 73: Middle East and Africa Bleaching Clay Market Revenue Share (%), by Application 2025 & 2033
- Figure 74: Middle East and Africa Bleaching Clay Market Volume Share (%), by Application 2025 & 2033
- Figure 75: Middle East and Africa Bleaching Clay Market Revenue (billion), by End-user Industry 2025 & 2033
- Figure 76: Middle East and Africa Bleaching Clay Market Volume (K Tons), by End-user Industry 2025 & 2033
- Figure 77: Middle East and Africa Bleaching Clay Market Revenue Share (%), by End-user Industry 2025 & 2033
- Figure 78: Middle East and Africa Bleaching Clay Market Volume Share (%), by End-user Industry 2025 & 2033
- Figure 79: Middle East and Africa Bleaching Clay Market Revenue (billion), by Country 2025 & 2033
- Figure 80: Middle East and Africa Bleaching Clay Market Volume (K Tons), by Country 2025 & 2033
- Figure 81: Middle East and Africa Bleaching Clay Market Revenue Share (%), by Country 2025 & 2033
- Figure 82: Middle East and Africa Bleaching Clay Market Volume Share (%), by Country 2025 & 2033
List of Tables
- Table 1: Global Bleaching Clay Market Revenue billion Forecast, by Type 2020 & 2033
- Table 2: Global Bleaching Clay Market Volume K Tons Forecast, by Type 2020 & 2033
- Table 3: Global Bleaching Clay Market Revenue billion Forecast, by Application 2020 & 2033
- Table 4: Global Bleaching Clay Market Volume K Tons Forecast, by Application 2020 & 2033
- Table 5: Global Bleaching Clay Market Revenue billion Forecast, by End-user Industry 2020 & 2033
- Table 6: Global Bleaching Clay Market Volume K Tons Forecast, by End-user Industry 2020 & 2033
- Table 7: Global Bleaching Clay Market Revenue billion Forecast, by Region 2020 & 2033
- Table 8: Global Bleaching Clay Market Volume K Tons Forecast, by Region 2020 & 2033
- Table 9: Global Bleaching Clay Market Revenue billion Forecast, by Type 2020 & 2033
- Table 10: Global Bleaching Clay Market Volume K Tons Forecast, by Type 2020 & 2033
- Table 11: Global Bleaching Clay Market Revenue billion Forecast, by Application 2020 & 2033
- Table 12: Global Bleaching Clay Market Volume K Tons Forecast, by Application 2020 & 2033
- Table 13: Global Bleaching Clay Market Revenue billion Forecast, by End-user Industry 2020 & 2033
- Table 14: Global Bleaching Clay Market Volume K Tons Forecast, by End-user Industry 2020 & 2033
- Table 15: Global Bleaching Clay Market Revenue billion Forecast, by Country 2020 & 2033
- Table 16: Global Bleaching Clay Market Volume K Tons Forecast, by Country 2020 & 2033
- Table 17: China Bleaching Clay Market Revenue (billion) Forecast, by Application 2020 & 2033
- Table 18: China Bleaching Clay Market Volume (K Tons) Forecast, by Application 2020 & 2033
- Table 19: India Bleaching Clay Market Revenue (billion) Forecast, by Application 2020 & 2033
- Table 20: India Bleaching Clay Market Volume (K Tons) Forecast, by Application 2020 & 2033
- Table 21: Japan Bleaching Clay Market Revenue (billion) Forecast, by Application 2020 & 2033
- Table 22: Japan Bleaching Clay Market Volume (K Tons) Forecast, by Application 2020 & 2033
- Table 23: South Korea Bleaching Clay Market Revenue (billion) Forecast, by Application 2020 & 2033
- Table 24: South Korea Bleaching Clay Market Volume (K Tons) Forecast, by Application 2020 & 2033
- Table 25: Rest of Asia Pacific Bleaching Clay Market Revenue (billion) Forecast, by Application 2020 & 2033
- Table 26: Rest of Asia Pacific Bleaching Clay Market Volume (K Tons) Forecast, by Application 2020 & 2033
- Table 27: Global Bleaching Clay Market Revenue billion Forecast, by Type 2020 & 2033
- Table 28: Global Bleaching Clay Market Volume K Tons Forecast, by Type 2020 & 2033
- Table 29: Global Bleaching Clay Market Revenue billion Forecast, by Application 2020 & 2033
- Table 30: Global Bleaching Clay Market Volume K Tons Forecast, by Application 2020 & 2033
- Table 31: Global Bleaching Clay Market Revenue billion Forecast, by End-user Industry 2020 & 2033
- Table 32: Global Bleaching Clay Market Volume K Tons Forecast, by End-user Industry 2020 & 2033
- Table 33: Global Bleaching Clay Market Revenue billion Forecast, by Country 2020 & 2033
- Table 34: Global Bleaching Clay Market Volume K Tons Forecast, by Country 2020 & 2033
- Table 35: United States Bleaching Clay Market Revenue (billion) Forecast, by Application 2020 & 2033
- Table 36: United States Bleaching Clay Market Volume (K Tons) Forecast, by Application 2020 & 2033
- Table 37: Canada Bleaching Clay Market Revenue (billion) Forecast, by Application 2020 & 2033
- Table 38: Canada Bleaching Clay Market Volume (K Tons) Forecast, by Application 2020 & 2033
- Table 39: Mexico Bleaching Clay Market Revenue (billion) Forecast, by Application 2020 & 2033
- Table 40: Mexico Bleaching Clay Market Volume (K Tons) Forecast, by Application 2020 & 2033
- Table 41: Global Bleaching Clay Market Revenue billion Forecast, by Type 2020 & 2033
- Table 42: Global Bleaching Clay Market Volume K Tons Forecast, by Type 2020 & 2033
- Table 43: Global Bleaching Clay Market Revenue billion Forecast, by Application 2020 & 2033
- Table 44: Global Bleaching Clay Market Volume K Tons Forecast, by Application 2020 & 2033
- Table 45: Global Bleaching Clay Market Revenue billion Forecast, by End-user Industry 2020 & 2033
- Table 46: Global Bleaching Clay Market Volume K Tons Forecast, by End-user Industry 2020 & 2033
- Table 47: Global Bleaching Clay Market Revenue billion Forecast, by Country 2020 & 2033
- Table 48: Global Bleaching Clay Market Volume K Tons Forecast, by Country 2020 & 2033
- Table 49: Germany Bleaching Clay Market Revenue (billion) Forecast, by Application 2020 & 2033
- Table 50: Germany Bleaching Clay Market Volume (K Tons) Forecast, by Application 2020 & 2033
- Table 51: United Kingdom Bleaching Clay Market Revenue (billion) Forecast, by Application 2020 & 2033
- Table 52: United Kingdom Bleaching Clay Market Volume (K Tons) Forecast, by Application 2020 & 2033
- Table 53: Italy Bleaching Clay Market Revenue (billion) Forecast, by Application 2020 & 2033
- Table 54: Italy Bleaching Clay Market Volume (K Tons) Forecast, by Application 2020 & 2033
- Table 55: France Bleaching Clay Market Revenue (billion) Forecast, by Application 2020 & 2033
- Table 56: France Bleaching Clay Market Volume (K Tons) Forecast, by Application 2020 & 2033
- Table 57: Rest of Europe Bleaching Clay Market Revenue (billion) Forecast, by Application 2020 & 2033
- Table 58: Rest of Europe Bleaching Clay Market Volume (K Tons) Forecast, by Application 2020 & 2033
- Table 59: Global Bleaching Clay Market Revenue billion Forecast, by Type 2020 & 2033
- Table 60: Global Bleaching Clay Market Volume K Tons Forecast, by Type 2020 & 2033
- Table 61: Global Bleaching Clay Market Revenue billion Forecast, by Application 2020 & 2033
- Table 62: Global Bleaching Clay Market Volume K Tons Forecast, by Application 2020 & 2033
- Table 63: Global Bleaching Clay Market Revenue billion Forecast, by End-user Industry 2020 & 2033
- Table 64: Global Bleaching Clay Market Volume K Tons Forecast, by End-user Industry 2020 & 2033
- Table 65: Global Bleaching Clay Market Revenue billion Forecast, by Country 2020 & 2033
- Table 66: Global Bleaching Clay Market Volume K Tons Forecast, by Country 2020 & 2033
- Table 67: Brazil Bleaching Clay Market Revenue (billion) Forecast, by Application 2020 & 2033
- Table 68: Brazil Bleaching Clay Market Volume (K Tons) Forecast, by Application 2020 & 2033
- Table 69: Argentina Bleaching Clay Market Revenue (billion) Forecast, by Application 2020 & 2033
- Table 70: Argentina Bleaching Clay Market Volume (K Tons) Forecast, by Application 2020 & 2033
- Table 71: Rest of South America Bleaching Clay Market Revenue (billion) Forecast, by Application 2020 & 2033
- Table 72: Rest of South America Bleaching Clay Market Volume (K Tons) Forecast, by Application 2020 & 2033
- Table 73: Global Bleaching Clay Market Revenue billion Forecast, by Type 2020 & 2033
- Table 74: Global Bleaching Clay Market Volume K Tons Forecast, by Type 2020 & 2033
- Table 75: Global Bleaching Clay Market Revenue billion Forecast, by Application 2020 & 2033
- Table 76: Global Bleaching Clay Market Volume K Tons Forecast, by Application 2020 & 2033
- Table 77: Global Bleaching Clay Market Revenue billion Forecast, by End-user Industry 2020 & 2033
- Table 78: Global Bleaching Clay Market Volume K Tons Forecast, by End-user Industry 2020 & 2033
- Table 79: Global Bleaching Clay Market Revenue billion Forecast, by Country 2020 & 2033
- Table 80: Global Bleaching Clay Market Volume K Tons Forecast, by Country 2020 & 2033
- Table 81: Saudi Arabia Bleaching Clay Market Revenue (billion) Forecast, by Application 2020 & 2033
- Table 82: Saudi Arabia Bleaching Clay Market Volume (K Tons) Forecast, by Application 2020 & 2033
- Table 83: South Africa Bleaching Clay Market Revenue (billion) Forecast, by Application 2020 & 2033
- Table 84: South Africa Bleaching Clay Market Volume (K Tons) Forecast, by Application 2020 & 2033
- Table 85: Rest of Middle East and Africa Bleaching Clay Market Revenue (billion) Forecast, by Application 2020 & 2033
- Table 86: Rest of Middle East and Africa Bleaching Clay Market Volume (K Tons) Forecast, by Application 2020 & 2033
Frequently Asked Questions
1. What is the projected Compound Annual Growth Rate (CAGR) of the Bleaching Clay Market?
The projected CAGR is approximately 5.5%.
2. Which companies are prominent players in the Bleaching Clay Market?
Key companies in the market include Mineral Technologies Inc, Musim Mas, Clariant, Refoil Earth Pvt Ltd, The W Clay Industries Sdn Bhd, HRP Industries, Ashapura Group, Oil-Dri Corporation of America, EP Minerals, Taiko Clay Marketing Sdn Bhd.
3. What are the main segments of the Bleaching Clay Market?
The market segments include Type, Application, End-user Industry.
4. Can you provide details about the market size?
The market size is estimated to be USD 1.7 billion as of 2022.
5. What are some drivers contributing to market growth?
; Growing Demand for Refined Vegetable Oil; Increasing Demand from the Cosmetics and Personal Care Market.
6. What are the notable trends driving market growth?
Increasing Demand from the Food and Beverage Industry.
7. Are there any restraints impacting market growth?
; Stringent Safety Legislations; Negative Impact of the COVID-19 Pandemic.
8. Can you provide examples of recent developments in the market?
N/A
9. What pricing options are available for accessing the report?
Pricing options include single-user, multi-user, and enterprise licenses priced at USD 4750, USD 5250, and USD 8750 respectively.
10. Is the market size provided in terms of value or volume?
The market size is provided in terms of value, measured in billion and volume, measured in K Tons.
11. Are there any specific market keywords associated with the report?
Yes, the market keyword associated with the report is "Bleaching Clay Market," which aids in identifying and referencing the specific market segment covered.
12. How do I determine which pricing option suits my needs best?
The pricing options vary based on user requirements and access needs. Individual users may opt for single-user licenses, while businesses requiring broader access may choose multi-user or enterprise licenses for cost-effective access to the report.
13. Are there any additional resources or data provided in the Bleaching Clay Market report?
While the report offers comprehensive insights, it's advisable to review the specific contents or supplementary materials provided to ascertain if additional resources or data are available.
14. How can I stay updated on further developments or reports in the Bleaching Clay Market?
To stay informed about further developments, trends, and reports in the Bleaching Clay Market, consider subscribing to industry newsletters, following relevant companies and organizations, or regularly checking reputable industry news sources and publications.
Methodology
Step 1 - Identification of Relevant Samples Size from Population Database


Step 2 - Approaches for Defining Global Market Size (Value, Volume* & Price*)

Note*: In applicable scenarios
Step 3 - Data Sources
Primary Research
- Web Analytics
- Survey Reports
- Research Institute
- Latest Research Reports
- Opinion Leaders
Secondary Research
- Annual Reports
- White Paper
- Latest Press Release
- Industry Association
- Paid Database
- Investor Presentations

Step 4 - Data Triangulation
Involves using different sources of information in order to increase the validity of a study
These sources are likely to be stakeholders in a program - participants, other researchers, program staff, other community members, and so on.
Then we put all data in single framework & apply various statistical tools to find out the dynamic on the market.
During the analysis stage, feedback from the stakeholder groups would be compared to determine areas of agreement as well as areas of divergence