

Key Insights
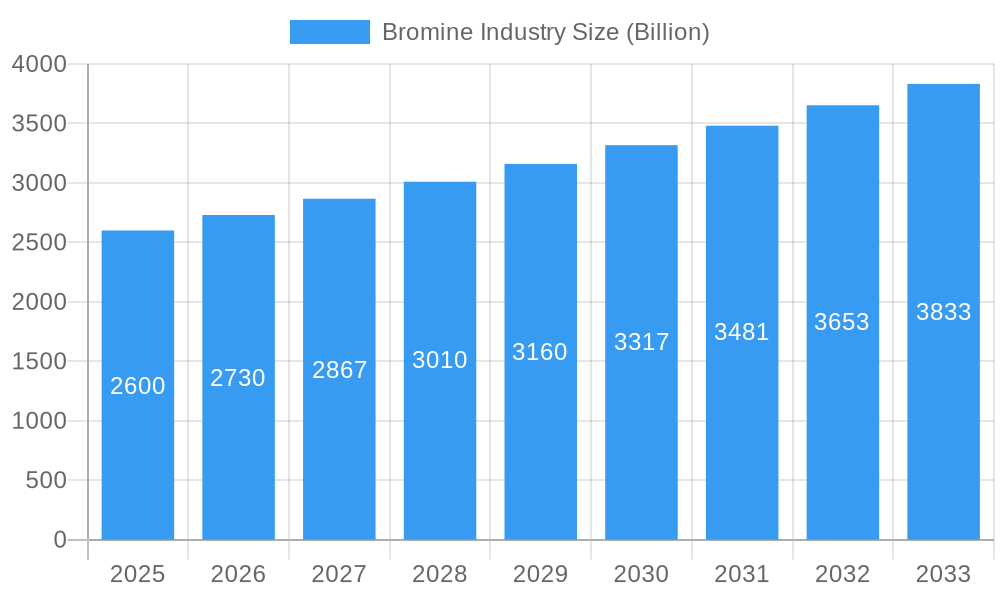
The global bromine market, valued at $2.6 billion in 2025, is projected to experience robust growth, driven by increasing demand across diverse sectors. A compound annual growth rate (CAGR) of 5% from 2025 to 2033 indicates a significant market expansion. Key drivers include the escalating need for flame retardants in electronics, construction, and transportation, as well as the rising adoption of bromine-based biocides in water treatment and agriculture. Furthermore, the expanding use of bromine in energy storage solutions, particularly bromine-based batteries for renewable energy applications, contributes to the market's growth trajectory. While the availability of bromine resources and fluctuating raw material prices present certain restraints, ongoing technological advancements and innovative applications are expected to mitigate these challenges. The market segmentation reveals organobromines as the leading derivative, followed by bromide salts and hydrogen bromide. Application-wise, flame retardants hold a significant market share, driven by stringent safety regulations and growing awareness of fire safety. Biocides and clear brine fluids (CBF) in oil and gas extraction also represent substantial market segments. Geographic analysis reveals North America and Asia-Pacific as leading regional markets, fueled by industrial growth and technological advancements in these regions. Companies such as ICL, Honeywell, and Albemarle Corporation are major players, shaping the competitive landscape through product innovation and strategic partnerships. The continued growth of downstream industries and evolving environmental regulations will be crucial factors influencing the bromine market's future trajectory.
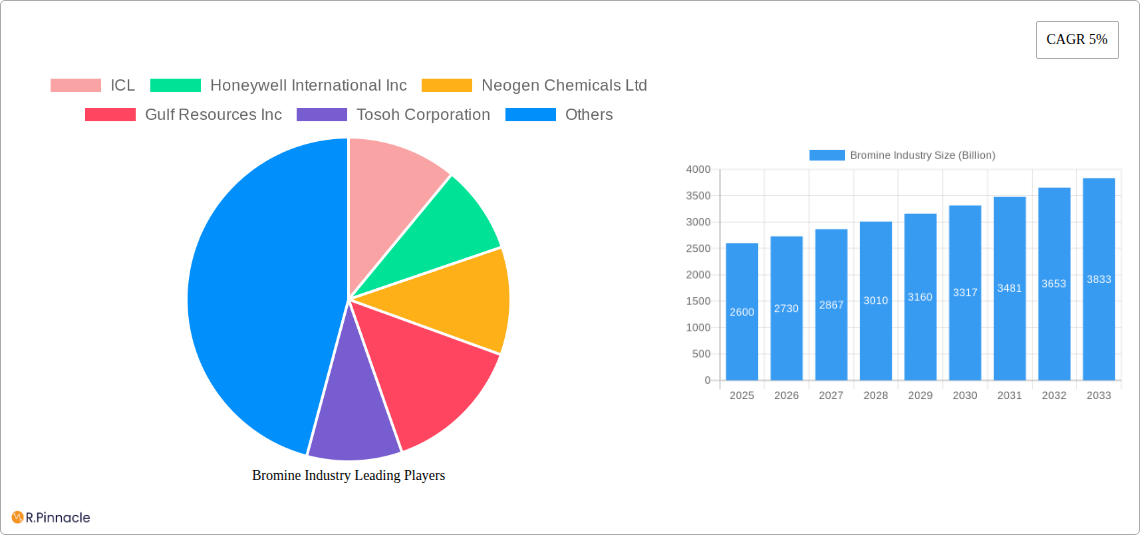
Bromine Industry Market Size (In Billion)
The forecast period from 2025 to 2033 anticipates substantial growth in the bromine market, fueled by several factors. The increasing emphasis on sustainable solutions and the growing demand for environmentally friendly flame retardants will drive innovation within the bromine-based products segment. The continued growth in the electronics, automotive, and construction industries, coupled with stricter fire safety regulations worldwide, will further enhance the demand for bromine-based flame retardants. Furthermore, exploration in the field of energy storage solutions is expected to boost the use of bromine-based batteries. This, in tandem with the expanding applications of bromine in oil and gas extraction and water treatment, ensures steady demand for the foreseeable future. Competitive dynamics will likely see existing players consolidating their positions and new entrants focusing on niche applications. The market's overall performance will be influenced by macroeconomic conditions, geopolitical stability, and the evolving regulatory landscape, particularly related to environmental regulations and safety standards.
Bromine Industry Company Market Share
Bromine Industry Market Report: 2019-2033
This comprehensive report provides a detailed analysis of the global bromine industry, offering invaluable insights for industry professionals, investors, and strategic decision-makers. The report covers market size, growth drivers, challenges, key players, and future outlook, using data from the historical period (2019-2024), base year (2025), and forecast period (2025-2033). The total market value is expected to reach xx Billion by 2033.
Bromine Industry Market Structure & Innovation Trends
The bromine industry exhibits a moderately concentrated market structure, with key players like ICL, Albemarle Corporation, and Honeywell International Inc. holding significant market share. The exact market share for each company varies but is estimated at xx% for ICL, xx% for Albemarle, and xx% for Honeywell as of 2025. Innovation is driven by the need for more sustainable and efficient bromine production methods, coupled with the development of novel applications across various end-use sectors. Regulatory frameworks, particularly concerning environmental concerns, are shaping industry practices. Product substitution is limited due to the unique properties of bromine, but competitive pressures exist. Mergers and acquisitions (M&A) play a significant role in shaping the market landscape; deal values in recent years have averaged xx Billion annually. End-user demographics are diverse, spanning various industrial sectors.
- Market Concentration: Moderately concentrated, with a few major players dominating.
- Innovation Drivers: Sustainable production, novel applications, regulatory compliance.
- Regulatory Frameworks: Increasingly stringent environmental regulations.
- M&A Activity: Significant M&A activity with average deal values of xx Billion annually.
- End-User Demographics: Diverse across multiple industries.
Bromine Industry Market Dynamics & Trends
The bromine market is projected to witness a Compound Annual Growth Rate (CAGR) of xx% during the forecast period (2025-2033). This growth is fueled by increasing demand from various application segments, particularly flame retardants and biocides. Technological advancements in bromine production and utilization, along with evolving consumer preferences for safer and more environmentally friendly products, further contribute to market expansion. Competitive dynamics are intense, with companies focusing on innovation, cost optimization, and strategic partnerships to gain a competitive edge. Market penetration of bromine-based products is expected to increase in emerging economies due to industrialization and infrastructure development. The total market value is projected to reach xx Billion by 2033.
Dominant Regions & Segments in Bromine Industry
The North American region currently holds the dominant position in the bromine market, driven by robust industrial activity and established production facilities. Within the segments, flame retardants (FR) constitute the largest application segment, followed by organobromines.
- Leading Region: North America
- Dominant Segments:
- Derivative: Organo Bromines (largest volume)
- Application: Flame Retardants (FR) (largest demand)
Key Drivers for North American Dominance:
- Strong industrial base and established manufacturing facilities.
- High demand from various end-use industries.
- Favorable regulatory environment (though evolving).
- Established supply chains.
Bromine Industry Product Innovations
Recent innovations focus on developing more sustainable and efficient bromine production methods, alongside the creation of new bromine-based compounds with enhanced performance characteristics for specific applications. This includes advancements in organobromine chemistry and the development of specialized flame retardants with improved efficacy and reduced environmental impact.
Report Scope & Segmentation Analysis
This report segments the bromine market by derivative (Organo Bromines, Bromide Salts, Hydrogen Bromide) and application (Biocides, Flame Retardants (FR), Bromine-based Batteries, Clear Brine Fluids (CBF), Other Applications). Each segment's market size, growth projections, and competitive landscape are thoroughly analyzed. For example, the flame retardant segment is projected to grow at xx% CAGR, driven by increasing demand from the construction and electronics industries.
Key Drivers of Bromine Industry Growth
Several factors drive bromine industry growth. Increased demand from various end-use sectors, including electronics, construction, and oil and gas, is a major contributor. Technological advancements in bromine production and application are enhancing efficiency and expanding market opportunities. Finally, favorable government policies and infrastructure development in several regions also stimulate growth.
Challenges in the Bromine Industry Sector
The bromine industry faces several challenges, including stringent environmental regulations, volatility in raw material prices, and intense competition. Supply chain disruptions and the potential for product substitution also pose risks. These factors can impact production costs and profitability.
Emerging Opportunities in Bromine Industry
Emerging opportunities arise from the development of novel applications for bromine-based compounds, particularly in advanced materials, energy storage, and water treatment. Expanding into new geographic markets and focusing on sustainable production methods present further opportunities for growth.
Leading Players in the Bromine Industry Market
- ICL
- Honeywell International Inc
- Neogen Chemicals Ltd
- Gulf Resources Inc
- Tosoh Corporation
- Jordan Bromine Company
- TETRA Technologies Inc
- Tata Chemicals Ltd
- Shandong Haiwang Chemical Co
- Lanxess
- Sujay Chemicals
- Albemarle Corporation
Key Developments in Bromine Industry
- January 2022: ICL launched BromoQuel, a patented solution for bromine leakage incidents, enhancing safety and expanding its bromine business.
- August 2022: Albemarle Corporation restructured its bromine and lithium GBUs to meet growing customer demand and compete more effectively.
Future Outlook for Bromine Industry Market
The bromine industry is poised for continued growth, driven by innovation in applications and sustainable production methods. Strategic partnerships, acquisitions, and expansion into new markets will shape the industry's future, leading to significant market potential.
Bromine Industry Segmentation
-
1. Derivative
- 1.1. Organo Bromines
- 1.2. Bromide Salts
- 1.3. Hydrogen Bromide
-
2. Application
- 2.1. Biocides
- 2.2. Flame Retardants (FR)
- 2.3. Bromine-based Batteries
- 2.4. Clear Brine Fluids (CBF)
- 2.5. Other Applications
Bromine Industry Segmentation By Geography
-
1. Asia Pacific
- 1.1. China
- 1.2. India
- 1.3. Japan
- 1.4. South Korea
- 1.5. Rest of Asia Pacific
-
2. North America
- 2.1. United States
- 2.2. Canada
- 2.3. Mexico
-
3. Europe
- 3.1. Germany
- 3.2. United Kingdom
- 3.3. Italy
- 3.4. France
- 3.5. Rest of Europe
-
4. South America
- 4.1. Brazil
- 4.2. Argentina
- 4.3. Rest of South America
-
5. Middle East and Africa
- 5.1. Saudi Arabia
- 5.2. South Africa
- 5.3. Rest of Middle East and Africa
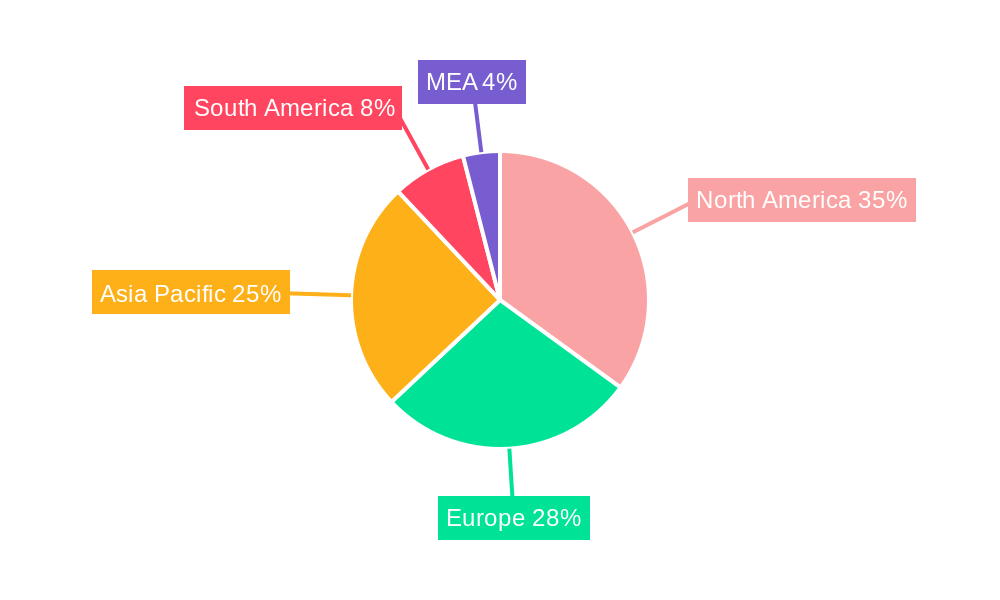
Bromine Industry Regional Market Share
Geographic Coverage of Bromine Industry
Bromine Industry REPORT HIGHLIGHTS
| Aspects | Details |
|---|---|
| Study Period | 2020-2034 |
| Base Year | 2025 |
| Estimated Year | 2026 |
| Forecast Period | 2026-2034 |
| Historical Period | 2020-2025 |
| Growth Rate | CAGR of 5% from 2020-2034 |
| Segmentation |
|
Table of Contents
- 1. Introduction
- 1.1. Research Scope
- 1.2. Market Segmentation
- 1.3. Research Objective
- 1.4. Definitions and Assumptions
- 2. Executive Summary
- 2.1. Market Snapshot
- 3. Market Dynamics
- 3.1. Market Drivers
- 3.2. Market Restrains
- 3.3. Market Trends
- 3.4. Market Opportunities
- 4. Market Factor Analysis
- 4.1. Porters Five Forces
- 4.1.1. Bargaining Power of Suppliers
- 4.1.2. Bargaining Power of Buyers
- 4.1.3. Threat of New Entrants
- 4.1.4. Threat of Substitutes
- 4.1.5. Competitive Rivalry
- 4.2. PESTEL analysis
- 4.3. BCG Analysis
- 4.3.1. Stars (High Growth, High Market Share)
- 4.3.2. Cash Cows (Low Growth, High Market Share)
- 4.3.3. Question Mark (High Growth, Low Market Share)
- 4.3.4. Dogs (Low Growth, Low Market Share)
- 4.4. Ansoff Matrix Analysis
- 4.5. Supply Chain Analysis
- 4.6. Regulatory Landscape
- 4.7. Current Market Potential and Opportunity Assessment (TAM–SAM–SOM Framework)
- 4.8. PRI Analyst Note
- 4.1. Porters Five Forces
- 5. Market Analysis, Insights and Forecast 2021-2033
- 5.1. Market Analysis, Insights and Forecast - by Derivative
- 5.1.1. Organo Bromines
- 5.1.2. Bromide Salts
- 5.1.3. Hydrogen Bromide
- 5.2. Market Analysis, Insights and Forecast - by Application
- 5.2.1. Biocides
- 5.2.2. Flame Retardants (FR)
- 5.2.3. Bromine-based Batteries
- 5.2.4. Clear Brine Fluids (CBF)
- 5.2.5. Other Applications
- 5.3. Market Analysis, Insights and Forecast - by Region
- 5.3.1. Asia Pacific
- 5.3.2. North America
- 5.3.3. Europe
- 5.3.4. South America
- 5.3.5. Middle East and Africa
- 5.1. Market Analysis, Insights and Forecast - by Derivative
- 6. Global Bromine Industry Analysis, Insights and Forecast, 2021-2033
- 6.1. Market Analysis, Insights and Forecast - by Derivative
- 6.1.1. Organo Bromines
- 6.1.2. Bromide Salts
- 6.1.3. Hydrogen Bromide
- 6.2. Market Analysis, Insights and Forecast - by Application
- 6.2.1. Biocides
- 6.2.2. Flame Retardants (FR)
- 6.2.3. Bromine-based Batteries
- 6.2.4. Clear Brine Fluids (CBF)
- 6.2.5. Other Applications
- 6.1. Market Analysis, Insights and Forecast - by Derivative
- 7. Asia Pacific Bromine Industry Analysis, Insights and Forecast, 2020-2032
- 7.1. Market Analysis, Insights and Forecast - by Derivative
- 7.1.1. Organo Bromines
- 7.1.2. Bromide Salts
- 7.1.3. Hydrogen Bromide
- 7.2. Market Analysis, Insights and Forecast - by Application
- 7.2.1. Biocides
- 7.2.2. Flame Retardants (FR)
- 7.2.3. Bromine-based Batteries
- 7.2.4. Clear Brine Fluids (CBF)
- 7.2.5. Other Applications
- 7.1. Market Analysis, Insights and Forecast - by Derivative
- 8. North America Bromine Industry Analysis, Insights and Forecast, 2020-2032
- 8.1. Market Analysis, Insights and Forecast - by Derivative
- 8.1.1. Organo Bromines
- 8.1.2. Bromide Salts
- 8.1.3. Hydrogen Bromide
- 8.2. Market Analysis, Insights and Forecast - by Application
- 8.2.1. Biocides
- 8.2.2. Flame Retardants (FR)
- 8.2.3. Bromine-based Batteries
- 8.2.4. Clear Brine Fluids (CBF)
- 8.2.5. Other Applications
- 8.1. Market Analysis, Insights and Forecast - by Derivative
- 9. Europe Bromine Industry Analysis, Insights and Forecast, 2020-2032
- 9.1. Market Analysis, Insights and Forecast - by Derivative
- 9.1.1. Organo Bromines
- 9.1.2. Bromide Salts
- 9.1.3. Hydrogen Bromide
- 9.2. Market Analysis, Insights and Forecast - by Application
- 9.2.1. Biocides
- 9.2.2. Flame Retardants (FR)
- 9.2.3. Bromine-based Batteries
- 9.2.4. Clear Brine Fluids (CBF)
- 9.2.5. Other Applications
- 9.1. Market Analysis, Insights and Forecast - by Derivative
- 10. South America Bromine Industry Analysis, Insights and Forecast, 2020-2032
- 10.1. Market Analysis, Insights and Forecast - by Derivative
- 10.1.1. Organo Bromines
- 10.1.2. Bromide Salts
- 10.1.3. Hydrogen Bromide
- 10.2. Market Analysis, Insights and Forecast - by Application
- 10.2.1. Biocides
- 10.2.2. Flame Retardants (FR)
- 10.2.3. Bromine-based Batteries
- 10.2.4. Clear Brine Fluids (CBF)
- 10.2.5. Other Applications
- 10.1. Market Analysis, Insights and Forecast - by Derivative
- 11. Middle East and Africa Bromine Industry Analysis, Insights and Forecast, 2020-2032
- 11.1. Market Analysis, Insights and Forecast - by Derivative
- 11.1.1. Organo Bromines
- 11.1.2. Bromide Salts
- 11.1.3. Hydrogen Bromide
- 11.2. Market Analysis, Insights and Forecast - by Application
- 11.2.1. Biocides
- 11.2.2. Flame Retardants (FR)
- 11.2.3. Bromine-based Batteries
- 11.2.4. Clear Brine Fluids (CBF)
- 11.2.5. Other Applications
- 11.1. Market Analysis, Insights and Forecast - by Derivative
- 12. Competitive Analysis
- 12.1. Company Profiles
- 12.1.1 ICL
- 12.1.1.1. Company Overview
- 12.1.1.2. Products
- 12.1.1.3. Company Financials
- 12.1.1.4. SWOT Analysis
- 12.1.2 Honeywell International Inc
- 12.1.2.1. Company Overview
- 12.1.2.2. Products
- 12.1.2.3. Company Financials
- 12.1.2.4. SWOT Analysis
- 12.1.3 Neogen Chemicals Ltd
- 12.1.3.1. Company Overview
- 12.1.3.2. Products
- 12.1.3.3. Company Financials
- 12.1.3.4. SWOT Analysis
- 12.1.4 Gulf Resources Inc
- 12.1.4.1. Company Overview
- 12.1.4.2. Products
- 12.1.4.3. Company Financials
- 12.1.4.4. SWOT Analysis
- 12.1.5 Tosoh Corporation
- 12.1.5.1. Company Overview
- 12.1.5.2. Products
- 12.1.5.3. Company Financials
- 12.1.5.4. SWOT Analysis
- 12.1.6 Jordan Bromine Company
- 12.1.6.1. Company Overview
- 12.1.6.2. Products
- 12.1.6.3. Company Financials
- 12.1.6.4. SWOT Analysis
- 12.1.7 TETRA Technologies Inc
- 12.1.7.1. Company Overview
- 12.1.7.2. Products
- 12.1.7.3. Company Financials
- 12.1.7.4. SWOT Analysis
- 12.1.8 Tata Chemicals Ltd
- 12.1.8.1. Company Overview
- 12.1.8.2. Products
- 12.1.8.3. Company Financials
- 12.1.8.4. SWOT Analysis
- 12.1.9 Shandong Haiwang Chemical Co
- 12.1.9.1. Company Overview
- 12.1.9.2. Products
- 12.1.9.3. Company Financials
- 12.1.9.4. SWOT Analysis
- 12.1.10 Lanxess
- 12.1.10.1. Company Overview
- 12.1.10.2. Products
- 12.1.10.3. Company Financials
- 12.1.10.4. SWOT Analysis
- 12.1.11 Sujay Chemicals
- 12.1.11.1. Company Overview
- 12.1.11.2. Products
- 12.1.11.3. Company Financials
- 12.1.11.4. SWOT Analysis
- 12.1.12 Albemarle Corporation
- 12.1.12.1. Company Overview
- 12.1.12.2. Products
- 12.1.12.3. Company Financials
- 12.1.12.4. SWOT Analysis
- 12.1.1 ICL
- 12.2. Market Entropy
- 12.2.1 Company's Key Areas Served
- 12.2.2 Recent Developments
- 12.3. Company Market Share Analysis 2025
- 12.3.1 Top 5 Companies Market Share Analysis
- 12.3.2 Top 3 Companies Market Share Analysis
- 12.4. List of Potential Customers
- 13. Research Methodology
List of Figures
- Figure 1: Global Bromine Industry Revenue Breakdown (Billion, %) by Region 2025 & 2033
- Figure 2: Global Bromine Industry Volume Breakdown (K Tons, %) by Region 2025 & 2033
- Figure 3: Asia Pacific Bromine Industry Revenue (Billion), by Derivative 2025 & 2033
- Figure 4: Asia Pacific Bromine Industry Volume (K Tons), by Derivative 2025 & 2033
- Figure 5: Asia Pacific Bromine Industry Revenue Share (%), by Derivative 2025 & 2033
- Figure 6: Asia Pacific Bromine Industry Volume Share (%), by Derivative 2025 & 2033
- Figure 7: Asia Pacific Bromine Industry Revenue (Billion), by Application 2025 & 2033
- Figure 8: Asia Pacific Bromine Industry Volume (K Tons), by Application 2025 & 2033
- Figure 9: Asia Pacific Bromine Industry Revenue Share (%), by Application 2025 & 2033
- Figure 10: Asia Pacific Bromine Industry Volume Share (%), by Application 2025 & 2033
- Figure 11: Asia Pacific Bromine Industry Revenue (Billion), by Country 2025 & 2033
- Figure 12: Asia Pacific Bromine Industry Volume (K Tons), by Country 2025 & 2033
- Figure 13: Asia Pacific Bromine Industry Revenue Share (%), by Country 2025 & 2033
- Figure 14: Asia Pacific Bromine Industry Volume Share (%), by Country 2025 & 2033
- Figure 15: North America Bromine Industry Revenue (Billion), by Derivative 2025 & 2033
- Figure 16: North America Bromine Industry Volume (K Tons), by Derivative 2025 & 2033
- Figure 17: North America Bromine Industry Revenue Share (%), by Derivative 2025 & 2033
- Figure 18: North America Bromine Industry Volume Share (%), by Derivative 2025 & 2033
- Figure 19: North America Bromine Industry Revenue (Billion), by Application 2025 & 2033
- Figure 20: North America Bromine Industry Volume (K Tons), by Application 2025 & 2033
- Figure 21: North America Bromine Industry Revenue Share (%), by Application 2025 & 2033
- Figure 22: North America Bromine Industry Volume Share (%), by Application 2025 & 2033
- Figure 23: North America Bromine Industry Revenue (Billion), by Country 2025 & 2033
- Figure 24: North America Bromine Industry Volume (K Tons), by Country 2025 & 2033
- Figure 25: North America Bromine Industry Revenue Share (%), by Country 2025 & 2033
- Figure 26: North America Bromine Industry Volume Share (%), by Country 2025 & 2033
- Figure 27: Europe Bromine Industry Revenue (Billion), by Derivative 2025 & 2033
- Figure 28: Europe Bromine Industry Volume (K Tons), by Derivative 2025 & 2033
- Figure 29: Europe Bromine Industry Revenue Share (%), by Derivative 2025 & 2033
- Figure 30: Europe Bromine Industry Volume Share (%), by Derivative 2025 & 2033
- Figure 31: Europe Bromine Industry Revenue (Billion), by Application 2025 & 2033
- Figure 32: Europe Bromine Industry Volume (K Tons), by Application 2025 & 2033
- Figure 33: Europe Bromine Industry Revenue Share (%), by Application 2025 & 2033
- Figure 34: Europe Bromine Industry Volume Share (%), by Application 2025 & 2033
- Figure 35: Europe Bromine Industry Revenue (Billion), by Country 2025 & 2033
- Figure 36: Europe Bromine Industry Volume (K Tons), by Country 2025 & 2033
- Figure 37: Europe Bromine Industry Revenue Share (%), by Country 2025 & 2033
- Figure 38: Europe Bromine Industry Volume Share (%), by Country 2025 & 2033
- Figure 39: South America Bromine Industry Revenue (Billion), by Derivative 2025 & 2033
- Figure 40: South America Bromine Industry Volume (K Tons), by Derivative 2025 & 2033
- Figure 41: South America Bromine Industry Revenue Share (%), by Derivative 2025 & 2033
- Figure 42: South America Bromine Industry Volume Share (%), by Derivative 2025 & 2033
- Figure 43: South America Bromine Industry Revenue (Billion), by Application 2025 & 2033
- Figure 44: South America Bromine Industry Volume (K Tons), by Application 2025 & 2033
- Figure 45: South America Bromine Industry Revenue Share (%), by Application 2025 & 2033
- Figure 46: South America Bromine Industry Volume Share (%), by Application 2025 & 2033
- Figure 47: South America Bromine Industry Revenue (Billion), by Country 2025 & 2033
- Figure 48: South America Bromine Industry Volume (K Tons), by Country 2025 & 2033
- Figure 49: South America Bromine Industry Revenue Share (%), by Country 2025 & 2033
- Figure 50: South America Bromine Industry Volume Share (%), by Country 2025 & 2033
- Figure 51: Middle East and Africa Bromine Industry Revenue (Billion), by Derivative 2025 & 2033
- Figure 52: Middle East and Africa Bromine Industry Volume (K Tons), by Derivative 2025 & 2033
- Figure 53: Middle East and Africa Bromine Industry Revenue Share (%), by Derivative 2025 & 2033
- Figure 54: Middle East and Africa Bromine Industry Volume Share (%), by Derivative 2025 & 2033
- Figure 55: Middle East and Africa Bromine Industry Revenue (Billion), by Application 2025 & 2033
- Figure 56: Middle East and Africa Bromine Industry Volume (K Tons), by Application 2025 & 2033
- Figure 57: Middle East and Africa Bromine Industry Revenue Share (%), by Application 2025 & 2033
- Figure 58: Middle East and Africa Bromine Industry Volume Share (%), by Application 2025 & 2033
- Figure 59: Middle East and Africa Bromine Industry Revenue (Billion), by Country 2025 & 2033
- Figure 60: Middle East and Africa Bromine Industry Volume (K Tons), by Country 2025 & 2033
- Figure 61: Middle East and Africa Bromine Industry Revenue Share (%), by Country 2025 & 2033
- Figure 62: Middle East and Africa Bromine Industry Volume Share (%), by Country 2025 & 2033
List of Tables
- Table 1: Global Bromine Industry Revenue Billion Forecast, by Derivative 2020 & 2033
- Table 2: Global Bromine Industry Volume K Tons Forecast, by Derivative 2020 & 2033
- Table 3: Global Bromine Industry Revenue Billion Forecast, by Application 2020 & 2033
- Table 4: Global Bromine Industry Volume K Tons Forecast, by Application 2020 & 2033
- Table 5: Global Bromine Industry Revenue Billion Forecast, by Region 2020 & 2033
- Table 6: Global Bromine Industry Volume K Tons Forecast, by Region 2020 & 2033
- Table 7: Global Bromine Industry Revenue Billion Forecast, by Derivative 2020 & 2033
- Table 8: Global Bromine Industry Volume K Tons Forecast, by Derivative 2020 & 2033
- Table 9: Global Bromine Industry Revenue Billion Forecast, by Application 2020 & 2033
- Table 10: Global Bromine Industry Volume K Tons Forecast, by Application 2020 & 2033
- Table 11: Global Bromine Industry Revenue Billion Forecast, by Country 2020 & 2033
- Table 12: Global Bromine Industry Volume K Tons Forecast, by Country 2020 & 2033
- Table 13: China Bromine Industry Revenue (Billion) Forecast, by Application 2020 & 2033
- Table 14: China Bromine Industry Volume (K Tons) Forecast, by Application 2020 & 2033
- Table 15: India Bromine Industry Revenue (Billion) Forecast, by Application 2020 & 2033
- Table 16: India Bromine Industry Volume (K Tons) Forecast, by Application 2020 & 2033
- Table 17: Japan Bromine Industry Revenue (Billion) Forecast, by Application 2020 & 2033
- Table 18: Japan Bromine Industry Volume (K Tons) Forecast, by Application 2020 & 2033
- Table 19: South Korea Bromine Industry Revenue (Billion) Forecast, by Application 2020 & 2033
- Table 20: South Korea Bromine Industry Volume (K Tons) Forecast, by Application 2020 & 2033
- Table 21: Rest of Asia Pacific Bromine Industry Revenue (Billion) Forecast, by Application 2020 & 2033
- Table 22: Rest of Asia Pacific Bromine Industry Volume (K Tons) Forecast, by Application 2020 & 2033
- Table 23: Global Bromine Industry Revenue Billion Forecast, by Derivative 2020 & 2033
- Table 24: Global Bromine Industry Volume K Tons Forecast, by Derivative 2020 & 2033
- Table 25: Global Bromine Industry Revenue Billion Forecast, by Application 2020 & 2033
- Table 26: Global Bromine Industry Volume K Tons Forecast, by Application 2020 & 2033
- Table 27: Global Bromine Industry Revenue Billion Forecast, by Country 2020 & 2033
- Table 28: Global Bromine Industry Volume K Tons Forecast, by Country 2020 & 2033
- Table 29: United States Bromine Industry Revenue (Billion) Forecast, by Application 2020 & 2033
- Table 30: United States Bromine Industry Volume (K Tons) Forecast, by Application 2020 & 2033
- Table 31: Canada Bromine Industry Revenue (Billion) Forecast, by Application 2020 & 2033
- Table 32: Canada Bromine Industry Volume (K Tons) Forecast, by Application 2020 & 2033
- Table 33: Mexico Bromine Industry Revenue (Billion) Forecast, by Application 2020 & 2033
- Table 34: Mexico Bromine Industry Volume (K Tons) Forecast, by Application 2020 & 2033
- Table 35: Global Bromine Industry Revenue Billion Forecast, by Derivative 2020 & 2033
- Table 36: Global Bromine Industry Volume K Tons Forecast, by Derivative 2020 & 2033
- Table 37: Global Bromine Industry Revenue Billion Forecast, by Application 2020 & 2033
- Table 38: Global Bromine Industry Volume K Tons Forecast, by Application 2020 & 2033
- Table 39: Global Bromine Industry Revenue Billion Forecast, by Country 2020 & 2033
- Table 40: Global Bromine Industry Volume K Tons Forecast, by Country 2020 & 2033
- Table 41: Germany Bromine Industry Revenue (Billion) Forecast, by Application 2020 & 2033
- Table 42: Germany Bromine Industry Volume (K Tons) Forecast, by Application 2020 & 2033
- Table 43: United Kingdom Bromine Industry Revenue (Billion) Forecast, by Application 2020 & 2033
- Table 44: United Kingdom Bromine Industry Volume (K Tons) Forecast, by Application 2020 & 2033
- Table 45: Italy Bromine Industry Revenue (Billion) Forecast, by Application 2020 & 2033
- Table 46: Italy Bromine Industry Volume (K Tons) Forecast, by Application 2020 & 2033
- Table 47: France Bromine Industry Revenue (Billion) Forecast, by Application 2020 & 2033
- Table 48: France Bromine Industry Volume (K Tons) Forecast, by Application 2020 & 2033
- Table 49: Rest of Europe Bromine Industry Revenue (Billion) Forecast, by Application 2020 & 2033
- Table 50: Rest of Europe Bromine Industry Volume (K Tons) Forecast, by Application 2020 & 2033
- Table 51: Global Bromine Industry Revenue Billion Forecast, by Derivative 2020 & 2033
- Table 52: Global Bromine Industry Volume K Tons Forecast, by Derivative 2020 & 2033
- Table 53: Global Bromine Industry Revenue Billion Forecast, by Application 2020 & 2033
- Table 54: Global Bromine Industry Volume K Tons Forecast, by Application 2020 & 2033
- Table 55: Global Bromine Industry Revenue Billion Forecast, by Country 2020 & 2033
- Table 56: Global Bromine Industry Volume K Tons Forecast, by Country 2020 & 2033
- Table 57: Brazil Bromine Industry Revenue (Billion) Forecast, by Application 2020 & 2033
- Table 58: Brazil Bromine Industry Volume (K Tons) Forecast, by Application 2020 & 2033
- Table 59: Argentina Bromine Industry Revenue (Billion) Forecast, by Application 2020 & 2033
- Table 60: Argentina Bromine Industry Volume (K Tons) Forecast, by Application 2020 & 2033
- Table 61: Rest of South America Bromine Industry Revenue (Billion) Forecast, by Application 2020 & 2033
- Table 62: Rest of South America Bromine Industry Volume (K Tons) Forecast, by Application 2020 & 2033
- Table 63: Global Bromine Industry Revenue Billion Forecast, by Derivative 2020 & 2033
- Table 64: Global Bromine Industry Volume K Tons Forecast, by Derivative 2020 & 2033
- Table 65: Global Bromine Industry Revenue Billion Forecast, by Application 2020 & 2033
- Table 66: Global Bromine Industry Volume K Tons Forecast, by Application 2020 & 2033
- Table 67: Global Bromine Industry Revenue Billion Forecast, by Country 2020 & 2033
- Table 68: Global Bromine Industry Volume K Tons Forecast, by Country 2020 & 2033
- Table 69: Saudi Arabia Bromine Industry Revenue (Billion) Forecast, by Application 2020 & 2033
- Table 70: Saudi Arabia Bromine Industry Volume (K Tons) Forecast, by Application 2020 & 2033
- Table 71: South Africa Bromine Industry Revenue (Billion) Forecast, by Application 2020 & 2033
- Table 72: South Africa Bromine Industry Volume (K Tons) Forecast, by Application 2020 & 2033
- Table 73: Rest of Middle East and Africa Bromine Industry Revenue (Billion) Forecast, by Application 2020 & 2033
- Table 74: Rest of Middle East and Africa Bromine Industry Volume (K Tons) Forecast, by Application 2020 & 2033
Frequently Asked Questions
1. What is the projected Compound Annual Growth Rate (CAGR) of the Bromine Industry?
The projected CAGR is approximately 5%.
2. Which companies are prominent players in the Bromine Industry?
Key companies in the market include ICL, Honeywell International Inc, Neogen Chemicals Ltd, Gulf Resources Inc, Tosoh Corporation, Jordan Bromine Company, TETRA Technologies Inc, Tata Chemicals Ltd, Shandong Haiwang Chemical Co, Lanxess, Sujay Chemicals, Albemarle Corporation.
3. What are the main segments of the Bromine Industry?
The market segments include Derivative, Application.
4. Can you provide details about the market size?
The market size is estimated to be USD 2.6 Billion as of 2022.
5. What are some drivers contributing to market growth?
The Increasing Demand of Bromine in Water Treatment Applications; Other Drivers.
6. What are the notable trends driving market growth?
Increasing Demand for Flame Retardants.
7. Are there any restraints impacting market growth?
Emergence of Non-halogenated Flame Retardants; Other Restraints.
8. Can you provide examples of recent developments in the market?
January 2022: ICL introduced the new BromoQuel, a patented solution that redefines bromine leakage incident treatment to expand its bromine business with safety.
9. What pricing options are available for accessing the report?
Pricing options include single-user, multi-user, and enterprise licenses priced at USD 3,950, USD 4,950, and USD 6,950 respectively.
10. Is the market size provided in terms of value or volume?
The market size is provided in terms of value, measured in Billion and volume, measured in K Tons.
11. Are there any specific market keywords associated with the report?
Yes, the market keyword associated with the report is "Bromine Industry," which aids in identifying and referencing the specific market segment covered.
12. How do I determine which pricing option suits my needs best?
The pricing options vary based on user requirements and access needs. Individual users may opt for single-user licenses, while businesses requiring broader access may choose multi-user or enterprise licenses for cost-effective access to the report.
13. Are there any additional resources or data provided in the Bromine Industry report?
While the report offers comprehensive insights, it's advisable to review the specific contents or supplementary materials provided to ascertain if additional resources or data are available.
14. How can I stay updated on further developments or reports in the Bromine Industry?
To stay informed about further developments, trends, and reports in the Bromine Industry, consider subscribing to industry newsletters, following relevant companies and organizations, or regularly checking reputable industry news sources and publications.
Methodology
Step 1 - Identification of Relevant Samples Size from Population Database


Step 2 - Approaches for Defining Global Market Size (Value, Volume* & Price*)

Note*: In applicable scenarios
Step 3 - Data Sources
Primary Research
- Web Analytics
- Survey Reports
- Research Institute
- Latest Research Reports
- Opinion Leaders
Secondary Research
- Annual Reports
- White Paper
- Latest Press Release
- Industry Association
- Paid Database
- Investor Presentations

Step 4 - Data Triangulation
Involves using different sources of information in order to increase the validity of a study
These sources are likely to be stakeholders in a program - participants, other researchers, program staff, other community members, and so on.
Then we put all data in single framework & apply various statistical tools to find out the dynamic on the market.
During the analysis stage, feedback from the stakeholder groups would be compared to determine areas of agreement as well as areas of divergence