

Key Insights
The Benzene, Toluene, and Xylene (BTX) market is projected for significant expansion, estimated at $8.07 billion by 2025, with a projected Compound Annual Growth Rate (CAGR) of 4.6%. This robust growth is primarily fueled by increasing demand for petrochemicals across key sectors including paints & coatings, adhesives & inks, and the rapidly evolving plastics industry. Furthermore, escalating production of essential downstream products like ethylbenzene, cyclohexane, and various alkylbenzenes directly contributes to elevated BTX consumption. The burgeoning economic development in emerging economies, particularly within the Asia-Pacific region, also plays a pivotal role in driving market expansion. The market is segmented by product type (Benzene, Toluene, Xylene, with detailed analysis of xylene isomers) and application, providing comprehensive market insights. Notably, the demand for para-xylene, a critical monomer for PET production, is expected to lead growth among xylene isomers, driven by sustained expansion in the packaging and textile industries.
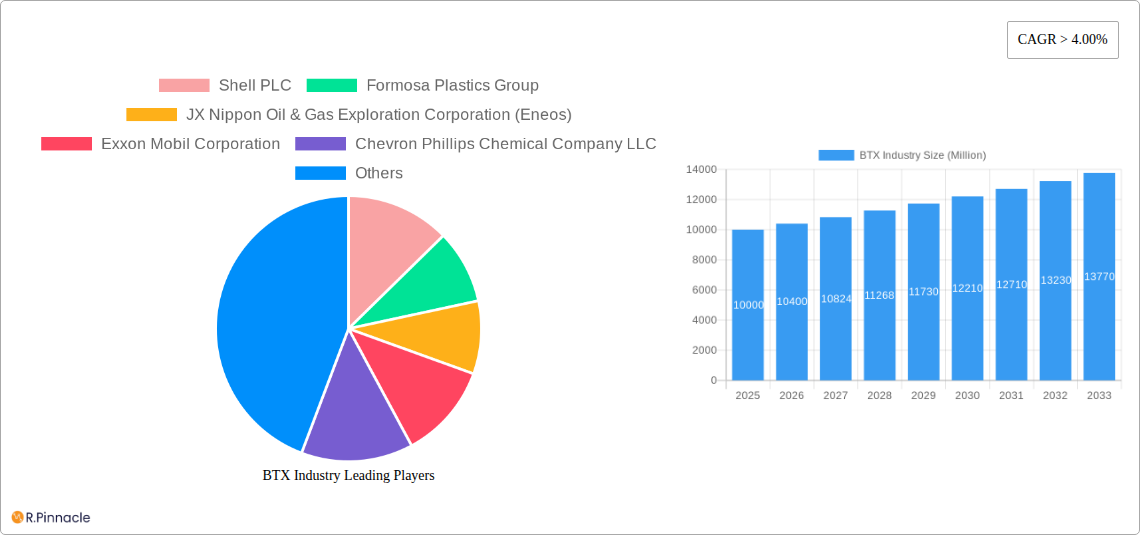
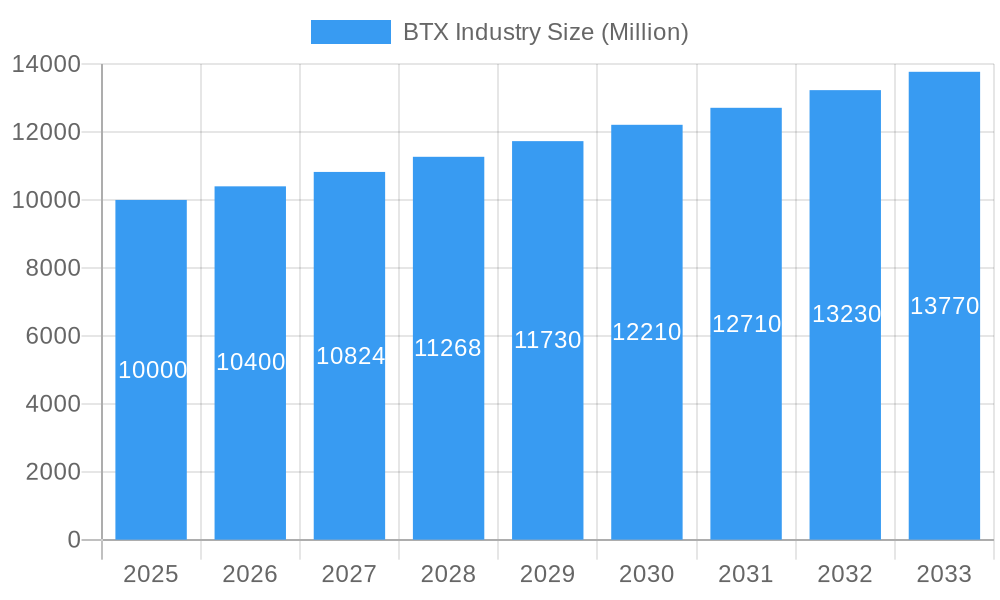
BTX Industry Market Size (In Billion)
Market growth faces certain headwinds. Volatility in crude oil prices directly affects BTX production costs and subsequent market pricing. Additionally, stringent environmental regulations concerning volatile organic compound (VOC) emissions present challenges, requiring substantial investment in advanced, eco-friendly production technologies. These factors necessitate strategic adaptation from market participants to ensure sustained profitability and operational sustainability. The competitive landscape, characterized by key players such as Shell, ExxonMobil, and Sinopec, also influences market dynamics. The Asia-Pacific region is expected to retain its market leadership, propelled by rapid industrialization and expanding petrochemical infrastructure. Projections indicate continued market growth through 2033, with potential moderation influenced by prevailing macroeconomic conditions.
BTX Industry Company Market Share
BTX Industry Market Report: 2019-2033 Forecast
This comprehensive report provides a detailed analysis of the global BTX (Benzene, Toluene, Xylene) industry, offering invaluable insights for industry professionals, investors, and strategic decision-makers. The report covers the period from 2019 to 2033, with a focus on the forecast period of 2025-2033 and a base year of 2025. The market size exceeds $XX Million.
Keywords: BTX Market, Benzene Market, Toluene Market, Xylene Market, Ortho-xylene, Meta-xylene, Para-xylene, Ethylbenzene, Cyclohexane, Alkylbenzene, Cumene, Nitrobenzene, Paints and Coatings, Adhesives and Inks, Explosives, Chemical Industry, Solvent, Monomer, Shell, Formosa Plastics, Eneos, ExxonMobil, Chevron Phillips Chemical, YEOCHUN NCC, IRPC, INEOS, SINOPEC, Reliance Industries, CNPC, CNOOC, BASF, OCI, TotalEnergies, SABIC, Dow, Mitsubishi Gas Chemical, GS Caltex, JFE Chemical, SK Innovation, BP, S-OIL, Market Analysis, Market Forecast, Industry Trends, Market Growth, Competitive Landscape.
BTX Industry Market Structure & Innovation Trends
This section analyzes the competitive landscape of the BTX industry, examining market concentration, innovation drivers, regulatory frameworks, and mergers & acquisitions (M&A) activity. The market is moderately concentrated, with key players like Shell PLC, Formosa Plastics Group, and Exxon Mobil Corporation holding significant market shares. The combined market share of the top 5 players is estimated to be around 35%. Innovation is driven by the demand for high-performance materials and sustainable production processes. Stringent environmental regulations are shaping industry practices, pushing companies towards cleaner production technologies. Product substitution is a factor, with bio-based alternatives emerging for some applications. M&A activity has been relatively moderate in recent years, with deal values averaging around $XX Million annually. The report details specific M&A transactions and their impact on market dynamics.
- Market Concentration: Moderately concentrated, with top 5 players holding ~35% market share.
- Innovation Drivers: Demand for high-performance materials and sustainable production.
- Regulatory Frameworks: Stringent environmental regulations driving cleaner technologies.
- Product Substitutes: Emergence of bio-based alternatives.
- M&A Activity: Moderate, with average annual deal values of ~$XX Million.
BTX Industry Market Dynamics & Trends
The global BTX market is experiencing robust growth, driven by increasing demand from various downstream industries. The Compound Annual Growth Rate (CAGR) is projected to be XX% during the forecast period (2025-2033). Technological advancements, particularly in catalyst technology and process optimization, are enhancing production efficiency and product quality. Shifting consumer preferences towards sustainable and environmentally friendly products are also influencing market dynamics. Competitive rivalry is intense, with companies investing heavily in R&D and capacity expansions to gain a competitive edge. Market penetration of new applications is a key growth driver, especially in emerging economies.
Dominant Regions & Segments in BTX Industry
Asia-Pacific dominates the BTX market, driven by robust economic growth and substantial downstream demand in countries like China and India. Within the product segments, Para-xylene exhibits the highest growth potential due to its extensive use in the polyester industry. In terms of applications, the solvent segment for xylene and the ethylbenzene segment for benzene demonstrate significant growth.
- Key Drivers in Asia-Pacific: Strong economic growth, expanding downstream industries, favorable government policies.
- Para-xylene Dominance: Driven by high demand in the polyester industry.
- High-Growth Applications: Solvent (Xylene) and Ethylbenzene (Benzene).
BTX Industry Product Innovations
Recent innovations focus on enhancing production efficiency, improving product quality, and reducing environmental impact. New catalyst technologies are improving yields and reducing energy consumption. Companies are also developing innovative applications for BTX derivatives to expand market reach. These innovations are driving competitiveness and shaping future market trends.
Report Scope & Segmentation Analysis
The report comprehensively segments the BTX market by Type (Benzene, Toluene, Xylene – including its isomers Ortho, Meta, and Para) and Product Application (Benzene: Ethylbenzene, Cyclohexane, Alkylbenzene, Cumene, Nitrobenzene, Other Applications; Toluene: Paints and Coatings, Adhesives and Inks, Explosives, Chemical Industry; Xylene: Solvent, Monomer). Each segment's growth projections, market sizes, and competitive dynamics are analyzed in detail. For example, the ethylbenzene segment within benzene applications is expected to witness significant growth due to its use in styrene production.
Key Drivers of BTX Industry Growth
Several factors are driving growth, including robust demand from downstream industries like plastics, fibers, and solvents; technological advancements leading to improved production efficiency; and increasing investments in new production capacities. Government policies supporting infrastructure development and industrial growth further contribute to the expansion of the BTX market.
Challenges in the BTX Industry Sector
The BTX industry faces challenges such as volatile raw material prices, stringent environmental regulations increasing production costs, and intense competition among major players. Supply chain disruptions and fluctuations in global demand also pose significant risks to the industry's profitability. These factors impact overall market stability and growth.
Emerging Opportunities in BTX Industry
Emerging opportunities include the growing demand for sustainable and bio-based BTX alternatives, the expansion of the BTX market in developing economies, and the development of innovative applications in high-growth sectors such as electronics and renewable energy. These present significant potential for future market expansion.
Leading Players in the BTX Industry Market
- Shell PLC
- Formosa Plastics Group
- JX Nippon Oil & Gas Exploration Corporation (Eneos)
- Exxon Mobil Corporation
- Chevron Phillips Chemical Company LLC
- YEOCHUN NCC CO LTD
- IRPC Public Company Limited
- INEOS
- China Petroleum & Chemical Corporation Limited (SINOPEC)
- Reliance Industries Limited
- China National Petroleum Corporation
- China National Offshore Oil Corporation (CNOOC)
- BASF SE
- OCI LTD
- Totalenergies
- SABIC
- Dow
- MITSUBISHI GAS CHEMICAL COMPANY INC
- GS Caltex Corporation
- JFE Chemical Corporation
- SK Innovation Co Ltd
- BP PLC
- S-OIL Corporation
Key Developments in BTX Industry
- 2022 Q4: Shell PLC announced a new investment in a BTX production facility in Singapore.
- 2023 Q1: Formosa Plastics Group completed an expansion of its xylene production capacity in Taiwan.
- 2023 Q2: ExxonMobil partnered with a technology provider to develop a new catalyst for BTX production. (Further developments detailed within the full report)
Future Outlook for BTX Industry Market
The BTX industry is poised for continued growth, driven by ongoing demand from various downstream sectors and technological innovations. Strategic investments in capacity expansion, R&D, and sustainable production technologies will play a key role in shaping the future of the market. Focus on high-growth segments and emerging applications will be crucial for achieving sustained market expansion.
BTX Industry Segmentation
-
1. Type
- 1.1. Benzene
- 1.2. Toluene
-
1.3. Xylene
- 1.3.1. Ortho-xylene
- 1.3.2. Meta-xylene
- 1.3.3. Para-xylene
-
2. Product Application
-
2.1. Benzene By Application
- 2.1.1. Ethylbenzene
- 2.1.2. Cyclohexane
- 2.1.3. Alkylbenzene
- 2.1.4. Cumene
- 2.1.5. Nitrobenzene
- 2.1.6. Other Applications
-
2.2. Toluene By Application
- 2.2.1. Paints and Coatings
- 2.2.2. Adhesives and Inks
- 2.2.3. Explosives
- 2.2.4. Chemical Industry
-
2.3. Xylene By Application
- 2.3.1. Solvent
- 2.3.2. Monomer
-
2.1. Benzene By Application
BTX Industry Segmentation By Geography
-
1. Asia Pacific
- 1.1. China
- 1.2. India
- 1.3. Japan
- 1.4. South Korea
- 1.5. Rest of Asia Pacific
-
2. North America
- 2.1. United States
- 2.2. Canada
- 2.3. Mexico
-
3. Europe
- 3.1. Germany
- 3.2. United Kingdom
- 3.3. Italy
- 3.4. France
- 3.5. Rest of Europe
-
4. South America
- 4.1. Brazil
- 4.2. Argentina
- 4.3. Rest of South America
-
5. Middle East and Africa
- 5.1. Saudi Arabia
- 5.2. South Africa
- 5.3. Rest of Middle East and Africa
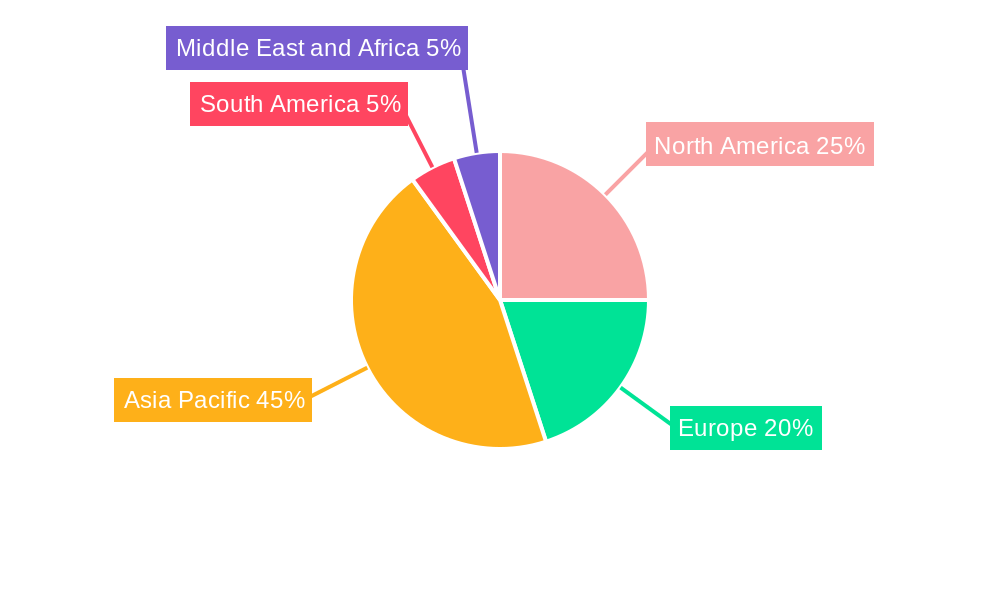
BTX Industry Regional Market Share
Geographic Coverage of BTX Industry
BTX Industry REPORT HIGHLIGHTS
| Aspects | Details |
|---|---|
| Study Period | 2020-2034 |
| Base Year | 2025 |
| Estimated Year | 2026 |
| Forecast Period | 2026-2034 |
| Historical Period | 2020-2025 |
| Growth Rate | CAGR of 4.6% from 2020-2034 |
| Segmentation |
|
Table of Contents
- 1. Introduction
- 1.1. Research Scope
- 1.2. Market Segmentation
- 1.3. Research Objective
- 1.4. Definitions and Assumptions
- 2. Executive Summary
- 2.1. Market Snapshot
- 3. Market Dynamics
- 3.1. Market Drivers
- 3.2. Market Restrains
- 3.3. Market Trends
- 3.4. Market Opportunities
- 4. Market Factor Analysis
- 4.1. Porters Five Forces
- 4.1.1. Bargaining Power of Suppliers
- 4.1.2. Bargaining Power of Buyers
- 4.1.3. Threat of New Entrants
- 4.1.4. Threat of Substitutes
- 4.1.5. Competitive Rivalry
- 4.2. PESTEL analysis
- 4.3. BCG Analysis
- 4.3.1. Stars (High Growth, High Market Share)
- 4.3.2. Cash Cows (Low Growth, High Market Share)
- 4.3.3. Question Mark (High Growth, Low Market Share)
- 4.3.4. Dogs (Low Growth, Low Market Share)
- 4.4. Ansoff Matrix Analysis
- 4.5. Supply Chain Analysis
- 4.6. Regulatory Landscape
- 4.7. Current Market Potential and Opportunity Assessment (TAM–SAM–SOM Framework)
- 4.8. PRI Analyst Note
- 4.1. Porters Five Forces
- 5. Market Analysis, Insights and Forecast 2021-2033
- 5.1. Market Analysis, Insights and Forecast - by Type
- 5.1.1. Benzene
- 5.1.2. Toluene
- 5.1.3. Xylene
- 5.1.3.1. Ortho-xylene
- 5.1.3.2. Meta-xylene
- 5.1.3.3. Para-xylene
- 5.2. Market Analysis, Insights and Forecast - by Product Application
- 5.2.1. Benzene By Application
- 5.2.1.1. Ethylbenzene
- 5.2.1.2. Cyclohexane
- 5.2.1.3. Alkylbenzene
- 5.2.1.4. Cumene
- 5.2.1.5. Nitrobenzene
- 5.2.1.6. Other Applications
- 5.2.2. Toluene By Application
- 5.2.2.1. Paints and Coatings
- 5.2.2.2. Adhesives and Inks
- 5.2.2.3. Explosives
- 5.2.2.4. Chemical Industry
- 5.2.3. Xylene By Application
- 5.2.3.1. Solvent
- 5.2.3.2. Monomer
- 5.2.1. Benzene By Application
- 5.3. Market Analysis, Insights and Forecast - by Region
- 5.3.1. Asia Pacific
- 5.3.2. North America
- 5.3.3. Europe
- 5.3.4. South America
- 5.3.5. Middle East and Africa
- 5.1. Market Analysis, Insights and Forecast - by Type
- 6. Global BTX Industry Analysis, Insights and Forecast, 2021-2033
- 6.1. Market Analysis, Insights and Forecast - by Type
- 6.1.1. Benzene
- 6.1.2. Toluene
- 6.1.3. Xylene
- 6.1.3.1. Ortho-xylene
- 6.1.3.2. Meta-xylene
- 6.1.3.3. Para-xylene
- 6.2. Market Analysis, Insights and Forecast - by Product Application
- 6.2.1. Benzene By Application
- 6.2.1.1. Ethylbenzene
- 6.2.1.2. Cyclohexane
- 6.2.1.3. Alkylbenzene
- 6.2.1.4. Cumene
- 6.2.1.5. Nitrobenzene
- 6.2.1.6. Other Applications
- 6.2.2. Toluene By Application
- 6.2.2.1. Paints and Coatings
- 6.2.2.2. Adhesives and Inks
- 6.2.2.3. Explosives
- 6.2.2.4. Chemical Industry
- 6.2.3. Xylene By Application
- 6.2.3.1. Solvent
- 6.2.3.2. Monomer
- 6.2.1. Benzene By Application
- 6.1. Market Analysis, Insights and Forecast - by Type
- 7. Asia Pacific BTX Industry Analysis, Insights and Forecast, 2020-2032
- 7.1. Market Analysis, Insights and Forecast - by Type
- 7.1.1. Benzene
- 7.1.2. Toluene
- 7.1.3. Xylene
- 7.1.3.1. Ortho-xylene
- 7.1.3.2. Meta-xylene
- 7.1.3.3. Para-xylene
- 7.2. Market Analysis, Insights and Forecast - by Product Application
- 7.2.1. Benzene By Application
- 7.2.1.1. Ethylbenzene
- 7.2.1.2. Cyclohexane
- 7.2.1.3. Alkylbenzene
- 7.2.1.4. Cumene
- 7.2.1.5. Nitrobenzene
- 7.2.1.6. Other Applications
- 7.2.2. Toluene By Application
- 7.2.2.1. Paints and Coatings
- 7.2.2.2. Adhesives and Inks
- 7.2.2.3. Explosives
- 7.2.2.4. Chemical Industry
- 7.2.3. Xylene By Application
- 7.2.3.1. Solvent
- 7.2.3.2. Monomer
- 7.2.1. Benzene By Application
- 7.1. Market Analysis, Insights and Forecast - by Type
- 8. North America BTX Industry Analysis, Insights and Forecast, 2020-2032
- 8.1. Market Analysis, Insights and Forecast - by Type
- 8.1.1. Benzene
- 8.1.2. Toluene
- 8.1.3. Xylene
- 8.1.3.1. Ortho-xylene
- 8.1.3.2. Meta-xylene
- 8.1.3.3. Para-xylene
- 8.2. Market Analysis, Insights and Forecast - by Product Application
- 8.2.1. Benzene By Application
- 8.2.1.1. Ethylbenzene
- 8.2.1.2. Cyclohexane
- 8.2.1.3. Alkylbenzene
- 8.2.1.4. Cumene
- 8.2.1.5. Nitrobenzene
- 8.2.1.6. Other Applications
- 8.2.2. Toluene By Application
- 8.2.2.1. Paints and Coatings
- 8.2.2.2. Adhesives and Inks
- 8.2.2.3. Explosives
- 8.2.2.4. Chemical Industry
- 8.2.3. Xylene By Application
- 8.2.3.1. Solvent
- 8.2.3.2. Monomer
- 8.2.1. Benzene By Application
- 8.1. Market Analysis, Insights and Forecast - by Type
- 9. Europe BTX Industry Analysis, Insights and Forecast, 2020-2032
- 9.1. Market Analysis, Insights and Forecast - by Type
- 9.1.1. Benzene
- 9.1.2. Toluene
- 9.1.3. Xylene
- 9.1.3.1. Ortho-xylene
- 9.1.3.2. Meta-xylene
- 9.1.3.3. Para-xylene
- 9.2. Market Analysis, Insights and Forecast - by Product Application
- 9.2.1. Benzene By Application
- 9.2.1.1. Ethylbenzene
- 9.2.1.2. Cyclohexane
- 9.2.1.3. Alkylbenzene
- 9.2.1.4. Cumene
- 9.2.1.5. Nitrobenzene
- 9.2.1.6. Other Applications
- 9.2.2. Toluene By Application
- 9.2.2.1. Paints and Coatings
- 9.2.2.2. Adhesives and Inks
- 9.2.2.3. Explosives
- 9.2.2.4. Chemical Industry
- 9.2.3. Xylene By Application
- 9.2.3.1. Solvent
- 9.2.3.2. Monomer
- 9.2.1. Benzene By Application
- 9.1. Market Analysis, Insights and Forecast - by Type
- 10. South America BTX Industry Analysis, Insights and Forecast, 2020-2032
- 10.1. Market Analysis, Insights and Forecast - by Type
- 10.1.1. Benzene
- 10.1.2. Toluene
- 10.1.3. Xylene
- 10.1.3.1. Ortho-xylene
- 10.1.3.2. Meta-xylene
- 10.1.3.3. Para-xylene
- 10.2. Market Analysis, Insights and Forecast - by Product Application
- 10.2.1. Benzene By Application
- 10.2.1.1. Ethylbenzene
- 10.2.1.2. Cyclohexane
- 10.2.1.3. Alkylbenzene
- 10.2.1.4. Cumene
- 10.2.1.5. Nitrobenzene
- 10.2.1.6. Other Applications
- 10.2.2. Toluene By Application
- 10.2.2.1. Paints and Coatings
- 10.2.2.2. Adhesives and Inks
- 10.2.2.3. Explosives
- 10.2.2.4. Chemical Industry
- 10.2.3. Xylene By Application
- 10.2.3.1. Solvent
- 10.2.3.2. Monomer
- 10.2.1. Benzene By Application
- 10.1. Market Analysis, Insights and Forecast - by Type
- 11. Middle East and Africa BTX Industry Analysis, Insights and Forecast, 2020-2032
- 11.1. Market Analysis, Insights and Forecast - by Type
- 11.1.1. Benzene
- 11.1.2. Toluene
- 11.1.3. Xylene
- 11.1.3.1. Ortho-xylene
- 11.1.3.2. Meta-xylene
- 11.1.3.3. Para-xylene
- 11.2. Market Analysis, Insights and Forecast - by Product Application
- 11.2.1. Benzene By Application
- 11.2.1.1. Ethylbenzene
- 11.2.1.2. Cyclohexane
- 11.2.1.3. Alkylbenzene
- 11.2.1.4. Cumene
- 11.2.1.5. Nitrobenzene
- 11.2.1.6. Other Applications
- 11.2.2. Toluene By Application
- 11.2.2.1. Paints and Coatings
- 11.2.2.2. Adhesives and Inks
- 11.2.2.3. Explosives
- 11.2.2.4. Chemical Industry
- 11.2.3. Xylene By Application
- 11.2.3.1. Solvent
- 11.2.3.2. Monomer
- 11.2.1. Benzene By Application
- 11.1. Market Analysis, Insights and Forecast - by Type
- 12. Competitive Analysis
- 12.1. Company Profiles
- 12.1.1 Shell PLC
- 12.1.1.1. Company Overview
- 12.1.1.2. Products
- 12.1.1.3. Company Financials
- 12.1.1.4. SWOT Analysis
- 12.1.2 Formosa Plastics Group
- 12.1.2.1. Company Overview
- 12.1.2.2. Products
- 12.1.2.3. Company Financials
- 12.1.2.4. SWOT Analysis
- 12.1.3 JX Nippon Oil & Gas Exploration Corporation (Eneos)
- 12.1.3.1. Company Overview
- 12.1.3.2. Products
- 12.1.3.3. Company Financials
- 12.1.3.4. SWOT Analysis
- 12.1.4 Exxon Mobil Corporation
- 12.1.4.1. Company Overview
- 12.1.4.2. Products
- 12.1.4.3. Company Financials
- 12.1.4.4. SWOT Analysis
- 12.1.5 Chevron Phillips Chemical Company LLC
- 12.1.5.1. Company Overview
- 12.1.5.2. Products
- 12.1.5.3. Company Financials
- 12.1.5.4. SWOT Analysis
- 12.1.6 YEOCHUN NCC CO LTD*List Not Exhaustive
- 12.1.6.1. Company Overview
- 12.1.6.2. Products
- 12.1.6.3. Company Financials
- 12.1.6.4. SWOT Analysis
- 12.1.7 IRPC Public Company Limited
- 12.1.7.1. Company Overview
- 12.1.7.2. Products
- 12.1.7.3. Company Financials
- 12.1.7.4. SWOT Analysis
- 12.1.8 INEOS
- 12.1.8.1. Company Overview
- 12.1.8.2. Products
- 12.1.8.3. Company Financials
- 12.1.8.4. SWOT Analysis
- 12.1.9 China Petroleum & Chemical Corporation Limited (SINOPEC)
- 12.1.9.1. Company Overview
- 12.1.9.2. Products
- 12.1.9.3. Company Financials
- 12.1.9.4. SWOT Analysis
- 12.1.10 Reliance Industries Limited
- 12.1.10.1. Company Overview
- 12.1.10.2. Products
- 12.1.10.3. Company Financials
- 12.1.10.4. SWOT Analysis
- 12.1.11 China National Petroleum Corporation
- 12.1.11.1. Company Overview
- 12.1.11.2. Products
- 12.1.11.3. Company Financials
- 12.1.11.4. SWOT Analysis
- 12.1.12 China National Offshore Oil Corporation (CNOOC)
- 12.1.12.1. Company Overview
- 12.1.12.2. Products
- 12.1.12.3. Company Financials
- 12.1.12.4. SWOT Analysis
- 12.1.13 BASF SE
- 12.1.13.1. Company Overview
- 12.1.13.2. Products
- 12.1.13.3. Company Financials
- 12.1.13.4. SWOT Analysis
- 12.1.14 OCI LTD
- 12.1.14.1. Company Overview
- 12.1.14.2. Products
- 12.1.14.3. Company Financials
- 12.1.14.4. SWOT Analysis
- 12.1.15 Totalenergies
- 12.1.15.1. Company Overview
- 12.1.15.2. Products
- 12.1.15.3. Company Financials
- 12.1.15.4. SWOT Analysis
- 12.1.16 SABIC
- 12.1.16.1. Company Overview
- 12.1.16.2. Products
- 12.1.16.3. Company Financials
- 12.1.16.4. SWOT Analysis
- 12.1.17 Dow
- 12.1.17.1. Company Overview
- 12.1.17.2. Products
- 12.1.17.3. Company Financials
- 12.1.17.4. SWOT Analysis
- 12.1.18 MITSUBISHI GAS CHEMICAL COMPANY INC
- 12.1.18.1. Company Overview
- 12.1.18.2. Products
- 12.1.18.3. Company Financials
- 12.1.18.4. SWOT Analysis
- 12.1.19 GS Caltex Corporation
- 12.1.19.1. Company Overview
- 12.1.19.2. Products
- 12.1.19.3. Company Financials
- 12.1.19.4. SWOT Analysis
- 12.1.20 JFE Chemical Corporation
- 12.1.20.1. Company Overview
- 12.1.20.2. Products
- 12.1.20.3. Company Financials
- 12.1.20.4. SWOT Analysis
- 12.1.21 SK Innovation Co Ltd
- 12.1.21.1. Company Overview
- 12.1.21.2. Products
- 12.1.21.3. Company Financials
- 12.1.21.4. SWOT Analysis
- 12.1.22 BP PLC
- 12.1.22.1. Company Overview
- 12.1.22.2. Products
- 12.1.22.3. Company Financials
- 12.1.22.4. SWOT Analysis
- 12.1.23 S-OIL Corporation
- 12.1.23.1. Company Overview
- 12.1.23.2. Products
- 12.1.23.3. Company Financials
- 12.1.23.4. SWOT Analysis
- 12.1.1 Shell PLC
- 12.2. Market Entropy
- 12.2.1 Company's Key Areas Served
- 12.2.2 Recent Developments
- 12.3. Company Market Share Analysis 2025
- 12.3.1 Top 5 Companies Market Share Analysis
- 12.3.2 Top 3 Companies Market Share Analysis
- 12.4. List of Potential Customers
- 13. Research Methodology
List of Figures
- Figure 1: Global BTX Industry Revenue Breakdown (billion, %) by Region 2025 & 2033
- Figure 2: Global BTX Industry Volume Breakdown (Million, %) by Region 2025 & 2033
- Figure 3: Asia Pacific BTX Industry Revenue (billion), by Type 2025 & 2033
- Figure 4: Asia Pacific BTX Industry Volume (Million), by Type 2025 & 2033
- Figure 5: Asia Pacific BTX Industry Revenue Share (%), by Type 2025 & 2033
- Figure 6: Asia Pacific BTX Industry Volume Share (%), by Type 2025 & 2033
- Figure 7: Asia Pacific BTX Industry Revenue (billion), by Product Application 2025 & 2033
- Figure 8: Asia Pacific BTX Industry Volume (Million), by Product Application 2025 & 2033
- Figure 9: Asia Pacific BTX Industry Revenue Share (%), by Product Application 2025 & 2033
- Figure 10: Asia Pacific BTX Industry Volume Share (%), by Product Application 2025 & 2033
- Figure 11: Asia Pacific BTX Industry Revenue (billion), by Country 2025 & 2033
- Figure 12: Asia Pacific BTX Industry Volume (Million), by Country 2025 & 2033
- Figure 13: Asia Pacific BTX Industry Revenue Share (%), by Country 2025 & 2033
- Figure 14: Asia Pacific BTX Industry Volume Share (%), by Country 2025 & 2033
- Figure 15: North America BTX Industry Revenue (billion), by Type 2025 & 2033
- Figure 16: North America BTX Industry Volume (Million), by Type 2025 & 2033
- Figure 17: North America BTX Industry Revenue Share (%), by Type 2025 & 2033
- Figure 18: North America BTX Industry Volume Share (%), by Type 2025 & 2033
- Figure 19: North America BTX Industry Revenue (billion), by Product Application 2025 & 2033
- Figure 20: North America BTX Industry Volume (Million), by Product Application 2025 & 2033
- Figure 21: North America BTX Industry Revenue Share (%), by Product Application 2025 & 2033
- Figure 22: North America BTX Industry Volume Share (%), by Product Application 2025 & 2033
- Figure 23: North America BTX Industry Revenue (billion), by Country 2025 & 2033
- Figure 24: North America BTX Industry Volume (Million), by Country 2025 & 2033
- Figure 25: North America BTX Industry Revenue Share (%), by Country 2025 & 2033
- Figure 26: North America BTX Industry Volume Share (%), by Country 2025 & 2033
- Figure 27: Europe BTX Industry Revenue (billion), by Type 2025 & 2033
- Figure 28: Europe BTX Industry Volume (Million), by Type 2025 & 2033
- Figure 29: Europe BTX Industry Revenue Share (%), by Type 2025 & 2033
- Figure 30: Europe BTX Industry Volume Share (%), by Type 2025 & 2033
- Figure 31: Europe BTX Industry Revenue (billion), by Product Application 2025 & 2033
- Figure 32: Europe BTX Industry Volume (Million), by Product Application 2025 & 2033
- Figure 33: Europe BTX Industry Revenue Share (%), by Product Application 2025 & 2033
- Figure 34: Europe BTX Industry Volume Share (%), by Product Application 2025 & 2033
- Figure 35: Europe BTX Industry Revenue (billion), by Country 2025 & 2033
- Figure 36: Europe BTX Industry Volume (Million), by Country 2025 & 2033
- Figure 37: Europe BTX Industry Revenue Share (%), by Country 2025 & 2033
- Figure 38: Europe BTX Industry Volume Share (%), by Country 2025 & 2033
- Figure 39: South America BTX Industry Revenue (billion), by Type 2025 & 2033
- Figure 40: South America BTX Industry Volume (Million), by Type 2025 & 2033
- Figure 41: South America BTX Industry Revenue Share (%), by Type 2025 & 2033
- Figure 42: South America BTX Industry Volume Share (%), by Type 2025 & 2033
- Figure 43: South America BTX Industry Revenue (billion), by Product Application 2025 & 2033
- Figure 44: South America BTX Industry Volume (Million), by Product Application 2025 & 2033
- Figure 45: South America BTX Industry Revenue Share (%), by Product Application 2025 & 2033
- Figure 46: South America BTX Industry Volume Share (%), by Product Application 2025 & 2033
- Figure 47: South America BTX Industry Revenue (billion), by Country 2025 & 2033
- Figure 48: South America BTX Industry Volume (Million), by Country 2025 & 2033
- Figure 49: South America BTX Industry Revenue Share (%), by Country 2025 & 2033
- Figure 50: South America BTX Industry Volume Share (%), by Country 2025 & 2033
- Figure 51: Middle East and Africa BTX Industry Revenue (billion), by Type 2025 & 2033
- Figure 52: Middle East and Africa BTX Industry Volume (Million), by Type 2025 & 2033
- Figure 53: Middle East and Africa BTX Industry Revenue Share (%), by Type 2025 & 2033
- Figure 54: Middle East and Africa BTX Industry Volume Share (%), by Type 2025 & 2033
- Figure 55: Middle East and Africa BTX Industry Revenue (billion), by Product Application 2025 & 2033
- Figure 56: Middle East and Africa BTX Industry Volume (Million), by Product Application 2025 & 2033
- Figure 57: Middle East and Africa BTX Industry Revenue Share (%), by Product Application 2025 & 2033
- Figure 58: Middle East and Africa BTX Industry Volume Share (%), by Product Application 2025 & 2033
- Figure 59: Middle East and Africa BTX Industry Revenue (billion), by Country 2025 & 2033
- Figure 60: Middle East and Africa BTX Industry Volume (Million), by Country 2025 & 2033
- Figure 61: Middle East and Africa BTX Industry Revenue Share (%), by Country 2025 & 2033
- Figure 62: Middle East and Africa BTX Industry Volume Share (%), by Country 2025 & 2033
List of Tables
- Table 1: Global BTX Industry Revenue billion Forecast, by Type 2020 & 2033
- Table 2: Global BTX Industry Volume Million Forecast, by Type 2020 & 2033
- Table 3: Global BTX Industry Revenue billion Forecast, by Product Application 2020 & 2033
- Table 4: Global BTX Industry Volume Million Forecast, by Product Application 2020 & 2033
- Table 5: Global BTX Industry Revenue billion Forecast, by Region 2020 & 2033
- Table 6: Global BTX Industry Volume Million Forecast, by Region 2020 & 2033
- Table 7: Global BTX Industry Revenue billion Forecast, by Type 2020 & 2033
- Table 8: Global BTX Industry Volume Million Forecast, by Type 2020 & 2033
- Table 9: Global BTX Industry Revenue billion Forecast, by Product Application 2020 & 2033
- Table 10: Global BTX Industry Volume Million Forecast, by Product Application 2020 & 2033
- Table 11: Global BTX Industry Revenue billion Forecast, by Country 2020 & 2033
- Table 12: Global BTX Industry Volume Million Forecast, by Country 2020 & 2033
- Table 13: China BTX Industry Revenue (billion) Forecast, by Application 2020 & 2033
- Table 14: China BTX Industry Volume (Million) Forecast, by Application 2020 & 2033
- Table 15: India BTX Industry Revenue (billion) Forecast, by Application 2020 & 2033
- Table 16: India BTX Industry Volume (Million) Forecast, by Application 2020 & 2033
- Table 17: Japan BTX Industry Revenue (billion) Forecast, by Application 2020 & 2033
- Table 18: Japan BTX Industry Volume (Million) Forecast, by Application 2020 & 2033
- Table 19: South Korea BTX Industry Revenue (billion) Forecast, by Application 2020 & 2033
- Table 20: South Korea BTX Industry Volume (Million) Forecast, by Application 2020 & 2033
- Table 21: Rest of Asia Pacific BTX Industry Revenue (billion) Forecast, by Application 2020 & 2033
- Table 22: Rest of Asia Pacific BTX Industry Volume (Million) Forecast, by Application 2020 & 2033
- Table 23: Global BTX Industry Revenue billion Forecast, by Type 2020 & 2033
- Table 24: Global BTX Industry Volume Million Forecast, by Type 2020 & 2033
- Table 25: Global BTX Industry Revenue billion Forecast, by Product Application 2020 & 2033
- Table 26: Global BTX Industry Volume Million Forecast, by Product Application 2020 & 2033
- Table 27: Global BTX Industry Revenue billion Forecast, by Country 2020 & 2033
- Table 28: Global BTX Industry Volume Million Forecast, by Country 2020 & 2033
- Table 29: United States BTX Industry Revenue (billion) Forecast, by Application 2020 & 2033
- Table 30: United States BTX Industry Volume (Million) Forecast, by Application 2020 & 2033
- Table 31: Canada BTX Industry Revenue (billion) Forecast, by Application 2020 & 2033
- Table 32: Canada BTX Industry Volume (Million) Forecast, by Application 2020 & 2033
- Table 33: Mexico BTX Industry Revenue (billion) Forecast, by Application 2020 & 2033
- Table 34: Mexico BTX Industry Volume (Million) Forecast, by Application 2020 & 2033
- Table 35: Global BTX Industry Revenue billion Forecast, by Type 2020 & 2033
- Table 36: Global BTX Industry Volume Million Forecast, by Type 2020 & 2033
- Table 37: Global BTX Industry Revenue billion Forecast, by Product Application 2020 & 2033
- Table 38: Global BTX Industry Volume Million Forecast, by Product Application 2020 & 2033
- Table 39: Global BTX Industry Revenue billion Forecast, by Country 2020 & 2033
- Table 40: Global BTX Industry Volume Million Forecast, by Country 2020 & 2033
- Table 41: Germany BTX Industry Revenue (billion) Forecast, by Application 2020 & 2033
- Table 42: Germany BTX Industry Volume (Million) Forecast, by Application 2020 & 2033
- Table 43: United Kingdom BTX Industry Revenue (billion) Forecast, by Application 2020 & 2033
- Table 44: United Kingdom BTX Industry Volume (Million) Forecast, by Application 2020 & 2033
- Table 45: Italy BTX Industry Revenue (billion) Forecast, by Application 2020 & 2033
- Table 46: Italy BTX Industry Volume (Million) Forecast, by Application 2020 & 2033
- Table 47: France BTX Industry Revenue (billion) Forecast, by Application 2020 & 2033
- Table 48: France BTX Industry Volume (Million) Forecast, by Application 2020 & 2033
- Table 49: Rest of Europe BTX Industry Revenue (billion) Forecast, by Application 2020 & 2033
- Table 50: Rest of Europe BTX Industry Volume (Million) Forecast, by Application 2020 & 2033
- Table 51: Global BTX Industry Revenue billion Forecast, by Type 2020 & 2033
- Table 52: Global BTX Industry Volume Million Forecast, by Type 2020 & 2033
- Table 53: Global BTX Industry Revenue billion Forecast, by Product Application 2020 & 2033
- Table 54: Global BTX Industry Volume Million Forecast, by Product Application 2020 & 2033
- Table 55: Global BTX Industry Revenue billion Forecast, by Country 2020 & 2033
- Table 56: Global BTX Industry Volume Million Forecast, by Country 2020 & 2033
- Table 57: Brazil BTX Industry Revenue (billion) Forecast, by Application 2020 & 2033
- Table 58: Brazil BTX Industry Volume (Million) Forecast, by Application 2020 & 2033
- Table 59: Argentina BTX Industry Revenue (billion) Forecast, by Application 2020 & 2033
- Table 60: Argentina BTX Industry Volume (Million) Forecast, by Application 2020 & 2033
- Table 61: Rest of South America BTX Industry Revenue (billion) Forecast, by Application 2020 & 2033
- Table 62: Rest of South America BTX Industry Volume (Million) Forecast, by Application 2020 & 2033
- Table 63: Global BTX Industry Revenue billion Forecast, by Type 2020 & 2033
- Table 64: Global BTX Industry Volume Million Forecast, by Type 2020 & 2033
- Table 65: Global BTX Industry Revenue billion Forecast, by Product Application 2020 & 2033
- Table 66: Global BTX Industry Volume Million Forecast, by Product Application 2020 & 2033
- Table 67: Global BTX Industry Revenue billion Forecast, by Country 2020 & 2033
- Table 68: Global BTX Industry Volume Million Forecast, by Country 2020 & 2033
- Table 69: Saudi Arabia BTX Industry Revenue (billion) Forecast, by Application 2020 & 2033
- Table 70: Saudi Arabia BTX Industry Volume (Million) Forecast, by Application 2020 & 2033
- Table 71: South Africa BTX Industry Revenue (billion) Forecast, by Application 2020 & 2033
- Table 72: South Africa BTX Industry Volume (Million) Forecast, by Application 2020 & 2033
- Table 73: Rest of Middle East and Africa BTX Industry Revenue (billion) Forecast, by Application 2020 & 2033
- Table 74: Rest of Middle East and Africa BTX Industry Volume (Million) Forecast, by Application 2020 & 2033
Frequently Asked Questions
1. What is the projected Compound Annual Growth Rate (CAGR) of the BTX Industry?
The projected CAGR is approximately 4.6%.
2. Which companies are prominent players in the BTX Industry?
Key companies in the market include Shell PLC, Formosa Plastics Group, JX Nippon Oil & Gas Exploration Corporation (Eneos), Exxon Mobil Corporation, Chevron Phillips Chemical Company LLC, YEOCHUN NCC CO LTD*List Not Exhaustive, IRPC Public Company Limited, INEOS, China Petroleum & Chemical Corporation Limited (SINOPEC), Reliance Industries Limited, China National Petroleum Corporation, China National Offshore Oil Corporation (CNOOC), BASF SE, OCI LTD, Totalenergies, SABIC, Dow, MITSUBISHI GAS CHEMICAL COMPANY INC, GS Caltex Corporation, JFE Chemical Corporation, SK Innovation Co Ltd, BP PLC, S-OIL Corporation.
3. What are the main segments of the BTX Industry?
The market segments include Type, Product Application .
4. Can you provide details about the market size?
The market size is estimated to be USD 8.07 billion as of 2022.
5. What are some drivers contributing to market growth?
Increasing Investments in Capacity Expansions is Driving the Growth of Paraxylene. Xylene. and Benzene; Increasing Demand for Toluene from Paints. Coatings. and Adhesives.
6. What are the notable trends driving market growth?
Ethylbenzene is Expected to Dominate the Benzene by Application Segment.
7. Are there any restraints impacting market growth?
Hazards Associated with Benzene-toluene-xylene (BTX).
8. Can you provide examples of recent developments in the market?
The recent developments pertaining to the major players in the market are being covered in the complete study.
9. What pricing options are available for accessing the report?
Pricing options include single-user, multi-user, and enterprise licenses priced at USD 4750, USD 5250, and USD 8750 respectively.
10. Is the market size provided in terms of value or volume?
The market size is provided in terms of value, measured in billion and volume, measured in Million.
11. Are there any specific market keywords associated with the report?
Yes, the market keyword associated with the report is "BTX Industry," which aids in identifying and referencing the specific market segment covered.
12. How do I determine which pricing option suits my needs best?
The pricing options vary based on user requirements and access needs. Individual users may opt for single-user licenses, while businesses requiring broader access may choose multi-user or enterprise licenses for cost-effective access to the report.
13. Are there any additional resources or data provided in the BTX Industry report?
While the report offers comprehensive insights, it's advisable to review the specific contents or supplementary materials provided to ascertain if additional resources or data are available.
14. How can I stay updated on further developments or reports in the BTX Industry?
To stay informed about further developments, trends, and reports in the BTX Industry, consider subscribing to industry newsletters, following relevant companies and organizations, or regularly checking reputable industry news sources and publications.
Methodology
Step 1 - Identification of Relevant Samples Size from Population Database


Step 2 - Approaches for Defining Global Market Size (Value, Volume* & Price*)

Note*: In applicable scenarios
Step 3 - Data Sources
Primary Research
- Web Analytics
- Survey Reports
- Research Institute
- Latest Research Reports
- Opinion Leaders
Secondary Research
- Annual Reports
- White Paper
- Latest Press Release
- Industry Association
- Paid Database
- Investor Presentations

Step 4 - Data Triangulation
Involves using different sources of information in order to increase the validity of a study
These sources are likely to be stakeholders in a program - participants, other researchers, program staff, other community members, and so on.
Then we put all data in single framework & apply various statistical tools to find out the dynamic on the market.
During the analysis stage, feedback from the stakeholder groups would be compared to determine areas of agreement as well as areas of divergence