

Key Insights
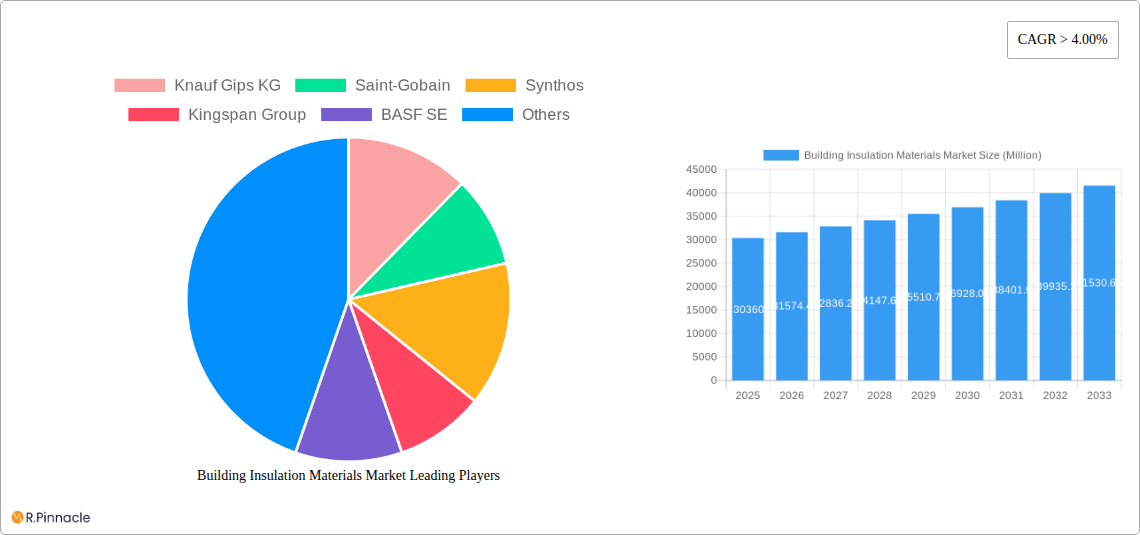
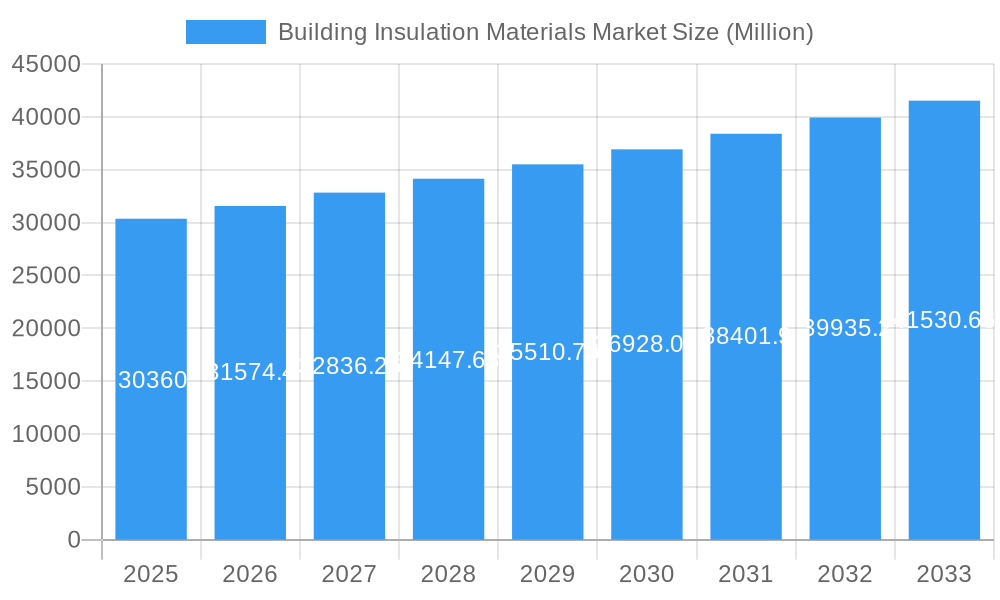
The global building insulation materials market, valued at $30.36 billion in 2025, is projected to experience robust growth, exhibiting a Compound Annual Growth Rate (CAGR) exceeding 4.00% from 2025 to 2033. This expansion is fueled by several key drivers. Increasing concerns regarding energy efficiency and rising energy costs are prompting homeowners and businesses alike to invest in better insulation, leading to increased demand. Stringent building codes and regulations in various regions mandating improved energy performance in new constructions and renovations further stimulate market growth. The burgeoning construction industry, particularly in developing economies experiencing rapid urbanization, contributes significantly to the market's expansion. Furthermore, advancements in insulation material technology, leading to improved thermal performance, fire resistance, and eco-friendliness, are driving market adoption. The market is segmented by material type (fiberglass, mineral wool, cellulose, polyurethane/polyisocyanurate foam, polystyrene, and others) and end-user industry (residential and non-residential). Fiberglass and mineral wool currently dominate the market due to their cost-effectiveness and widespread availability, while polyurethane foam is gaining traction due to its superior insulating properties. The residential sector holds a significant market share, driven by rising homeownership rates and increasing awareness of energy savings.
Building Insulation Materials Market Market Size (In Billion)
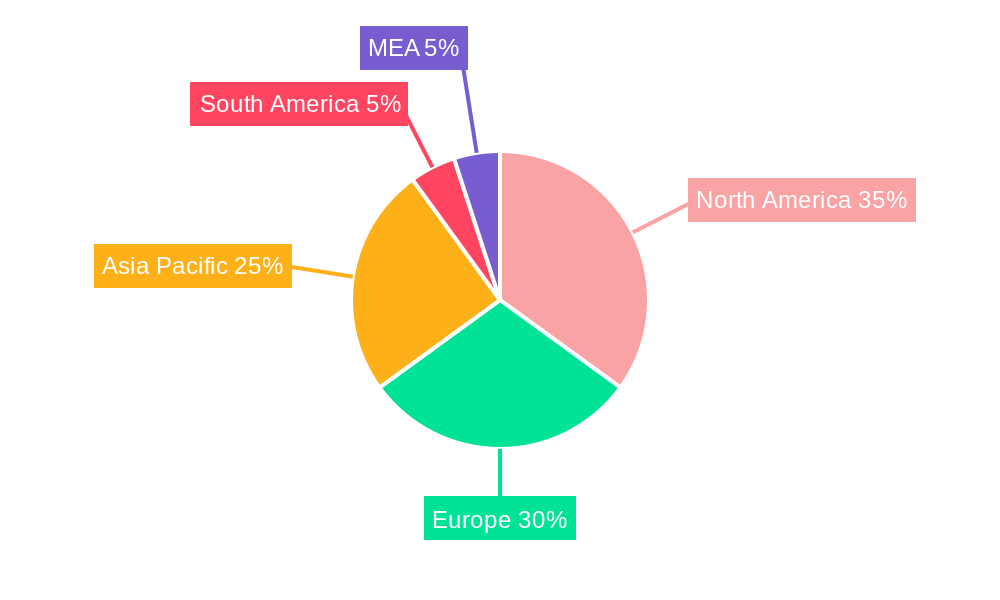
However, market growth is not without challenges. Fluctuations in raw material prices, particularly for petroleum-based insulation materials, can impact profitability and pricing. Concerns about the environmental impact of certain insulation materials, especially regarding their manufacturing processes and disposal, are also emerging as restraints. Competition from alternative building technologies and the need for skilled labor for proper installation can hinder market penetration. Despite these restraints, the long-term outlook for the building insulation materials market remains positive, driven by the ongoing need for energy-efficient buildings and sustainable construction practices. The market's geographical distribution reflects global construction activity, with North America, Europe, and Asia-Pacific representing the largest regional markets.
Building Insulation Materials Market Company Market Share
Building Insulation Materials Market Report: 2019-2033
This comprehensive report provides an in-depth analysis of the Building Insulation Materials Market, offering valuable insights for industry professionals, investors, and strategic decision-makers. Covering the period 2019-2033, with a focus on 2025, this report leverages rigorous data analysis and expert insights to present a clear picture of market trends, growth drivers, and future opportunities. The report value is estimated at xx Million.
Building Insulation Materials Market Structure & Innovation Trends
This section analyzes the competitive landscape of the building insulation materials market, examining market concentration, innovation drivers, regulatory frameworks, product substitutes, end-user demographics, and M&A activities. The market is characterized by a moderately concentrated structure, with key players such as Knauf Gips KG, Saint-Gobain, and ROCKWOOL International A/S holding significant market share. However, the presence of numerous smaller players indicates a competitive market environment.
- Market Concentration: The top 5 players account for approximately xx% of the global market share in 2025.
- Innovation Drivers: Stringent energy efficiency regulations, increasing awareness of sustainable building practices, and advancements in material science are key drivers of innovation. The demand for eco-friendly and high-performance insulation materials is also pushing innovation.
- Regulatory Frameworks: Government policies and building codes related to energy efficiency significantly influence market growth. Carbon emission reduction targets are driving demand for low-carbon insulation products.
- Product Substitutes: Alternative materials and technologies are emerging, posing challenges to established insulation materials. However, the overall market is expected to grow as the need for insulation increases.
- M&A Activities: The building insulation materials sector has witnessed significant M&A activity in recent years, with deal values totaling an estimated xx Million in the past 5 years. These activities aim to expand market reach, enhance product portfolios, and strengthen competitive positioning.
Building Insulation Materials Market Dynamics & Trends
This section delves into the market dynamics, including growth drivers, technological disruptions, consumer preferences, and competitive dynamics. The global building insulation materials market is projected to experience a Compound Annual Growth Rate (CAGR) of xx% during the forecast period (2025-2033). Key drivers include rising construction activities, increasing urbanization, and growing awareness about energy efficiency. Technological advancements, such as the development of novel insulation materials with enhanced performance characteristics and sustainability attributes, contribute significantly to market growth. Consumer preferences are shifting toward eco-friendly, high-performance, and cost-effective insulation solutions. Competitive dynamics are shaped by factors such as pricing strategies, product differentiation, technological advancements, and brand recognition. Market penetration of innovative products is gradually increasing with a notable uptake in regions with stricter building codes.
Dominant Regions & Segments in Building Insulation Materials Market
This section illuminates the leading geographical areas and key segments shaping the global building insulation materials market. Our comprehensive analysis indicates that Asia-Pacific currently stands as the dominant region. This leadership is primarily attributed to a confluence of factors, including accelerated urbanization, a robust pipeline of construction projects, and increasingly supportive government initiatives aimed at enhancing building energy efficiency and promoting sustainable development.
Key Drivers by Region:
- North America: Characterized by sustained demand in both residential and non-residential construction sectors. This is further bolstered by a rigorous regulatory framework mandating high energy efficiency standards for buildings.
- Europe: Driven by stringent environmental regulations and a strong emphasis on sustainable building practices. Government incentives play a crucial role in encouraging the adoption of advanced insulation solutions.
- Asia-Pacific: Experiencing unprecedented rapid urbanization, a burgeoning middle class with rising disposable incomes, and a significant upswing in construction activities across all sectors, from residential to commercial and industrial infrastructure.
Dominant Segments:
- Type: Fiberglass continues to command the largest market share, owing to its widespread application in both residential and commercial constructions, offering a cost-effective and versatile insulation solution. Concurrently, there is a rapidly escalating demand for Mineral Wool and Polyurethane/Polyisocyanurate (PUR/PIR) Foam. This surge is propelled by their superior thermal insulation properties, enhanced fire resistance (in the case of mineral wool), and significant contributions to building sustainability and energy savings.
- End-user Industry: The residential sector currently represents the largest share of the market. However, the non-residential sector is poised for substantial growth. This expansion is fueled by significant investments in commercial infrastructure, industrial facilities, and institutional buildings, all of which are increasingly prioritizing energy efficiency and thermal comfort.
Building Insulation Materials Market Product Innovations
Recent years have witnessed significant product innovations in the building insulation materials market, driven by the need for improved energy efficiency, sustainability, and performance. Key developments include the introduction of bio-based insulation materials, such as Kingspan Group's HemKor range made from hemp, and low-carbon footprint products like Energystore+ from Energystore Limited, based on BASF SE's Neopor BMB granules. Atlas Roofing Corporation's EnergyShield XR, a polyiso insulation product for continuous insulation, represents another significant advancement. These innovations demonstrate a clear shift toward sustainable and high-performance solutions.
Report Scope & Segmentation Analysis
This report meticulously segments the building insulation materials market based on key parameters: type (including Fiberglass, Mineral Wool, Cellulose, Polyurethane/Polyisocyanurate (PUR/PIR) Foam, Polystyrene, and Other Insulation Materials) and end-user industry (Residential and Non-residential). Each segment is subjected to in-depth analysis, evaluating its projected growth trajectory, current market size, and the prevailing competitive landscape. For instance, while the Fiberglass segment is anticipated to maintain its leading position due to its established market presence and cost-effectiveness, the PUR/PIR foam segment is projected to exhibit exceptional growth, driven by its high-performance thermal insulation capabilities and increasing adoption in specialized applications. Similarly, the residential sector is a dominant end-user segment at present, but the non-residential sector is forecast to demonstrate robust expansion in the coming years, reflecting evolving construction trends and energy efficiency mandates.
Key Drivers of Building Insulation Materials Market Growth
Several key factors are driving the growth of the building insulation materials market. Stringent government regulations aimed at improving energy efficiency, the increasing focus on sustainable building practices, and a growing demand for improved indoor comfort levels are all contributing factors. The rising construction activity across both residential and non-residential sectors further fuels this market growth. Technological advancements leading to the development of innovative and high-performance insulation materials also play a significant role.
Challenges in the Building Insulation Materials Market Sector
Despite strong growth prospects, the building insulation materials market faces several challenges. Fluctuations in raw material prices, supply chain disruptions, and intense competition among established players are significant obstacles. Furthermore, stringent regulatory compliance requirements and the high initial investment costs associated with adopting new technologies can also limit market growth. These factors can impact profitability and market expansion for companies operating in this sector.
Emerging Opportunities in Building Insulation Materials Market
The building insulation materials market is ripe with emerging opportunities. A significant growth avenue lies in the escalating demand for sustainable and eco-friendly insulation materials. This includes products derived from recycled content, bio-based materials, and those with lower embodied carbon footprints. Furthermore, continuous advancements in material science and innovative technologies are paving the way for the development of next-generation insulation products. These innovations promise enhanced thermal performance, improved fire safety, better moisture resistance, and superior acoustic properties, all while aligning with sustainability goals. The strategic expansion into developing economies, characterized by rapidly expanding construction sectors and a growing awareness of energy efficiency, presents substantial untapped potential for market players to establish a strong foothold and drive future growth.
Leading Players in the Building Insulation Materials Market Market
- Knauf Gips KG
- Saint-Gobain
- Synthos
- Kingspan Group
- BASF SE
- Huntsman International LLC
- DuPont
- ROCKWOOL International A/S
- Atlas Roofing Corporation
- Beijing New Building Material (Group) Co Ltd
- GAF
- Owens Corning (including Paroc Group)
- Johns Manville
Key Developments in Building Insulation Materials Market Industry
- November 2023: Kingspan Group launched the HemKor range, its first bio-based insulation product made largely from hemp, reducing embodied carbon in buildings.
- March 2023: Energystore Limited launched Energystore+, a low-carbon footprint insulation product range using BASF SE's Neopor BMB expandable polystyrene (EPS) granules.
- February 2023: Atlas Roofing Corporation introduced EnergyShield XR, a polyiso insulation product for continuous insulation in foundation walls and under slabs.
Future Outlook for Building Insulation Materials Market Market
The future outlook for the building insulation materials market is positive. Continued growth is anticipated driven by factors such as increasing urbanization, stringent energy efficiency regulations, and the rising demand for sustainable building materials. Opportunities exist for companies to innovate and develop new products that address the growing demand for high-performance, eco-friendly, and cost-effective insulation solutions. Strategic partnerships and acquisitions are likely to play a significant role in shaping the future competitive landscape.
Building Insulation Materials Market Segmentation
-
1. Type
- 1.1. Fiberglass
- 1.2. Mineral Wool
- 1.3. Cellulose
- 1.4. Polyurethane/ Polyisocyanurate (PUR/PIR) Foam
- 1.5. Polystyrene
- 1.6. Other Insulation Materials
-
2. End-user Industry
- 2.1. Residential
-
2.2. Non-residential
- 2.2.1. Commercial
- 2.2.2. Infrastructure
- 2.2.3. Other Non-residential
Building Insulation Materials Market Segmentation By Geography
-
1. Asia Pacific
- 1.1. China
- 1.2. India
- 1.3. Japan
- 1.4. South Korea
- 1.5. Southeast Asia
- 1.6. Australia
- 1.7. Rest of Asia Pacific
-
2. North America
- 2.1. United States
- 2.2. Canada
- 2.3. Mexico
-
3. Europe
- 3.1. Germany
- 3.2. United Kingdom
- 3.3. Italy
- 3.4. France
- 3.5. Spain
- 3.6. Rest of Europe
-
4. South America
- 4.1. Brazil
- 4.2. Argentina
- 4.3. Colombia
- 4.4. Rest of South America
-
5. Middle East and Africa
- 5.1. Saudi Arabia
- 5.2. South Africa
- 5.3. United Arab Emirates
- 5.4. Nigeria
- 5.5. Rest of Middle East and Africa
Building Insulation Materials Market Regional Market Share
Geographic Coverage of Building Insulation Materials Market
Building Insulation Materials Market REPORT HIGHLIGHTS
| Aspects | Details |
|---|---|
| Study Period | 2020-2034 |
| Base Year | 2025 |
| Estimated Year | 2026 |
| Forecast Period | 2026-2034 |
| Historical Period | 2020-2025 |
| Growth Rate | CAGR of > 4.00% from 2020-2034 |
| Segmentation |
|
Table of Contents
- 1. Introduction
- 1.1. Research Scope
- 1.2. Market Segmentation
- 1.3. Research Objective
- 1.4. Definitions and Assumptions
- 2. Executive Summary
- 2.1. Market Snapshot
- 3. Market Dynamics
- 3.1. Market Drivers
- 3.2. Market Restrains
- 3.3. Market Trends
- 3.4. Market Opportunities
- 4. Market Factor Analysis
- 4.1. Porters Five Forces
- 4.1.1. Bargaining Power of Suppliers
- 4.1.2. Bargaining Power of Buyers
- 4.1.3. Threat of New Entrants
- 4.1.4. Threat of Substitutes
- 4.1.5. Competitive Rivalry
- 4.2. PESTEL analysis
- 4.3. BCG Analysis
- 4.3.1. Stars (High Growth, High Market Share)
- 4.3.2. Cash Cows (Low Growth, High Market Share)
- 4.3.3. Question Mark (High Growth, Low Market Share)
- 4.3.4. Dogs (Low Growth, Low Market Share)
- 4.4. Ansoff Matrix Analysis
- 4.5. Supply Chain Analysis
- 4.6. Regulatory Landscape
- 4.7. Current Market Potential and Opportunity Assessment (TAM–SAM–SOM Framework)
- 4.8. PRI Analyst Note
- 4.1. Porters Five Forces
- 5. Market Analysis, Insights and Forecast 2021-2033
- 5.1. Market Analysis, Insights and Forecast - by Type
- 5.1.1. Fiberglass
- 5.1.2. Mineral Wool
- 5.1.3. Cellulose
- 5.1.4. Polyurethane/ Polyisocyanurate (PUR/PIR) Foam
- 5.1.5. Polystyrene
- 5.1.6. Other Insulation Materials
- 5.2. Market Analysis, Insights and Forecast - by End-user Industry
- 5.2.1. Residential
- 5.2.2. Non-residential
- 5.2.2.1. Commercial
- 5.2.2.2. Infrastructure
- 5.2.2.3. Other Non-residential
- 5.3. Market Analysis, Insights and Forecast - by Region
- 5.3.1. Asia Pacific
- 5.3.2. North America
- 5.3.3. Europe
- 5.3.4. South America
- 5.3.5. Middle East and Africa
- 5.1. Market Analysis, Insights and Forecast - by Type
- 6. Global Building Insulation Materials Market Analysis, Insights and Forecast, 2021-2033
- 6.1. Market Analysis, Insights and Forecast - by Type
- 6.1.1. Fiberglass
- 6.1.2. Mineral Wool
- 6.1.3. Cellulose
- 6.1.4. Polyurethane/ Polyisocyanurate (PUR/PIR) Foam
- 6.1.5. Polystyrene
- 6.1.6. Other Insulation Materials
- 6.2. Market Analysis, Insights and Forecast - by End-user Industry
- 6.2.1. Residential
- 6.2.2. Non-residential
- 6.2.2.1. Commercial
- 6.2.2.2. Infrastructure
- 6.2.2.3. Other Non-residential
- 6.1. Market Analysis, Insights and Forecast - by Type
- 7. Asia Pacific Building Insulation Materials Market Analysis, Insights and Forecast, 2020-2032
- 7.1. Market Analysis, Insights and Forecast - by Type
- 7.1.1. Fiberglass
- 7.1.2. Mineral Wool
- 7.1.3. Cellulose
- 7.1.4. Polyurethane/ Polyisocyanurate (PUR/PIR) Foam
- 7.1.5. Polystyrene
- 7.1.6. Other Insulation Materials
- 7.2. Market Analysis, Insights and Forecast - by End-user Industry
- 7.2.1. Residential
- 7.2.2. Non-residential
- 7.2.2.1. Commercial
- 7.2.2.2. Infrastructure
- 7.2.2.3. Other Non-residential
- 7.1. Market Analysis, Insights and Forecast - by Type
- 8. North America Building Insulation Materials Market Analysis, Insights and Forecast, 2020-2032
- 8.1. Market Analysis, Insights and Forecast - by Type
- 8.1.1. Fiberglass
- 8.1.2. Mineral Wool
- 8.1.3. Cellulose
- 8.1.4. Polyurethane/ Polyisocyanurate (PUR/PIR) Foam
- 8.1.5. Polystyrene
- 8.1.6. Other Insulation Materials
- 8.2. Market Analysis, Insights and Forecast - by End-user Industry
- 8.2.1. Residential
- 8.2.2. Non-residential
- 8.2.2.1. Commercial
- 8.2.2.2. Infrastructure
- 8.2.2.3. Other Non-residential
- 8.1. Market Analysis, Insights and Forecast - by Type
- 9. Europe Building Insulation Materials Market Analysis, Insights and Forecast, 2020-2032
- 9.1. Market Analysis, Insights and Forecast - by Type
- 9.1.1. Fiberglass
- 9.1.2. Mineral Wool
- 9.1.3. Cellulose
- 9.1.4. Polyurethane/ Polyisocyanurate (PUR/PIR) Foam
- 9.1.5. Polystyrene
- 9.1.6. Other Insulation Materials
- 9.2. Market Analysis, Insights and Forecast - by End-user Industry
- 9.2.1. Residential
- 9.2.2. Non-residential
- 9.2.2.1. Commercial
- 9.2.2.2. Infrastructure
- 9.2.2.3. Other Non-residential
- 9.1. Market Analysis, Insights and Forecast - by Type
- 10. South America Building Insulation Materials Market Analysis, Insights and Forecast, 2020-2032
- 10.1. Market Analysis, Insights and Forecast - by Type
- 10.1.1. Fiberglass
- 10.1.2. Mineral Wool
- 10.1.3. Cellulose
- 10.1.4. Polyurethane/ Polyisocyanurate (PUR/PIR) Foam
- 10.1.5. Polystyrene
- 10.1.6. Other Insulation Materials
- 10.2. Market Analysis, Insights and Forecast - by End-user Industry
- 10.2.1. Residential
- 10.2.2. Non-residential
- 10.2.2.1. Commercial
- 10.2.2.2. Infrastructure
- 10.2.2.3. Other Non-residential
- 10.1. Market Analysis, Insights and Forecast - by Type
- 11. Middle East and Africa Building Insulation Materials Market Analysis, Insights and Forecast, 2020-2032
- 11.1. Market Analysis, Insights and Forecast - by Type
- 11.1.1. Fiberglass
- 11.1.2. Mineral Wool
- 11.1.3. Cellulose
- 11.1.4. Polyurethane/ Polyisocyanurate (PUR/PIR) Foam
- 11.1.5. Polystyrene
- 11.1.6. Other Insulation Materials
- 11.2. Market Analysis, Insights and Forecast - by End-user Industry
- 11.2.1. Residential
- 11.2.2. Non-residential
- 11.2.2.1. Commercial
- 11.2.2.2. Infrastructure
- 11.2.2.3. Other Non-residential
- 11.1. Market Analysis, Insights and Forecast - by Type
- 12. Competitive Analysis
- 12.1. Company Profiles
- 12.1.1 Knauf Gips KG
- 12.1.1.1. Company Overview
- 12.1.1.2. Products
- 12.1.1.3. Company Financials
- 12.1.1.4. SWOT Analysis
- 12.1.2 Saint-Gobain
- 12.1.2.1. Company Overview
- 12.1.2.2. Products
- 12.1.2.3. Company Financials
- 12.1.2.4. SWOT Analysis
- 12.1.3 Synthos
- 12.1.3.1. Company Overview
- 12.1.3.2. Products
- 12.1.3.3. Company Financials
- 12.1.3.4. SWOT Analysis
- 12.1.4 Kingspan Group
- 12.1.4.1. Company Overview
- 12.1.4.2. Products
- 12.1.4.3. Company Financials
- 12.1.4.4. SWOT Analysis
- 12.1.5 BASF SE
- 12.1.5.1. Company Overview
- 12.1.5.2. Products
- 12.1.5.3. Company Financials
- 12.1.5.4. SWOT Analysis
- 12.1.6 Huntsman International LLC
- 12.1.6.1. Company Overview
- 12.1.6.2. Products
- 12.1.6.3. Company Financials
- 12.1.6.4. SWOT Analysis
- 12.1.7 DuPont
- 12.1.7.1. Company Overview
- 12.1.7.2. Products
- 12.1.7.3. Company Financials
- 12.1.7.4. SWOT Analysis
- 12.1.8 ROCKWOOL International A/S
- 12.1.8.1. Company Overview
- 12.1.8.2. Products
- 12.1.8.3. Company Financials
- 12.1.8.4. SWOT Analysis
- 12.1.9 Atlas Roofing Corporation
- 12.1.9.1. Company Overview
- 12.1.9.2. Products
- 12.1.9.3. Company Financials
- 12.1.9.4. SWOT Analysis
- 12.1.10 Beijing New Building Material (Group) Co Ltd
- 12.1.10.1. Company Overview
- 12.1.10.2. Products
- 12.1.10.3. Company Financials
- 12.1.10.4. SWOT Analysis
- 12.1.11 GAF
- 12.1.11.1. Company Overview
- 12.1.11.2. Products
- 12.1.11.3. Company Financials
- 12.1.11.4. SWOT Analysis
- 12.1.12 Owens Corning (including Paroc Group)
- 12.1.12.1. Company Overview
- 12.1.12.2. Products
- 12.1.12.3. Company Financials
- 12.1.12.4. SWOT Analysis
- 12.1.13 Johns Manville
- 12.1.13.1. Company Overview
- 12.1.13.2. Products
- 12.1.13.3. Company Financials
- 12.1.13.4. SWOT Analysis
- 12.1.1 Knauf Gips KG
- 12.2. Market Entropy
- 12.2.1 Company's Key Areas Served
- 12.2.2 Recent Developments
- 12.3. Company Market Share Analysis 2025
- 12.3.1 Top 5 Companies Market Share Analysis
- 12.3.2 Top 3 Companies Market Share Analysis
- 12.4. List of Potential Customers
- 13. Research Methodology
List of Figures
- Figure 1: Global Building Insulation Materials Market Revenue Breakdown (Million, %) by Region 2025 & 2033
- Figure 2: Global Building Insulation Materials Market Volume Breakdown (K Tons, %) by Region 2025 & 2033
- Figure 3: Asia Pacific Building Insulation Materials Market Revenue (Million), by Type 2025 & 2033
- Figure 4: Asia Pacific Building Insulation Materials Market Volume (K Tons), by Type 2025 & 2033
- Figure 5: Asia Pacific Building Insulation Materials Market Revenue Share (%), by Type 2025 & 2033
- Figure 6: Asia Pacific Building Insulation Materials Market Volume Share (%), by Type 2025 & 2033
- Figure 7: Asia Pacific Building Insulation Materials Market Revenue (Million), by End-user Industry 2025 & 2033
- Figure 8: Asia Pacific Building Insulation Materials Market Volume (K Tons), by End-user Industry 2025 & 2033
- Figure 9: Asia Pacific Building Insulation Materials Market Revenue Share (%), by End-user Industry 2025 & 2033
- Figure 10: Asia Pacific Building Insulation Materials Market Volume Share (%), by End-user Industry 2025 & 2033
- Figure 11: Asia Pacific Building Insulation Materials Market Revenue (Million), by Country 2025 & 2033
- Figure 12: Asia Pacific Building Insulation Materials Market Volume (K Tons), by Country 2025 & 2033
- Figure 13: Asia Pacific Building Insulation Materials Market Revenue Share (%), by Country 2025 & 2033
- Figure 14: Asia Pacific Building Insulation Materials Market Volume Share (%), by Country 2025 & 2033
- Figure 15: North America Building Insulation Materials Market Revenue (Million), by Type 2025 & 2033
- Figure 16: North America Building Insulation Materials Market Volume (K Tons), by Type 2025 & 2033
- Figure 17: North America Building Insulation Materials Market Revenue Share (%), by Type 2025 & 2033
- Figure 18: North America Building Insulation Materials Market Volume Share (%), by Type 2025 & 2033
- Figure 19: North America Building Insulation Materials Market Revenue (Million), by End-user Industry 2025 & 2033
- Figure 20: North America Building Insulation Materials Market Volume (K Tons), by End-user Industry 2025 & 2033
- Figure 21: North America Building Insulation Materials Market Revenue Share (%), by End-user Industry 2025 & 2033
- Figure 22: North America Building Insulation Materials Market Volume Share (%), by End-user Industry 2025 & 2033
- Figure 23: North America Building Insulation Materials Market Revenue (Million), by Country 2025 & 2033
- Figure 24: North America Building Insulation Materials Market Volume (K Tons), by Country 2025 & 2033
- Figure 25: North America Building Insulation Materials Market Revenue Share (%), by Country 2025 & 2033
- Figure 26: North America Building Insulation Materials Market Volume Share (%), by Country 2025 & 2033
- Figure 27: Europe Building Insulation Materials Market Revenue (Million), by Type 2025 & 2033
- Figure 28: Europe Building Insulation Materials Market Volume (K Tons), by Type 2025 & 2033
- Figure 29: Europe Building Insulation Materials Market Revenue Share (%), by Type 2025 & 2033
- Figure 30: Europe Building Insulation Materials Market Volume Share (%), by Type 2025 & 2033
- Figure 31: Europe Building Insulation Materials Market Revenue (Million), by End-user Industry 2025 & 2033
- Figure 32: Europe Building Insulation Materials Market Volume (K Tons), by End-user Industry 2025 & 2033
- Figure 33: Europe Building Insulation Materials Market Revenue Share (%), by End-user Industry 2025 & 2033
- Figure 34: Europe Building Insulation Materials Market Volume Share (%), by End-user Industry 2025 & 2033
- Figure 35: Europe Building Insulation Materials Market Revenue (Million), by Country 2025 & 2033
- Figure 36: Europe Building Insulation Materials Market Volume (K Tons), by Country 2025 & 2033
- Figure 37: Europe Building Insulation Materials Market Revenue Share (%), by Country 2025 & 2033
- Figure 38: Europe Building Insulation Materials Market Volume Share (%), by Country 2025 & 2033
- Figure 39: South America Building Insulation Materials Market Revenue (Million), by Type 2025 & 2033
- Figure 40: South America Building Insulation Materials Market Volume (K Tons), by Type 2025 & 2033
- Figure 41: South America Building Insulation Materials Market Revenue Share (%), by Type 2025 & 2033
- Figure 42: South America Building Insulation Materials Market Volume Share (%), by Type 2025 & 2033
- Figure 43: South America Building Insulation Materials Market Revenue (Million), by End-user Industry 2025 & 2033
- Figure 44: South America Building Insulation Materials Market Volume (K Tons), by End-user Industry 2025 & 2033
- Figure 45: South America Building Insulation Materials Market Revenue Share (%), by End-user Industry 2025 & 2033
- Figure 46: South America Building Insulation Materials Market Volume Share (%), by End-user Industry 2025 & 2033
- Figure 47: South America Building Insulation Materials Market Revenue (Million), by Country 2025 & 2033
- Figure 48: South America Building Insulation Materials Market Volume (K Tons), by Country 2025 & 2033
- Figure 49: South America Building Insulation Materials Market Revenue Share (%), by Country 2025 & 2033
- Figure 50: South America Building Insulation Materials Market Volume Share (%), by Country 2025 & 2033
- Figure 51: Middle East and Africa Building Insulation Materials Market Revenue (Million), by Type 2025 & 2033
- Figure 52: Middle East and Africa Building Insulation Materials Market Volume (K Tons), by Type 2025 & 2033
- Figure 53: Middle East and Africa Building Insulation Materials Market Revenue Share (%), by Type 2025 & 2033
- Figure 54: Middle East and Africa Building Insulation Materials Market Volume Share (%), by Type 2025 & 2033
- Figure 55: Middle East and Africa Building Insulation Materials Market Revenue (Million), by End-user Industry 2025 & 2033
- Figure 56: Middle East and Africa Building Insulation Materials Market Volume (K Tons), by End-user Industry 2025 & 2033
- Figure 57: Middle East and Africa Building Insulation Materials Market Revenue Share (%), by End-user Industry 2025 & 2033
- Figure 58: Middle East and Africa Building Insulation Materials Market Volume Share (%), by End-user Industry 2025 & 2033
- Figure 59: Middle East and Africa Building Insulation Materials Market Revenue (Million), by Country 2025 & 2033
- Figure 60: Middle East and Africa Building Insulation Materials Market Volume (K Tons), by Country 2025 & 2033
- Figure 61: Middle East and Africa Building Insulation Materials Market Revenue Share (%), by Country 2025 & 2033
- Figure 62: Middle East and Africa Building Insulation Materials Market Volume Share (%), by Country 2025 & 2033
List of Tables
- Table 1: Global Building Insulation Materials Market Revenue Million Forecast, by Type 2020 & 2033
- Table 2: Global Building Insulation Materials Market Volume K Tons Forecast, by Type 2020 & 2033
- Table 3: Global Building Insulation Materials Market Revenue Million Forecast, by End-user Industry 2020 & 2033
- Table 4: Global Building Insulation Materials Market Volume K Tons Forecast, by End-user Industry 2020 & 2033
- Table 5: Global Building Insulation Materials Market Revenue Million Forecast, by Region 2020 & 2033
- Table 6: Global Building Insulation Materials Market Volume K Tons Forecast, by Region 2020 & 2033
- Table 7: Global Building Insulation Materials Market Revenue Million Forecast, by Type 2020 & 2033
- Table 8: Global Building Insulation Materials Market Volume K Tons Forecast, by Type 2020 & 2033
- Table 9: Global Building Insulation Materials Market Revenue Million Forecast, by End-user Industry 2020 & 2033
- Table 10: Global Building Insulation Materials Market Volume K Tons Forecast, by End-user Industry 2020 & 2033
- Table 11: Global Building Insulation Materials Market Revenue Million Forecast, by Country 2020 & 2033
- Table 12: Global Building Insulation Materials Market Volume K Tons Forecast, by Country 2020 & 2033
- Table 13: China Building Insulation Materials Market Revenue (Million) Forecast, by Application 2020 & 2033
- Table 14: China Building Insulation Materials Market Volume (K Tons) Forecast, by Application 2020 & 2033
- Table 15: India Building Insulation Materials Market Revenue (Million) Forecast, by Application 2020 & 2033
- Table 16: India Building Insulation Materials Market Volume (K Tons) Forecast, by Application 2020 & 2033
- Table 17: Japan Building Insulation Materials Market Revenue (Million) Forecast, by Application 2020 & 2033
- Table 18: Japan Building Insulation Materials Market Volume (K Tons) Forecast, by Application 2020 & 2033
- Table 19: South Korea Building Insulation Materials Market Revenue (Million) Forecast, by Application 2020 & 2033
- Table 20: South Korea Building Insulation Materials Market Volume (K Tons) Forecast, by Application 2020 & 2033
- Table 21: Southeast Asia Building Insulation Materials Market Revenue (Million) Forecast, by Application 2020 & 2033
- Table 22: Southeast Asia Building Insulation Materials Market Volume (K Tons) Forecast, by Application 2020 & 2033
- Table 23: Australia Building Insulation Materials Market Revenue (Million) Forecast, by Application 2020 & 2033
- Table 24: Australia Building Insulation Materials Market Volume (K Tons) Forecast, by Application 2020 & 2033
- Table 25: Rest of Asia Pacific Building Insulation Materials Market Revenue (Million) Forecast, by Application 2020 & 2033
- Table 26: Rest of Asia Pacific Building Insulation Materials Market Volume (K Tons) Forecast, by Application 2020 & 2033
- Table 27: Global Building Insulation Materials Market Revenue Million Forecast, by Type 2020 & 2033
- Table 28: Global Building Insulation Materials Market Volume K Tons Forecast, by Type 2020 & 2033
- Table 29: Global Building Insulation Materials Market Revenue Million Forecast, by End-user Industry 2020 & 2033
- Table 30: Global Building Insulation Materials Market Volume K Tons Forecast, by End-user Industry 2020 & 2033
- Table 31: Global Building Insulation Materials Market Revenue Million Forecast, by Country 2020 & 2033
- Table 32: Global Building Insulation Materials Market Volume K Tons Forecast, by Country 2020 & 2033
- Table 33: United States Building Insulation Materials Market Revenue (Million) Forecast, by Application 2020 & 2033
- Table 34: United States Building Insulation Materials Market Volume (K Tons) Forecast, by Application 2020 & 2033
- Table 35: Canada Building Insulation Materials Market Revenue (Million) Forecast, by Application 2020 & 2033
- Table 36: Canada Building Insulation Materials Market Volume (K Tons) Forecast, by Application 2020 & 2033
- Table 37: Mexico Building Insulation Materials Market Revenue (Million) Forecast, by Application 2020 & 2033
- Table 38: Mexico Building Insulation Materials Market Volume (K Tons) Forecast, by Application 2020 & 2033
- Table 39: Global Building Insulation Materials Market Revenue Million Forecast, by Type 2020 & 2033
- Table 40: Global Building Insulation Materials Market Volume K Tons Forecast, by Type 2020 & 2033
- Table 41: Global Building Insulation Materials Market Revenue Million Forecast, by End-user Industry 2020 & 2033
- Table 42: Global Building Insulation Materials Market Volume K Tons Forecast, by End-user Industry 2020 & 2033
- Table 43: Global Building Insulation Materials Market Revenue Million Forecast, by Country 2020 & 2033
- Table 44: Global Building Insulation Materials Market Volume K Tons Forecast, by Country 2020 & 2033
- Table 45: Germany Building Insulation Materials Market Revenue (Million) Forecast, by Application 2020 & 2033
- Table 46: Germany Building Insulation Materials Market Volume (K Tons) Forecast, by Application 2020 & 2033
- Table 47: United Kingdom Building Insulation Materials Market Revenue (Million) Forecast, by Application 2020 & 2033
- Table 48: United Kingdom Building Insulation Materials Market Volume (K Tons) Forecast, by Application 2020 & 2033
- Table 49: Italy Building Insulation Materials Market Revenue (Million) Forecast, by Application 2020 & 2033
- Table 50: Italy Building Insulation Materials Market Volume (K Tons) Forecast, by Application 2020 & 2033
- Table 51: France Building Insulation Materials Market Revenue (Million) Forecast, by Application 2020 & 2033
- Table 52: France Building Insulation Materials Market Volume (K Tons) Forecast, by Application 2020 & 2033
- Table 53: Spain Building Insulation Materials Market Revenue (Million) Forecast, by Application 2020 & 2033
- Table 54: Spain Building Insulation Materials Market Volume (K Tons) Forecast, by Application 2020 & 2033
- Table 55: Rest of Europe Building Insulation Materials Market Revenue (Million) Forecast, by Application 2020 & 2033
- Table 56: Rest of Europe Building Insulation Materials Market Volume (K Tons) Forecast, by Application 2020 & 2033
- Table 57: Global Building Insulation Materials Market Revenue Million Forecast, by Type 2020 & 2033
- Table 58: Global Building Insulation Materials Market Volume K Tons Forecast, by Type 2020 & 2033
- Table 59: Global Building Insulation Materials Market Revenue Million Forecast, by End-user Industry 2020 & 2033
- Table 60: Global Building Insulation Materials Market Volume K Tons Forecast, by End-user Industry 2020 & 2033
- Table 61: Global Building Insulation Materials Market Revenue Million Forecast, by Country 2020 & 2033
- Table 62: Global Building Insulation Materials Market Volume K Tons Forecast, by Country 2020 & 2033
- Table 63: Brazil Building Insulation Materials Market Revenue (Million) Forecast, by Application 2020 & 2033
- Table 64: Brazil Building Insulation Materials Market Volume (K Tons) Forecast, by Application 2020 & 2033
- Table 65: Argentina Building Insulation Materials Market Revenue (Million) Forecast, by Application 2020 & 2033
- Table 66: Argentina Building Insulation Materials Market Volume (K Tons) Forecast, by Application 2020 & 2033
- Table 67: Colombia Building Insulation Materials Market Revenue (Million) Forecast, by Application 2020 & 2033
- Table 68: Colombia Building Insulation Materials Market Volume (K Tons) Forecast, by Application 2020 & 2033
- Table 69: Rest of South America Building Insulation Materials Market Revenue (Million) Forecast, by Application 2020 & 2033
- Table 70: Rest of South America Building Insulation Materials Market Volume (K Tons) Forecast, by Application 2020 & 2033
- Table 71: Global Building Insulation Materials Market Revenue Million Forecast, by Type 2020 & 2033
- Table 72: Global Building Insulation Materials Market Volume K Tons Forecast, by Type 2020 & 2033
- Table 73: Global Building Insulation Materials Market Revenue Million Forecast, by End-user Industry 2020 & 2033
- Table 74: Global Building Insulation Materials Market Volume K Tons Forecast, by End-user Industry 2020 & 2033
- Table 75: Global Building Insulation Materials Market Revenue Million Forecast, by Country 2020 & 2033
- Table 76: Global Building Insulation Materials Market Volume K Tons Forecast, by Country 2020 & 2033
- Table 77: Saudi Arabia Building Insulation Materials Market Revenue (Million) Forecast, by Application 2020 & 2033
- Table 78: Saudi Arabia Building Insulation Materials Market Volume (K Tons) Forecast, by Application 2020 & 2033
- Table 79: South Africa Building Insulation Materials Market Revenue (Million) Forecast, by Application 2020 & 2033
- Table 80: South Africa Building Insulation Materials Market Volume (K Tons) Forecast, by Application 2020 & 2033
- Table 81: United Arab Emirates Building Insulation Materials Market Revenue (Million) Forecast, by Application 2020 & 2033
- Table 82: United Arab Emirates Building Insulation Materials Market Volume (K Tons) Forecast, by Application 2020 & 2033
- Table 83: Nigeria Building Insulation Materials Market Revenue (Million) Forecast, by Application 2020 & 2033
- Table 84: Nigeria Building Insulation Materials Market Volume (K Tons) Forecast, by Application 2020 & 2033
- Table 85: Rest of Middle East and Africa Building Insulation Materials Market Revenue (Million) Forecast, by Application 2020 & 2033
- Table 86: Rest of Middle East and Africa Building Insulation Materials Market Volume (K Tons) Forecast, by Application 2020 & 2033
Frequently Asked Questions
1. What is the projected Compound Annual Growth Rate (CAGR) of the Building Insulation Materials Market?
The projected CAGR is approximately > 4.00%.
2. Which companies are prominent players in the Building Insulation Materials Market?
Key companies in the market include Knauf Gips KG, Saint-Gobain, Synthos, Kingspan Group, BASF SE, Huntsman International LLC, DuPont, ROCKWOOL International A/S, Atlas Roofing Corporation, Beijing New Building Material (Group) Co Ltd, GAF, Owens Corning (including Paroc Group), Johns Manville.
3. What are the main segments of the Building Insulation Materials Market?
The market segments include Type, End-user Industry.
4. Can you provide details about the market size?
The market size is estimated to be USD 30.36 Million as of 2022.
5. What are some drivers contributing to market growth?
Growing Demand for Energy Efficiency; Rising Infrastructure and Industrialization in Asia-Pacific.
6. What are the notable trends driving market growth?
The Residential Segment to Dominate the Market.
7. Are there any restraints impacting market growth?
Harmful Effects as a Result of Exposure to Certain High-temperature Insulation Materials.
8. Can you provide examples of recent developments in the market?
November 2023: Kingspan Group launched the HemKor range, under which the company offered its first bio-based insulation product. The product was largely made of hemp to enable it to drive down the embodied carbon of buildings.
9. What pricing options are available for accessing the report?
Pricing options include single-user, multi-user, and enterprise licenses priced at USD 4750, USD 5250, and USD 8750 respectively.
10. Is the market size provided in terms of value or volume?
The market size is provided in terms of value, measured in Million and volume, measured in K Tons.
11. Are there any specific market keywords associated with the report?
Yes, the market keyword associated with the report is "Building Insulation Materials Market," which aids in identifying and referencing the specific market segment covered.
12. How do I determine which pricing option suits my needs best?
The pricing options vary based on user requirements and access needs. Individual users may opt for single-user licenses, while businesses requiring broader access may choose multi-user or enterprise licenses for cost-effective access to the report.
13. Are there any additional resources or data provided in the Building Insulation Materials Market report?
While the report offers comprehensive insights, it's advisable to review the specific contents or supplementary materials provided to ascertain if additional resources or data are available.
14. How can I stay updated on further developments or reports in the Building Insulation Materials Market?
To stay informed about further developments, trends, and reports in the Building Insulation Materials Market, consider subscribing to industry newsletters, following relevant companies and organizations, or regularly checking reputable industry news sources and publications.
Methodology
Step 1 - Identification of Relevant Samples Size from Population Database


Step 2 - Approaches for Defining Global Market Size (Value, Volume* & Price*)

Note*: In applicable scenarios
Step 3 - Data Sources
Primary Research
- Web Analytics
- Survey Reports
- Research Institute
- Latest Research Reports
- Opinion Leaders
Secondary Research
- Annual Reports
- White Paper
- Latest Press Release
- Industry Association
- Paid Database
- Investor Presentations

Step 4 - Data Triangulation
Involves using different sources of information in order to increase the validity of a study
These sources are likely to be stakeholders in a program - participants, other researchers, program staff, other community members, and so on.
Then we put all data in single framework & apply various statistical tools to find out the dynamic on the market.
During the analysis stage, feedback from the stakeholder groups would be compared to determine areas of agreement as well as areas of divergence