

Key Insights
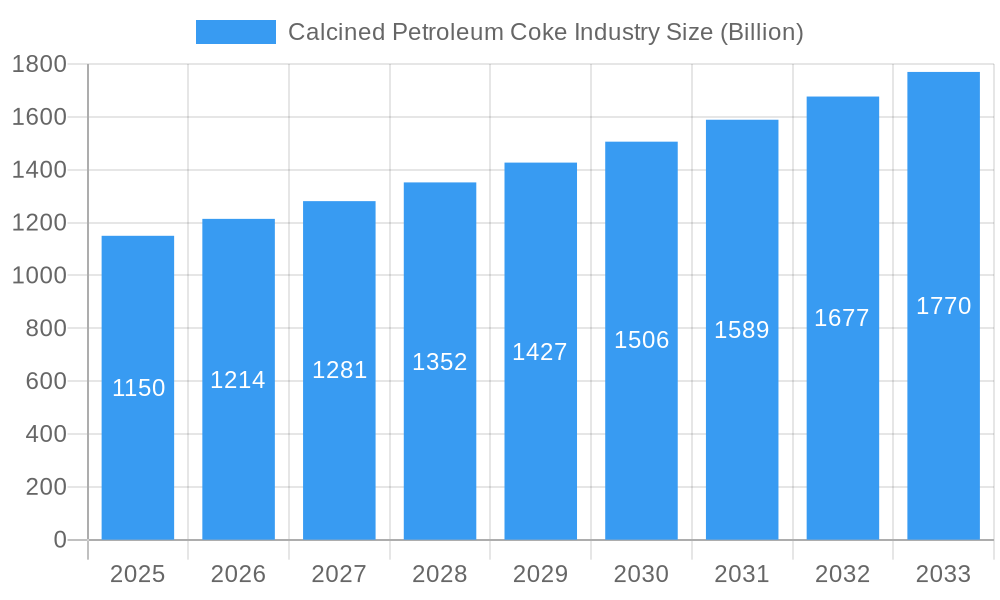
The global calcined petroleum coke (CPC) market, valued at $1.15 billion in 2025, is projected to experience robust growth, driven by increasing demand from the aluminum and steel industries. The rising global consumption of aluminum, fueled by burgeoning construction and automotive sectors, significantly boosts the need for CPC as a crucial reducing agent in aluminum smelting. Similarly, the steel industry relies on CPC as a fuel source and carbon additive, contributing to its market demand. The shift towards sustainable practices is also influencing the CPC market. While concerns regarding environmental impact and stricter emission regulations pose challenges, the industry is actively exploring ways to mitigate these concerns, including optimizing production processes and developing cleaner alternatives. Technological advancements in CPC production, focusing on improved quality and efficiency, are expected to further drive market expansion. Competition among key players like Oxbow Corporation, Petrocoque, and Rain Carbon Inc. is intensifying, leading to innovations in product offerings and distribution networks. The Asia-Pacific region, particularly China and India, represents a significant market due to the presence of large aluminum and steel production facilities. North America and Europe also maintain substantial market shares, owing to their developed industrial infrastructure and established downstream industries. However, variations in regional regulations and economic growth rates will influence the market's trajectory in each region. The forecast period of 2025-2033 anticipates continued growth, though the rate may fluctuate based on global economic conditions and government policies related to environmental sustainability.
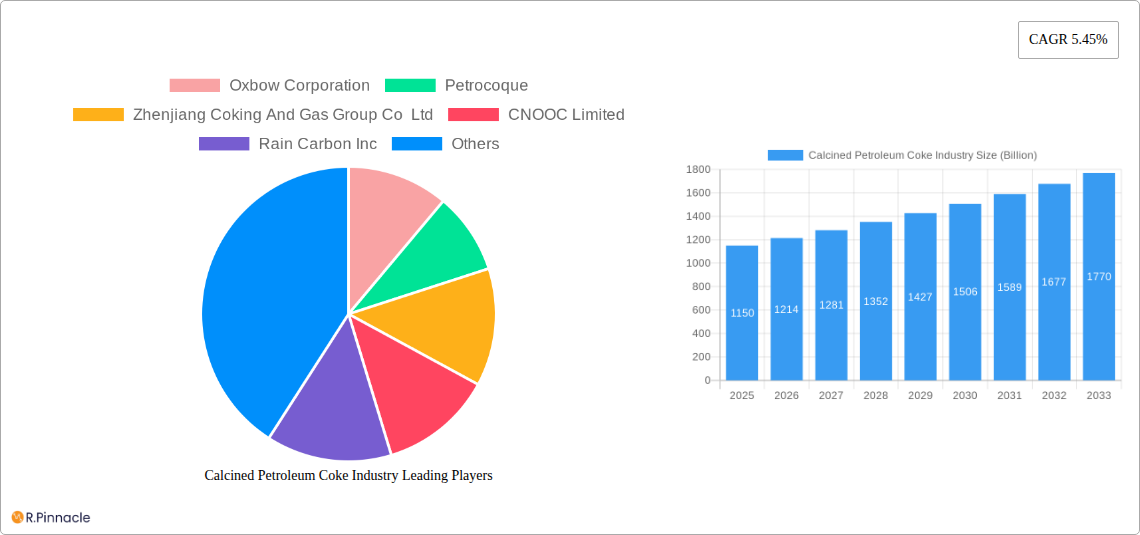
Calcined Petroleum Coke Industry Market Size (In Billion)
The diverse applications of CPC extend beyond aluminum smelting and steel production, encompassing the manufacturing of bricks, glass, and other carbon products. This diversification provides a degree of resilience to the market, mitigating potential risks associated with fluctuations in demand from any single sector. The fuel grade segment is likely to remain a major contributor to market revenue due to its widespread use in various industrial processes. However, the application segments, particularly green petroleum coke, are anticipated to experience relatively faster growth due to increasing focus on environmental sustainability and the development of innovative applications in green technologies. The ongoing research and development efforts aimed at improving CPC’s properties and exploring new applications will likely contribute to the market’s growth over the coming years. Geographical expansion and strategic partnerships by major players will also play a significant role in shaping the competitive landscape and market penetration.
Calcined Petroleum Coke Industry Company Market Share
Calcined Petroleum Coke Industry: A Comprehensive Market Report (2019-2033)
This in-depth report provides a comprehensive analysis of the global Calcined Petroleum Coke industry, offering invaluable insights for industry professionals, investors, and stakeholders. Covering the period from 2019 to 2033, with a base year of 2025, this report meticulously examines market dynamics, competitive landscapes, and future growth prospects. The market is projected to reach a value of $XX Billion by 2033.
Calcined Petroleum Coke Industry Market Structure & Innovation Trends
The Calcined Petroleum Coke market exhibits a moderately concentrated structure, with key players like Oxbow Corporation, Petrocoque, and Rain Carbon Inc holding significant market share. The market share for these leading players fluctuates annually depending on various factors, including production capacity, technological advancements, and market demand. For example, Oxbow Corporation's market share is estimated to be around xx% in 2025, while Petrocoque holds approximately xx%. Innovation is driven by the need for higher-quality coke with improved properties, particularly for the aluminum and steel industries. Stringent environmental regulations are also significant drivers of innovation, pushing companies to develop cleaner production processes and explore alternative applications for petroleum coke.
Mergers and acquisitions (M&A) activity is moderate, with recent deals reflecting consolidation trends and strategic expansion efforts. For example, the acquisition of DCP Midstream by Phillips 66 in January 2023 signifies a move toward greater vertical integration and enhanced market control within the petroleum coke sector. While specific deal values are not always publicly available, we estimate that the total value of M&A activity in the sector between 2019 and 2024 exceeded $XX Billion. Product substitutes, such as coal and natural gas, exist but face challenges in replicating the specific properties of calcined petroleum coke in certain applications. End-user demographics are primarily focused on the aluminum, steel, and cement industries, with varying demands influenced by global construction and manufacturing activities.
Calcined Petroleum Coke Industry Market Dynamics & Trends
The global calcined petroleum coke market is experiencing steady growth, driven by robust demand from the aluminum industry and the ongoing expansion of the global infrastructure sector. The Compound Annual Growth Rate (CAGR) for the forecast period (2025-2033) is estimated at xx%, indicating significant market expansion. Technological disruptions in the form of improved refining processes and the exploration of alternative applications for petroleum coke contribute to the market dynamics. For example, ExxonMobil's research into converting petroleum coke into graphene represents a promising technological disruption. The development and adoption of these technologies will further drive market growth and impact the market penetration of the different segments. Consumer preferences are evolving toward higher-quality, cleaner calcined petroleum coke, which necessitates ongoing improvements in production processes. Competitive dynamics remain strong with leading players continually innovating to enhance product quality, lower production costs and optimize distribution channels. The market penetration of fuel-grade calcined coke continues to be high, due to its established use in the aluminum industry and energy sector.
Dominant Regions & Segments in Calcined Petroleum Coke Industry
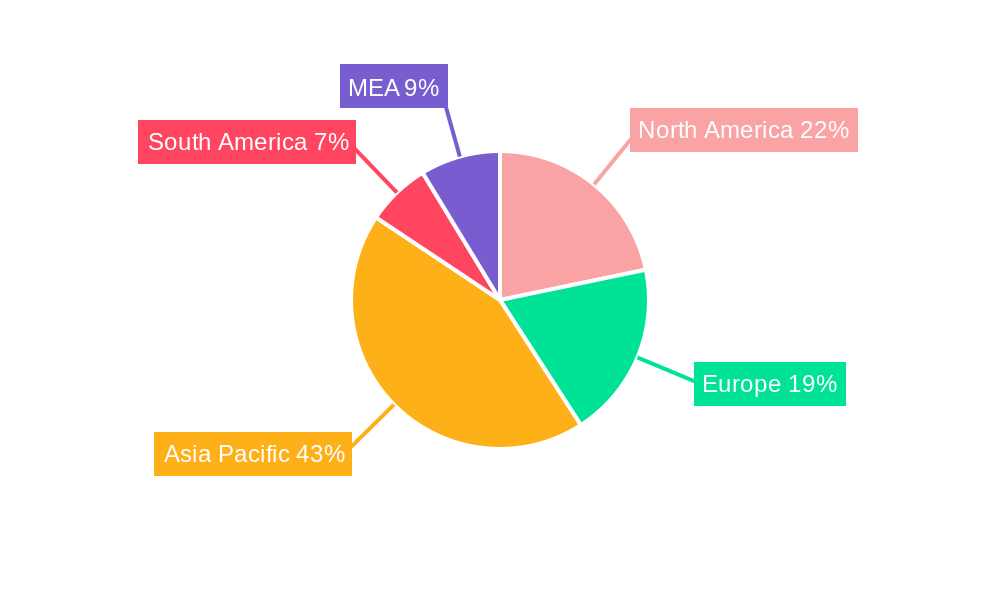
The Asia-Pacific region, particularly China and India, dominates the global calcined petroleum coke market due to rapid industrialization, particularly in aluminum production, and increasing construction activity.
Key Drivers in the Asia-Pacific Region:
- Strong economic growth fueling infrastructure development.
- Expansion of the aluminum smelting industry.
- Government support for industrial growth initiatives.
Dominant Segments:
- Type: Fuel-grade calcined petroleum coke currently holds the largest market share, due to its widespread use in various industries, such as energy generation. Calcined coke holds a significant share, mainly used in the aluminum industry.
- Application: Green petroleum coke is a growing segment driven by rising environmental awareness. However, the 'Others' segment (bricks, glass, carbon products) contributes significantly to overall demand.
The dominance of the Asia-Pacific region is attributed to its robust industrial growth, significant aluminum production, and favorable economic conditions. Other regions such as North America and Europe also play key roles, but their growth rates are currently slower than in the Asia-Pacific region. This difference largely stems from variations in industrial development, governmental policies, and market regulations, influencing the market share and growth rate of each geographic segment.
Calcined Petroleum Coke Industry Product Innovations
Recent product innovations focus on enhancing the quality and consistency of calcined petroleum coke to meet the evolving demands of downstream industries. Companies are investing in advanced technologies to reduce impurities, improve the reactivity of the product, and offer tailored solutions for specific applications. This includes advancements in the calcination process to achieve a more uniform product and enhanced quality control mechanisms throughout the production chain. The development of specialized grades of calcined petroleum coke caters to the needs of particular industries, particularly the aluminum industry, which demands high-quality coke for optimal smelting processes. These improvements directly contribute to enhanced efficiency and profitability across the value chain.
Report Scope & Segmentation Analysis
This report segments the calcined petroleum coke market based on type (Fuel Grade, Calcined Coke) and application (Green Petroleum Coke, Others – Bricks, Glass, Carbon Products, etc.).
Type: The Fuel Grade segment is expected to exhibit steady growth due to its widespread use in power generation and industrial applications. The Calcined Coke segment is expected to show strong growth mainly driven by the aluminum industry. Both segments are characterized by intense competition, with companies striving to improve product quality and efficiency.
Application: The Green Petroleum Coke segment is gaining traction due to its sustainability aspects, with market growth projected at xx% during the forecast period. The "Others" segment, encompassing diverse applications, shows steady but comparatively slower growth, primarily driven by the construction and industrial sectors. Competitive dynamics within each segment are influenced by factors such as product quality, price, and geographic reach.
Key Drivers of Calcined Petroleum Coke Industry Growth
The growth of the calcined petroleum coke industry is propelled by several key drivers, including the robust demand from the aluminum industry, the expansion of the global infrastructure sector, and the rising energy demands worldwide. The increasing demand for fuel-grade calcined petroleum coke in power generation is also a significant driver. Furthermore, technological advancements focused on improving product quality and efficiency contribute to market expansion. Favorable government policies in some regions, aimed at boosting industrial growth, further propel market growth.
Challenges in the Calcined Petroleum Coke Industry Sector
The calcined petroleum coke industry faces several challenges, including stringent environmental regulations regarding emissions and waste management, which lead to increased production costs and compliance requirements. Fluctuations in crude oil prices and the availability of petroleum feedstock present an ongoing challenge to the industry's stability. Competition from alternative materials, such as coal and natural gas, in specific applications also exerts downward pressure on prices and market share. These factors collectively contribute to the overall complexity and uncertainty within the calcined petroleum coke market.
Emerging Opportunities in Calcined Petroleum Coke Industry
Emerging opportunities lie in the development of new applications for calcined petroleum coke, such as its use in advanced materials and carbon capture technologies. The development of value-added products based on petroleum coke presents a significant opportunity for innovation and market expansion. Growing demand in emerging economies, particularly in Asia and Africa, also creates favorable growth prospects for the industry. Increased investment in research and development aimed at enhancing sustainability and efficiency will drive further opportunities.
Leading Players in the Calcined Petroleum Coke Industry Market
- Oxbow Corporation
- Petrocoque
- Zhenjiang Coking And Gas Group Co Ltd
- CNOOC Limited
- Rain Carbon Inc
- Aluminium Bahrain B S C (Alba)
- Rio Tinto
- Numaligarh Refinery Limited
- Phillips 66 Company
- Maniayargroup
- Saudi Calcined Petroleum Coke Company (SCPC)
- BP PLC
- ELSID SA
Key Developments in Calcined Petroleum Coke Industry
- January 2023: Phillips 66 acquired all publicly traded standard units representing limited partner interests in DCP Midstream, increasing its economic interest to 86.8%. This significantly strengthens Phillips 66's position in the petroleum coke market.
- June 2022: ExxonMobil and Texas A&M University researchers developed a method to reprocess petroleum coke into graphene, opening avenues for high-value applications and potentially reducing waste.
Future Outlook for Calcined Petroleum Coke Industry Market
The future of the calcined petroleum coke industry appears promising, driven by sustained demand from key industries, technological advancements, and the exploration of new applications. Strategic partnerships, investments in research and development, and a focus on sustainability will be crucial for success in the coming years. The industry is expected to experience continued growth, although at a rate that may be influenced by fluctuations in global economic conditions and the ongoing development of alternative materials. The development of specialized grades of coke catering to niche markets presents promising avenues for expansion.
Calcined Petroleum Coke Industry Segmentation
-
1. Type
- 1.1. Fuel Grade
- 1.2. Calcined Coke
-
2. Application
-
2.1. Green Petroleum Coke
- 2.1.1. Aluminum
- 2.1.2. Fuel
- 2.1.3. Iron and steel
- 2.1.4. Silicon Metal
- 2.1.5. Others (Bricks, Glass, Carbon Products, etc)
-
2.2. Calcined Petroleum Coke
- 2.2.1. Titanium Dioxide
- 2.2.2. Re-carburizing Market
- 2.2.3. Others (Needle Coke, Carbon Products, etc)
-
2.1. Green Petroleum Coke
Calcined Petroleum Coke Industry Segmentation By Geography
-
1. Asia Pacific
- 1.1. China
- 1.2. India
- 1.3. Japan
- 1.4. South Korea
- 1.5. ASEAN Countries
- 1.6. Rest of Asia Pacific
-
2. North America
- 2.1. United States
- 2.2. Canada
- 2.3. Mexico
-
3. Europe
- 3.1. Germany
- 3.2. United Kingdom
- 3.3. Italy
- 3.4. France
- 3.5. Spain
- 3.6. Rest of Europe
-
4. South America
- 4.1. Brazil
- 4.2. Argentina
- 4.3. Rest of South America
-
5. Middle East and Africa
- 5.1. Saudi Arabia
- 5.2. South Africa
- 5.3. Rest of Middle East and Africa
Calcined Petroleum Coke Industry Regional Market Share
Geographic Coverage of Calcined Petroleum Coke Industry
Calcined Petroleum Coke Industry REPORT HIGHLIGHTS
| Aspects | Details |
|---|---|
| Study Period | 2020-2034 |
| Base Year | 2025 |
| Estimated Year | 2026 |
| Forecast Period | 2026-2034 |
| Historical Period | 2020-2025 |
| Growth Rate | CAGR of 5.45% from 2020-2034 |
| Segmentation |
|
Table of Contents
- 1. Introduction
- 1.1. Research Scope
- 1.2. Market Segmentation
- 1.3. Research Objective
- 1.4. Definitions and Assumptions
- 2. Executive Summary
- 2.1. Market Snapshot
- 3. Market Dynamics
- 3.1. Market Drivers
- 3.2. Market Restrains
- 3.3. Market Trends
- 3.4. Market Opportunities
- 4. Market Factor Analysis
- 4.1. Porters Five Forces
- 4.1.1. Bargaining Power of Suppliers
- 4.1.2. Bargaining Power of Buyers
- 4.1.3. Threat of New Entrants
- 4.1.4. Threat of Substitutes
- 4.1.5. Competitive Rivalry
- 4.2. PESTEL analysis
- 4.3. BCG Analysis
- 4.3.1. Stars (High Growth, High Market Share)
- 4.3.2. Cash Cows (Low Growth, High Market Share)
- 4.3.3. Question Mark (High Growth, Low Market Share)
- 4.3.4. Dogs (Low Growth, Low Market Share)
- 4.4. Ansoff Matrix Analysis
- 4.5. Supply Chain Analysis
- 4.6. Regulatory Landscape
- 4.7. Current Market Potential and Opportunity Assessment (TAM–SAM–SOM Framework)
- 4.8. PRI Analyst Note
- 4.1. Porters Five Forces
- 5. Market Analysis, Insights and Forecast 2021-2033
- 5.1. Market Analysis, Insights and Forecast - by Type
- 5.1.1. Fuel Grade
- 5.1.2. Calcined Coke
- 5.2. Market Analysis, Insights and Forecast - by Application
- 5.2.1. Green Petroleum Coke
- 5.2.1.1. Aluminum
- 5.2.1.2. Fuel
- 5.2.1.3. Iron and steel
- 5.2.1.4. Silicon Metal
- 5.2.1.5. Others (Bricks, Glass, Carbon Products, etc)
- 5.2.2. Calcined Petroleum Coke
- 5.2.2.1. Titanium Dioxide
- 5.2.2.2. Re-carburizing Market
- 5.2.2.3. Others (Needle Coke, Carbon Products, etc)
- 5.2.1. Green Petroleum Coke
- 5.3. Market Analysis, Insights and Forecast - by Region
- 5.3.1. Asia Pacific
- 5.3.2. North America
- 5.3.3. Europe
- 5.3.4. South America
- 5.3.5. Middle East and Africa
- 5.1. Market Analysis, Insights and Forecast - by Type
- 6. Global Calcined Petroleum Coke Industry Analysis, Insights and Forecast, 2021-2033
- 6.1. Market Analysis, Insights and Forecast - by Type
- 6.1.1. Fuel Grade
- 6.1.2. Calcined Coke
- 6.2. Market Analysis, Insights and Forecast - by Application
- 6.2.1. Green Petroleum Coke
- 6.2.1.1. Aluminum
- 6.2.1.2. Fuel
- 6.2.1.3. Iron and steel
- 6.2.1.4. Silicon Metal
- 6.2.1.5. Others (Bricks, Glass, Carbon Products, etc)
- 6.2.2. Calcined Petroleum Coke
- 6.2.2.1. Titanium Dioxide
- 6.2.2.2. Re-carburizing Market
- 6.2.2.3. Others (Needle Coke, Carbon Products, etc)
- 6.2.1. Green Petroleum Coke
- 6.1. Market Analysis, Insights and Forecast - by Type
- 7. Asia Pacific Calcined Petroleum Coke Industry Analysis, Insights and Forecast, 2020-2032
- 7.1. Market Analysis, Insights and Forecast - by Type
- 7.1.1. Fuel Grade
- 7.1.2. Calcined Coke
- 7.2. Market Analysis, Insights and Forecast - by Application
- 7.2.1. Green Petroleum Coke
- 7.2.1.1. Aluminum
- 7.2.1.2. Fuel
- 7.2.1.3. Iron and steel
- 7.2.1.4. Silicon Metal
- 7.2.1.5. Others (Bricks, Glass, Carbon Products, etc)
- 7.2.2. Calcined Petroleum Coke
- 7.2.2.1. Titanium Dioxide
- 7.2.2.2. Re-carburizing Market
- 7.2.2.3. Others (Needle Coke, Carbon Products, etc)
- 7.2.1. Green Petroleum Coke
- 7.1. Market Analysis, Insights and Forecast - by Type
- 8. North America Calcined Petroleum Coke Industry Analysis, Insights and Forecast, 2020-2032
- 8.1. Market Analysis, Insights and Forecast - by Type
- 8.1.1. Fuel Grade
- 8.1.2. Calcined Coke
- 8.2. Market Analysis, Insights and Forecast - by Application
- 8.2.1. Green Petroleum Coke
- 8.2.1.1. Aluminum
- 8.2.1.2. Fuel
- 8.2.1.3. Iron and steel
- 8.2.1.4. Silicon Metal
- 8.2.1.5. Others (Bricks, Glass, Carbon Products, etc)
- 8.2.2. Calcined Petroleum Coke
- 8.2.2.1. Titanium Dioxide
- 8.2.2.2. Re-carburizing Market
- 8.2.2.3. Others (Needle Coke, Carbon Products, etc)
- 8.2.1. Green Petroleum Coke
- 8.1. Market Analysis, Insights and Forecast - by Type
- 9. Europe Calcined Petroleum Coke Industry Analysis, Insights and Forecast, 2020-2032
- 9.1. Market Analysis, Insights and Forecast - by Type
- 9.1.1. Fuel Grade
- 9.1.2. Calcined Coke
- 9.2. Market Analysis, Insights and Forecast - by Application
- 9.2.1. Green Petroleum Coke
- 9.2.1.1. Aluminum
- 9.2.1.2. Fuel
- 9.2.1.3. Iron and steel
- 9.2.1.4. Silicon Metal
- 9.2.1.5. Others (Bricks, Glass, Carbon Products, etc)
- 9.2.2. Calcined Petroleum Coke
- 9.2.2.1. Titanium Dioxide
- 9.2.2.2. Re-carburizing Market
- 9.2.2.3. Others (Needle Coke, Carbon Products, etc)
- 9.2.1. Green Petroleum Coke
- 9.1. Market Analysis, Insights and Forecast - by Type
- 10. South America Calcined Petroleum Coke Industry Analysis, Insights and Forecast, 2020-2032
- 10.1. Market Analysis, Insights and Forecast - by Type
- 10.1.1. Fuel Grade
- 10.1.2. Calcined Coke
- 10.2. Market Analysis, Insights and Forecast - by Application
- 10.2.1. Green Petroleum Coke
- 10.2.1.1. Aluminum
- 10.2.1.2. Fuel
- 10.2.1.3. Iron and steel
- 10.2.1.4. Silicon Metal
- 10.2.1.5. Others (Bricks, Glass, Carbon Products, etc)
- 10.2.2. Calcined Petroleum Coke
- 10.2.2.1. Titanium Dioxide
- 10.2.2.2. Re-carburizing Market
- 10.2.2.3. Others (Needle Coke, Carbon Products, etc)
- 10.2.1. Green Petroleum Coke
- 10.1. Market Analysis, Insights and Forecast - by Type
- 11. Middle East and Africa Calcined Petroleum Coke Industry Analysis, Insights and Forecast, 2020-2032
- 11.1. Market Analysis, Insights and Forecast - by Type
- 11.1.1. Fuel Grade
- 11.1.2. Calcined Coke
- 11.2. Market Analysis, Insights and Forecast - by Application
- 11.2.1. Green Petroleum Coke
- 11.2.1.1. Aluminum
- 11.2.1.2. Fuel
- 11.2.1.3. Iron and steel
- 11.2.1.4. Silicon Metal
- 11.2.1.5. Others (Bricks, Glass, Carbon Products, etc)
- 11.2.2. Calcined Petroleum Coke
- 11.2.2.1. Titanium Dioxide
- 11.2.2.2. Re-carburizing Market
- 11.2.2.3. Others (Needle Coke, Carbon Products, etc)
- 11.2.1. Green Petroleum Coke
- 11.1. Market Analysis, Insights and Forecast - by Type
- 12. Competitive Analysis
- 12.1. Company Profiles
- 12.1.1 Oxbow Corporation
- 12.1.1.1. Company Overview
- 12.1.1.2. Products
- 12.1.1.3. Company Financials
- 12.1.1.4. SWOT Analysis
- 12.1.2 Petrocoque
- 12.1.2.1. Company Overview
- 12.1.2.2. Products
- 12.1.2.3. Company Financials
- 12.1.2.4. SWOT Analysis
- 12.1.3 Zhenjiang Coking And Gas Group Co Ltd
- 12.1.3.1. Company Overview
- 12.1.3.2. Products
- 12.1.3.3. Company Financials
- 12.1.3.4. SWOT Analysis
- 12.1.4 CNOOC Limited
- 12.1.4.1. Company Overview
- 12.1.4.2. Products
- 12.1.4.3. Company Financials
- 12.1.4.4. SWOT Analysis
- 12.1.5 Rain Carbon Inc
- 12.1.5.1. Company Overview
- 12.1.5.2. Products
- 12.1.5.3. Company Financials
- 12.1.5.4. SWOT Analysis
- 12.1.6 Aluminium Bahrain B S C (Alba)
- 12.1.6.1. Company Overview
- 12.1.6.2. Products
- 12.1.6.3. Company Financials
- 12.1.6.4. SWOT Analysis
- 12.1.7 Rio Tinto
- 12.1.7.1. Company Overview
- 12.1.7.2. Products
- 12.1.7.3. Company Financials
- 12.1.7.4. SWOT Analysis
- 12.1.8 Numaligarh Refinery Limited
- 12.1.8.1. Company Overview
- 12.1.8.2. Products
- 12.1.8.3. Company Financials
- 12.1.8.4. SWOT Analysis
- 12.1.9 Phillips 66 Company
- 12.1.9.1. Company Overview
- 12.1.9.2. Products
- 12.1.9.3. Company Financials
- 12.1.9.4. SWOT Analysis
- 12.1.10 Maniayargroup
- 12.1.10.1. Company Overview
- 12.1.10.2. Products
- 12.1.10.3. Company Financials
- 12.1.10.4. SWOT Analysis
- 12.1.11 Saudi Calcined Petroleum Coke Company (SCPC)
- 12.1.11.1. Company Overview
- 12.1.11.2. Products
- 12.1.11.3. Company Financials
- 12.1.11.4. SWOT Analysis
- 12.1.12 BP PLC
- 12.1.12.1. Company Overview
- 12.1.12.2. Products
- 12.1.12.3. Company Financials
- 12.1.12.4. SWOT Analysis
- 12.1.13 ELSID SA
- 12.1.13.1. Company Overview
- 12.1.13.2. Products
- 12.1.13.3. Company Financials
- 12.1.13.4. SWOT Analysis
- 12.1.1 Oxbow Corporation
- 12.2. Market Entropy
- 12.2.1 Company's Key Areas Served
- 12.2.2 Recent Developments
- 12.3. Company Market Share Analysis 2025
- 12.3.1 Top 5 Companies Market Share Analysis
- 12.3.2 Top 3 Companies Market Share Analysis
- 12.4. List of Potential Customers
- 13. Research Methodology
List of Figures
- Figure 1: Global Calcined Petroleum Coke Industry Revenue Breakdown (Billion, %) by Region 2025 & 2033
- Figure 2: Global Calcined Petroleum Coke Industry Volume Breakdown (K Tons, %) by Region 2025 & 2033
- Figure 3: Asia Pacific Calcined Petroleum Coke Industry Revenue (Billion), by Type 2025 & 2033
- Figure 4: Asia Pacific Calcined Petroleum Coke Industry Volume (K Tons), by Type 2025 & 2033
- Figure 5: Asia Pacific Calcined Petroleum Coke Industry Revenue Share (%), by Type 2025 & 2033
- Figure 6: Asia Pacific Calcined Petroleum Coke Industry Volume Share (%), by Type 2025 & 2033
- Figure 7: Asia Pacific Calcined Petroleum Coke Industry Revenue (Billion), by Application 2025 & 2033
- Figure 8: Asia Pacific Calcined Petroleum Coke Industry Volume (K Tons), by Application 2025 & 2033
- Figure 9: Asia Pacific Calcined Petroleum Coke Industry Revenue Share (%), by Application 2025 & 2033
- Figure 10: Asia Pacific Calcined Petroleum Coke Industry Volume Share (%), by Application 2025 & 2033
- Figure 11: Asia Pacific Calcined Petroleum Coke Industry Revenue (Billion), by Country 2025 & 2033
- Figure 12: Asia Pacific Calcined Petroleum Coke Industry Volume (K Tons), by Country 2025 & 2033
- Figure 13: Asia Pacific Calcined Petroleum Coke Industry Revenue Share (%), by Country 2025 & 2033
- Figure 14: Asia Pacific Calcined Petroleum Coke Industry Volume Share (%), by Country 2025 & 2033
- Figure 15: North America Calcined Petroleum Coke Industry Revenue (Billion), by Type 2025 & 2033
- Figure 16: North America Calcined Petroleum Coke Industry Volume (K Tons), by Type 2025 & 2033
- Figure 17: North America Calcined Petroleum Coke Industry Revenue Share (%), by Type 2025 & 2033
- Figure 18: North America Calcined Petroleum Coke Industry Volume Share (%), by Type 2025 & 2033
- Figure 19: North America Calcined Petroleum Coke Industry Revenue (Billion), by Application 2025 & 2033
- Figure 20: North America Calcined Petroleum Coke Industry Volume (K Tons), by Application 2025 & 2033
- Figure 21: North America Calcined Petroleum Coke Industry Revenue Share (%), by Application 2025 & 2033
- Figure 22: North America Calcined Petroleum Coke Industry Volume Share (%), by Application 2025 & 2033
- Figure 23: North America Calcined Petroleum Coke Industry Revenue (Billion), by Country 2025 & 2033
- Figure 24: North America Calcined Petroleum Coke Industry Volume (K Tons), by Country 2025 & 2033
- Figure 25: North America Calcined Petroleum Coke Industry Revenue Share (%), by Country 2025 & 2033
- Figure 26: North America Calcined Petroleum Coke Industry Volume Share (%), by Country 2025 & 2033
- Figure 27: Europe Calcined Petroleum Coke Industry Revenue (Billion), by Type 2025 & 2033
- Figure 28: Europe Calcined Petroleum Coke Industry Volume (K Tons), by Type 2025 & 2033
- Figure 29: Europe Calcined Petroleum Coke Industry Revenue Share (%), by Type 2025 & 2033
- Figure 30: Europe Calcined Petroleum Coke Industry Volume Share (%), by Type 2025 & 2033
- Figure 31: Europe Calcined Petroleum Coke Industry Revenue (Billion), by Application 2025 & 2033
- Figure 32: Europe Calcined Petroleum Coke Industry Volume (K Tons), by Application 2025 & 2033
- Figure 33: Europe Calcined Petroleum Coke Industry Revenue Share (%), by Application 2025 & 2033
- Figure 34: Europe Calcined Petroleum Coke Industry Volume Share (%), by Application 2025 & 2033
- Figure 35: Europe Calcined Petroleum Coke Industry Revenue (Billion), by Country 2025 & 2033
- Figure 36: Europe Calcined Petroleum Coke Industry Volume (K Tons), by Country 2025 & 2033
- Figure 37: Europe Calcined Petroleum Coke Industry Revenue Share (%), by Country 2025 & 2033
- Figure 38: Europe Calcined Petroleum Coke Industry Volume Share (%), by Country 2025 & 2033
- Figure 39: South America Calcined Petroleum Coke Industry Revenue (Billion), by Type 2025 & 2033
- Figure 40: South America Calcined Petroleum Coke Industry Volume (K Tons), by Type 2025 & 2033
- Figure 41: South America Calcined Petroleum Coke Industry Revenue Share (%), by Type 2025 & 2033
- Figure 42: South America Calcined Petroleum Coke Industry Volume Share (%), by Type 2025 & 2033
- Figure 43: South America Calcined Petroleum Coke Industry Revenue (Billion), by Application 2025 & 2033
- Figure 44: South America Calcined Petroleum Coke Industry Volume (K Tons), by Application 2025 & 2033
- Figure 45: South America Calcined Petroleum Coke Industry Revenue Share (%), by Application 2025 & 2033
- Figure 46: South America Calcined Petroleum Coke Industry Volume Share (%), by Application 2025 & 2033
- Figure 47: South America Calcined Petroleum Coke Industry Revenue (Billion), by Country 2025 & 2033
- Figure 48: South America Calcined Petroleum Coke Industry Volume (K Tons), by Country 2025 & 2033
- Figure 49: South America Calcined Petroleum Coke Industry Revenue Share (%), by Country 2025 & 2033
- Figure 50: South America Calcined Petroleum Coke Industry Volume Share (%), by Country 2025 & 2033
- Figure 51: Middle East and Africa Calcined Petroleum Coke Industry Revenue (Billion), by Type 2025 & 2033
- Figure 52: Middle East and Africa Calcined Petroleum Coke Industry Volume (K Tons), by Type 2025 & 2033
- Figure 53: Middle East and Africa Calcined Petroleum Coke Industry Revenue Share (%), by Type 2025 & 2033
- Figure 54: Middle East and Africa Calcined Petroleum Coke Industry Volume Share (%), by Type 2025 & 2033
- Figure 55: Middle East and Africa Calcined Petroleum Coke Industry Revenue (Billion), by Application 2025 & 2033
- Figure 56: Middle East and Africa Calcined Petroleum Coke Industry Volume (K Tons), by Application 2025 & 2033
- Figure 57: Middle East and Africa Calcined Petroleum Coke Industry Revenue Share (%), by Application 2025 & 2033
- Figure 58: Middle East and Africa Calcined Petroleum Coke Industry Volume Share (%), by Application 2025 & 2033
- Figure 59: Middle East and Africa Calcined Petroleum Coke Industry Revenue (Billion), by Country 2025 & 2033
- Figure 60: Middle East and Africa Calcined Petroleum Coke Industry Volume (K Tons), by Country 2025 & 2033
- Figure 61: Middle East and Africa Calcined Petroleum Coke Industry Revenue Share (%), by Country 2025 & 2033
- Figure 62: Middle East and Africa Calcined Petroleum Coke Industry Volume Share (%), by Country 2025 & 2033
List of Tables
- Table 1: Global Calcined Petroleum Coke Industry Revenue Billion Forecast, by Type 2020 & 2033
- Table 2: Global Calcined Petroleum Coke Industry Volume K Tons Forecast, by Type 2020 & 2033
- Table 3: Global Calcined Petroleum Coke Industry Revenue Billion Forecast, by Application 2020 & 2033
- Table 4: Global Calcined Petroleum Coke Industry Volume K Tons Forecast, by Application 2020 & 2033
- Table 5: Global Calcined Petroleum Coke Industry Revenue Billion Forecast, by Region 2020 & 2033
- Table 6: Global Calcined Petroleum Coke Industry Volume K Tons Forecast, by Region 2020 & 2033
- Table 7: Global Calcined Petroleum Coke Industry Revenue Billion Forecast, by Type 2020 & 2033
- Table 8: Global Calcined Petroleum Coke Industry Volume K Tons Forecast, by Type 2020 & 2033
- Table 9: Global Calcined Petroleum Coke Industry Revenue Billion Forecast, by Application 2020 & 2033
- Table 10: Global Calcined Petroleum Coke Industry Volume K Tons Forecast, by Application 2020 & 2033
- Table 11: Global Calcined Petroleum Coke Industry Revenue Billion Forecast, by Country 2020 & 2033
- Table 12: Global Calcined Petroleum Coke Industry Volume K Tons Forecast, by Country 2020 & 2033
- Table 13: China Calcined Petroleum Coke Industry Revenue (Billion) Forecast, by Application 2020 & 2033
- Table 14: China Calcined Petroleum Coke Industry Volume (K Tons) Forecast, by Application 2020 & 2033
- Table 15: India Calcined Petroleum Coke Industry Revenue (Billion) Forecast, by Application 2020 & 2033
- Table 16: India Calcined Petroleum Coke Industry Volume (K Tons) Forecast, by Application 2020 & 2033
- Table 17: Japan Calcined Petroleum Coke Industry Revenue (Billion) Forecast, by Application 2020 & 2033
- Table 18: Japan Calcined Petroleum Coke Industry Volume (K Tons) Forecast, by Application 2020 & 2033
- Table 19: South Korea Calcined Petroleum Coke Industry Revenue (Billion) Forecast, by Application 2020 & 2033
- Table 20: South Korea Calcined Petroleum Coke Industry Volume (K Tons) Forecast, by Application 2020 & 2033
- Table 21: ASEAN Countries Calcined Petroleum Coke Industry Revenue (Billion) Forecast, by Application 2020 & 2033
- Table 22: ASEAN Countries Calcined Petroleum Coke Industry Volume (K Tons) Forecast, by Application 2020 & 2033
- Table 23: Rest of Asia Pacific Calcined Petroleum Coke Industry Revenue (Billion) Forecast, by Application 2020 & 2033
- Table 24: Rest of Asia Pacific Calcined Petroleum Coke Industry Volume (K Tons) Forecast, by Application 2020 & 2033
- Table 25: Global Calcined Petroleum Coke Industry Revenue Billion Forecast, by Type 2020 & 2033
- Table 26: Global Calcined Petroleum Coke Industry Volume K Tons Forecast, by Type 2020 & 2033
- Table 27: Global Calcined Petroleum Coke Industry Revenue Billion Forecast, by Application 2020 & 2033
- Table 28: Global Calcined Petroleum Coke Industry Volume K Tons Forecast, by Application 2020 & 2033
- Table 29: Global Calcined Petroleum Coke Industry Revenue Billion Forecast, by Country 2020 & 2033
- Table 30: Global Calcined Petroleum Coke Industry Volume K Tons Forecast, by Country 2020 & 2033
- Table 31: United States Calcined Petroleum Coke Industry Revenue (Billion) Forecast, by Application 2020 & 2033
- Table 32: United States Calcined Petroleum Coke Industry Volume (K Tons) Forecast, by Application 2020 & 2033
- Table 33: Canada Calcined Petroleum Coke Industry Revenue (Billion) Forecast, by Application 2020 & 2033
- Table 34: Canada Calcined Petroleum Coke Industry Volume (K Tons) Forecast, by Application 2020 & 2033
- Table 35: Mexico Calcined Petroleum Coke Industry Revenue (Billion) Forecast, by Application 2020 & 2033
- Table 36: Mexico Calcined Petroleum Coke Industry Volume (K Tons) Forecast, by Application 2020 & 2033
- Table 37: Global Calcined Petroleum Coke Industry Revenue Billion Forecast, by Type 2020 & 2033
- Table 38: Global Calcined Petroleum Coke Industry Volume K Tons Forecast, by Type 2020 & 2033
- Table 39: Global Calcined Petroleum Coke Industry Revenue Billion Forecast, by Application 2020 & 2033
- Table 40: Global Calcined Petroleum Coke Industry Volume K Tons Forecast, by Application 2020 & 2033
- Table 41: Global Calcined Petroleum Coke Industry Revenue Billion Forecast, by Country 2020 & 2033
- Table 42: Global Calcined Petroleum Coke Industry Volume K Tons Forecast, by Country 2020 & 2033
- Table 43: Germany Calcined Petroleum Coke Industry Revenue (Billion) Forecast, by Application 2020 & 2033
- Table 44: Germany Calcined Petroleum Coke Industry Volume (K Tons) Forecast, by Application 2020 & 2033
- Table 45: United Kingdom Calcined Petroleum Coke Industry Revenue (Billion) Forecast, by Application 2020 & 2033
- Table 46: United Kingdom Calcined Petroleum Coke Industry Volume (K Tons) Forecast, by Application 2020 & 2033
- Table 47: Italy Calcined Petroleum Coke Industry Revenue (Billion) Forecast, by Application 2020 & 2033
- Table 48: Italy Calcined Petroleum Coke Industry Volume (K Tons) Forecast, by Application 2020 & 2033
- Table 49: France Calcined Petroleum Coke Industry Revenue (Billion) Forecast, by Application 2020 & 2033
- Table 50: France Calcined Petroleum Coke Industry Volume (K Tons) Forecast, by Application 2020 & 2033
- Table 51: Spain Calcined Petroleum Coke Industry Revenue (Billion) Forecast, by Application 2020 & 2033
- Table 52: Spain Calcined Petroleum Coke Industry Volume (K Tons) Forecast, by Application 2020 & 2033
- Table 53: Rest of Europe Calcined Petroleum Coke Industry Revenue (Billion) Forecast, by Application 2020 & 2033
- Table 54: Rest of Europe Calcined Petroleum Coke Industry Volume (K Tons) Forecast, by Application 2020 & 2033
- Table 55: Global Calcined Petroleum Coke Industry Revenue Billion Forecast, by Type 2020 & 2033
- Table 56: Global Calcined Petroleum Coke Industry Volume K Tons Forecast, by Type 2020 & 2033
- Table 57: Global Calcined Petroleum Coke Industry Revenue Billion Forecast, by Application 2020 & 2033
- Table 58: Global Calcined Petroleum Coke Industry Volume K Tons Forecast, by Application 2020 & 2033
- Table 59: Global Calcined Petroleum Coke Industry Revenue Billion Forecast, by Country 2020 & 2033
- Table 60: Global Calcined Petroleum Coke Industry Volume K Tons Forecast, by Country 2020 & 2033
- Table 61: Brazil Calcined Petroleum Coke Industry Revenue (Billion) Forecast, by Application 2020 & 2033
- Table 62: Brazil Calcined Petroleum Coke Industry Volume (K Tons) Forecast, by Application 2020 & 2033
- Table 63: Argentina Calcined Petroleum Coke Industry Revenue (Billion) Forecast, by Application 2020 & 2033
- Table 64: Argentina Calcined Petroleum Coke Industry Volume (K Tons) Forecast, by Application 2020 & 2033
- Table 65: Rest of South America Calcined Petroleum Coke Industry Revenue (Billion) Forecast, by Application 2020 & 2033
- Table 66: Rest of South America Calcined Petroleum Coke Industry Volume (K Tons) Forecast, by Application 2020 & 2033
- Table 67: Global Calcined Petroleum Coke Industry Revenue Billion Forecast, by Type 2020 & 2033
- Table 68: Global Calcined Petroleum Coke Industry Volume K Tons Forecast, by Type 2020 & 2033
- Table 69: Global Calcined Petroleum Coke Industry Revenue Billion Forecast, by Application 2020 & 2033
- Table 70: Global Calcined Petroleum Coke Industry Volume K Tons Forecast, by Application 2020 & 2033
- Table 71: Global Calcined Petroleum Coke Industry Revenue Billion Forecast, by Country 2020 & 2033
- Table 72: Global Calcined Petroleum Coke Industry Volume K Tons Forecast, by Country 2020 & 2033
- Table 73: Saudi Arabia Calcined Petroleum Coke Industry Revenue (Billion) Forecast, by Application 2020 & 2033
- Table 74: Saudi Arabia Calcined Petroleum Coke Industry Volume (K Tons) Forecast, by Application 2020 & 2033
- Table 75: South Africa Calcined Petroleum Coke Industry Revenue (Billion) Forecast, by Application 2020 & 2033
- Table 76: South Africa Calcined Petroleum Coke Industry Volume (K Tons) Forecast, by Application 2020 & 2033
- Table 77: Rest of Middle East and Africa Calcined Petroleum Coke Industry Revenue (Billion) Forecast, by Application 2020 & 2033
- Table 78: Rest of Middle East and Africa Calcined Petroleum Coke Industry Volume (K Tons) Forecast, by Application 2020 & 2033
Frequently Asked Questions
1. What is the projected Compound Annual Growth Rate (CAGR) of the Calcined Petroleum Coke Industry?
The projected CAGR is approximately 5.45%.
2. Which companies are prominent players in the Calcined Petroleum Coke Industry?
Key companies in the market include Oxbow Corporation, Petrocoque, Zhenjiang Coking And Gas Group Co Ltd, CNOOC Limited, Rain Carbon Inc, Aluminium Bahrain B S C (Alba), Rio Tinto, Numaligarh Refinery Limited, Phillips 66 Company, Maniayargroup, Saudi Calcined Petroleum Coke Company (SCPC), BP PLC, ELSID SA.
3. What are the main segments of the Calcined Petroleum Coke Industry?
The market segments include Type, Application.
4. Can you provide details about the market size?
The market size is estimated to be USD 1.15 Billion as of 2022.
5. What are some drivers contributing to market growth?
Increasing Demand from Aluminum Applications; Other Drivers.
6. What are the notable trends driving market growth?
Aluminium Segment to Drive the Market Growth.
7. Are there any restraints impacting market growth?
Fluctuating Prices for Raw Materials; Other Restraints.
8. Can you provide examples of recent developments in the market?
January 2023: Phillips 66 and DCP Midstream, LP announced a definitive agreement under which Phillips 66 will acquire all publicly traded standard units representing limited partner interests in DCP Midstream for cash consideration of USD 41.75 per standard unit, increasing its economic interest in DCP Midstream to 86.8%. It will strengthen the corporation and, in specific ways, boost the market productivity of petroleum coke.
9. What pricing options are available for accessing the report?
Pricing options include single-user, multi-user, and enterprise licenses priced at USD 4750, USD 5250, and USD 8750 respectively.
10. Is the market size provided in terms of value or volume?
The market size is provided in terms of value, measured in Billion and volume, measured in K Tons.
11. Are there any specific market keywords associated with the report?
Yes, the market keyword associated with the report is "Calcined Petroleum Coke Industry," which aids in identifying and referencing the specific market segment covered.
12. How do I determine which pricing option suits my needs best?
The pricing options vary based on user requirements and access needs. Individual users may opt for single-user licenses, while businesses requiring broader access may choose multi-user or enterprise licenses for cost-effective access to the report.
13. Are there any additional resources or data provided in the Calcined Petroleum Coke Industry report?
While the report offers comprehensive insights, it's advisable to review the specific contents or supplementary materials provided to ascertain if additional resources or data are available.
14. How can I stay updated on further developments or reports in the Calcined Petroleum Coke Industry?
To stay informed about further developments, trends, and reports in the Calcined Petroleum Coke Industry, consider subscribing to industry newsletters, following relevant companies and organizations, or regularly checking reputable industry news sources and publications.
Methodology
Step 1 - Identification of Relevant Samples Size from Population Database


Step 2 - Approaches for Defining Global Market Size (Value, Volume* & Price*)

Note*: In applicable scenarios
Step 3 - Data Sources
Primary Research
- Web Analytics
- Survey Reports
- Research Institute
- Latest Research Reports
- Opinion Leaders
Secondary Research
- Annual Reports
- White Paper
- Latest Press Release
- Industry Association
- Paid Database
- Investor Presentations

Step 4 - Data Triangulation
Involves using different sources of information in order to increase the validity of a study
These sources are likely to be stakeholders in a program - participants, other researchers, program staff, other community members, and so on.
Then we put all data in single framework & apply various statistical tools to find out the dynamic on the market.
During the analysis stage, feedback from the stakeholder groups would be compared to determine areas of agreement as well as areas of divergence