
Key Insights
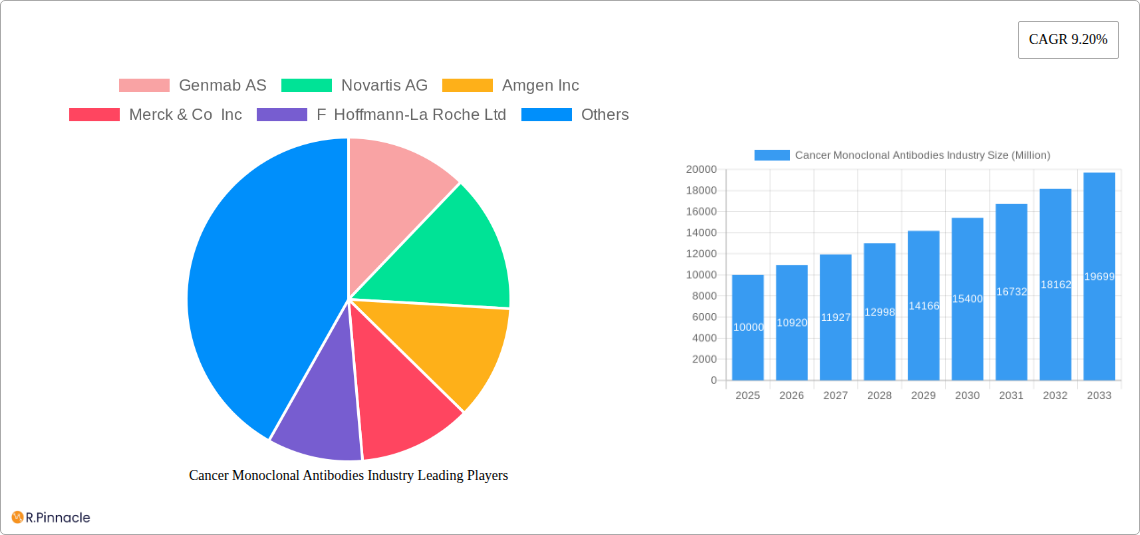
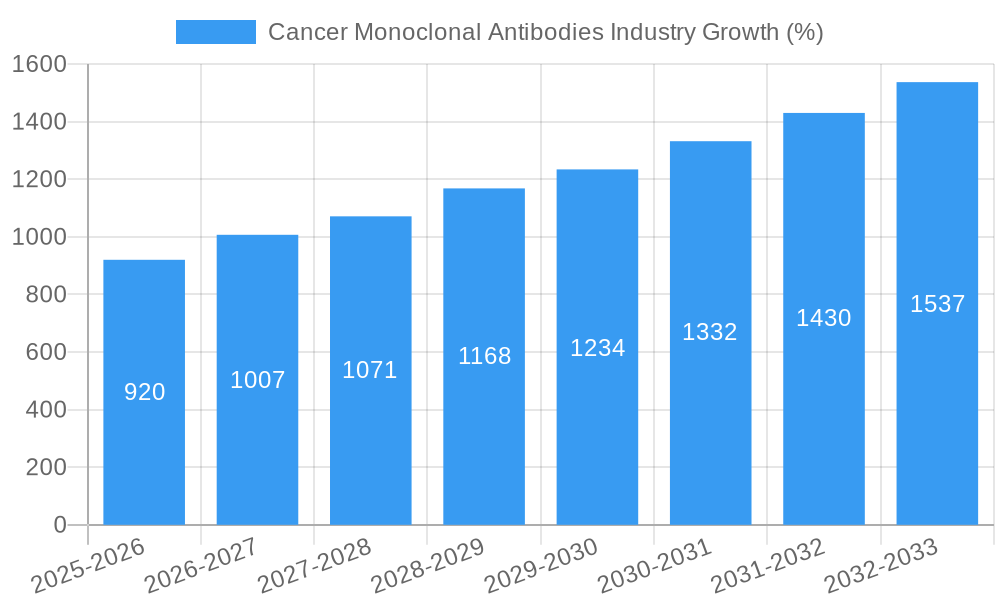
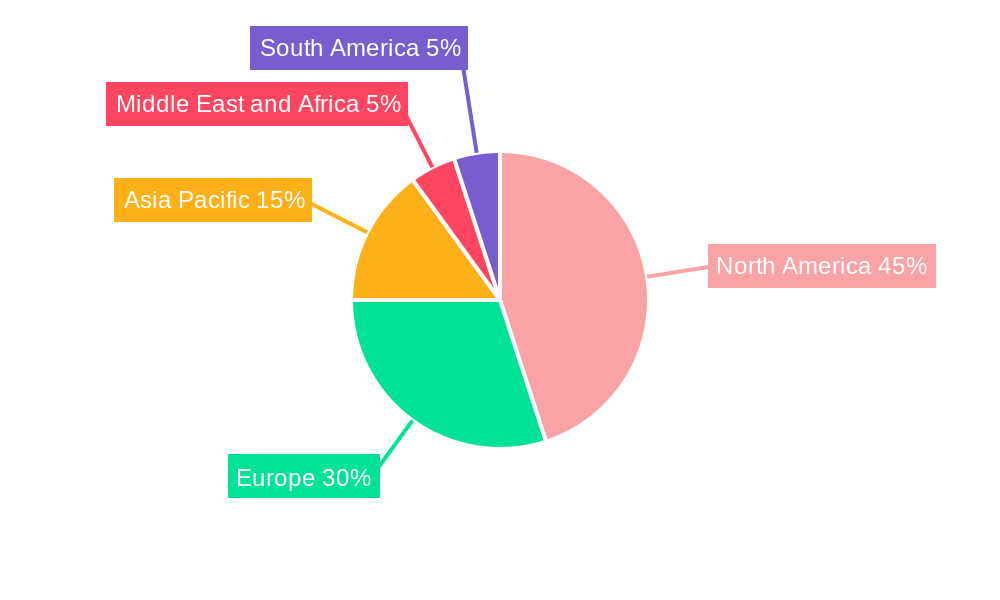
The global cancer monoclonal antibodies market is experiencing robust growth, projected to reach a substantial value by 2033, driven by a 9.20% CAGR from 2025. This expansion is fueled by several key factors. Firstly, the rising incidence of various cancers, particularly breast, blood, liver, brain, and colorectal cancers, creates significant demand for effective therapies. Monoclonal antibodies offer targeted treatment options, minimizing side effects compared to traditional chemotherapy. Advancements in antibody engineering, leading to the development of more effective and safer humanized and chimeric antibodies, further contribute to market growth. The success of established therapies like Bevacizumab, Rituximab, Trastuzumab, Cetuximab, and Panitumumab has solidified the market's position and encouraged further research and development. The significant investment in research and development by major pharmaceutical companies like Genmab AS, Novartis AG, Amgen Inc., and others ensures a steady pipeline of innovative therapies entering the market. Regional variations in market share exist, with North America and Europe currently dominating due to higher healthcare expenditure and advanced healthcare infrastructure; however, the Asia-Pacific region is poised for significant growth in the coming years due to increasing awareness, improved healthcare access, and a growing population.
The competitive landscape is highly concentrated, with a few large multinational pharmaceutical companies dominating the market. However, the entry of smaller biotech firms with innovative therapies presents opportunities for disruption and diversification. Challenges remain, including high treatment costs, potential side effects of monoclonal antibodies, and the development of drug resistance. Nevertheless, ongoing research focused on personalized medicine and targeted therapies is expected to overcome these obstacles and maintain the positive trajectory of the cancer monoclonal antibodies market. The increasing prevalence of cancer globally, coupled with the proven efficacy and advantages of monoclonal antibody therapies, will continue to propel market growth throughout the forecast period.
Cancer Monoclonal Antibodies Industry Report: 2019-2033
This comprehensive report provides a detailed analysis of the Cancer Monoclonal Antibodies industry, offering invaluable insights for industry professionals, investors, and researchers. With a study period spanning 2019-2033, a base year of 2025, and a forecast period of 2025-2033, this report offers a complete overview of the market's historical performance, current state, and future trajectory. The global market size is projected to reach xx Million by 2033, exhibiting a CAGR of xx% during the forecast period.
Cancer Monoclonal Antibodies Industry Market Structure & Innovation Trends
This section analyzes the competitive landscape, innovation drivers, and regulatory influences shaping the Cancer Monoclonal Antibodies market. The market exhibits a moderately concentrated structure, with key players holding significant market share. For instance, Genmab AS, Novartis AG, Amgen Inc., and Merck & Co Inc. collectively account for approximately xx% of the global market in 2025. Innovation is driven by ongoing R&D efforts focused on developing novel antibody formats (e.g., bispecific antibodies, antibody-drug conjugates), improving drug delivery systems, and expanding therapeutic applications. The regulatory landscape, including FDA approvals and global regulatory harmonization initiatives, plays a significant role in shaping market dynamics. Mergers and acquisitions (M&A) are frequent, with deal values exceeding xx Million in recent years, demonstrating the industry's consolidation trend. Examples include (but aren't limited to) the acquisition of X company by Y company for xx Million in 2022. The report also explores the impact of product substitutes, evolving end-user demographics (aging population, increased cancer incidence), and technological advancements.
Cancer Monoclonal Antibodies Industry Market Dynamics & Trends
Market growth is primarily driven by increasing cancer prevalence, rising healthcare expenditure, and growing demand for effective cancer therapies. Technological advancements, such as the development of next-generation sequencing and personalized medicine, are significantly influencing market trends. Consumer preferences for targeted therapies with fewer side effects contribute to market growth. Competitive dynamics are shaped by intense R&D efforts, strategic partnerships, and increasing competition among established players and emerging biotech companies. The report examines these dynamics in detail, providing a comprehensive understanding of factors driving market growth and influencing strategic decision-making. Market penetration of monoclonal antibody therapies varies significantly across different cancer types and geographies.
Dominant Regions & Segments in Cancer Monoclonal Antibodies Industry
The North American market currently dominates the global Cancer Monoclonal Antibodies industry due to higher healthcare expenditure, advanced healthcare infrastructure, and a large patient population. However, the Asia-Pacific region is projected to exhibit the fastest growth rate during the forecast period, driven by rising healthcare awareness, increasing disposable incomes, and expanding healthcare infrastructure.
Leading Application Segments:
- Breast Cancer: High market share driven by several FDA-approved therapies.
- Blood Cancer: Significant growth due to increasing prevalence and successful treatment outcomes.
- Other Application segments like Liver, Brain, and Colorectal Cancer also show significant growth potential.
Dominant Monoclonal Antibody Types:
- Humanized Antibodies: Largest segment due to improved efficacy and reduced immunogenicity.
- Chimeric Antibodies: Significant market share due to a balance between efficacy and safety.
- Murine Antibodies, while less prevalent, maintain a niche in specific applications.
Key Monoclonal Antibody Therapies:
- Bevacizumab (Avastin): Strong market presence due to widespread use in various cancer types.
- Rituximab (Rituxan): Remains a key treatment option for blood cancers.
- Trastuzumab (Herceptin): Dominant therapy for HER2-positive breast cancer.
- Other therapies like Cetuximab (Erbitux) and Panitumumab (Vectibix) contribute significantly to market revenue.
Cancer Monoclonal Antibodies Industry Product Innovations
The Cancer Monoclonal Antibodies industry is characterized by continuous product innovation. Recent advancements focus on developing novel antibody formats, including bispecific antibodies and antibody-drug conjugates, designed to improve therapeutic efficacy and reduce side effects. These innovations cater to unmet medical needs and address limitations of existing therapies. Furthermore, technological advancements in drug delivery systems are enhancing the effectiveness and convenience of treatment. This focus on innovation is driving market expansion and shaping competitive dynamics.
Report Scope & Segmentation Analysis
This report provides a comprehensive analysis of the Cancer Monoclonal Antibodies market, segmented by application (Breast Cancer, Blood Cancer, Liver Cancer, Brain Cancer, Colorectal Cancer, Other Applications), type of monoclonal antibody (Murine Antibodies, Chimeric Antibodies, Humanized Antibodies), and monoclonal antibody therapies (Bevacizumab (Avastin), Rituximab (Rituxan), Trastuzumab (Herceptin), Cetuximab (Erbitux), Panitumumab (Vectibix), Other Monoclonal Antibody Therapies). Each segment's growth projections, market size, and competitive dynamics are analyzed in detail. The report forecasts significant growth across all segments, driven by factors discussed earlier.
Key Drivers of Cancer Monoclonal Antibodies Industry Growth
The Cancer Monoclonal Antibodies market's growth is fueled by several key drivers. The rising prevalence of various cancer types globally is a primary factor. Increased healthcare expenditure and improved access to advanced therapies, particularly in developing economies, contribute significantly. Furthermore, technological advancements leading to the development of more effective and targeted therapies fuel market expansion. Favorable regulatory frameworks supporting the approval and commercialization of innovative therapies also contribute.
Challenges in the Cancer Monoclonal Antibodies Industry Sector
The industry faces challenges such as stringent regulatory approval processes, which can delay product launches and increase development costs. High manufacturing costs, complex supply chains, and potential side effects associated with certain therapies are further challenges. Intense competition among established pharmaceutical companies and emerging biotech firms also impacts profitability. These factors influence market dynamics and shape strategic decision-making.
Emerging Opportunities in Cancer Monoclonal Antibodies Industry
Significant opportunities exist in developing novel antibody formats with enhanced efficacy and reduced side effects. Expanding into emerging markets with high cancer prevalence and growing healthcare infrastructure presents substantial growth potential. Personalized medicine and targeted therapies are rapidly gaining traction, creating lucrative opportunities. Advancements in drug delivery systems and combination therapies further enhance market prospects.
Leading Players in the Cancer Monoclonal Antibodies Industry Market
- Genmab AS
- Novartis AG
- Amgen Inc
- Merck & Co Inc
- F Hoffmann-La Roche Ltd
- Spectrum Pharmaceuticals Inc
- Eli Lilly and Company
- Bristol Myers Squibb Company
- Johnson & Johnson
- GlaxoSmithKline PLC
Key Developments in Cancer Monoclonal Antibodies Industry Industry
- February 2022: Janssen Pharmaceutical Companies of Johnson & Johnson received FDA approval for CARVYKTI (ciltacabtagene autoleucel; cilta-cel) for treating relapsed or refractory multiple myeloma.
- January 2022: Akeso received approval from China's National Medical Products Administration to commence a Phase II clinical trial of ligufalimab (AK117) and ivonescimab (AK112) for first-line breast cancer.
Future Outlook for Cancer Monoclonal Antibodies Industry Market
The future outlook for the Cancer Monoclonal Antibodies industry remains positive, driven by continued innovation, increasing cancer prevalence, and growing demand for effective therapies. The market is poised for significant growth, with substantial opportunities for companies developing novel therapies and improving existing treatments. Strategic partnerships, mergers and acquisitions, and expansion into new markets will shape industry dynamics in the coming years. The focus on personalized medicine and targeted therapies will further fuel market growth.
Cancer Monoclonal Antibodies Industry Segmentation
-
1. Types of Monoclonal Antibody
- 1.1. Murine Antibodies
- 1.2. Chimeric Antibodies
- 1.3. Humanized Antibodies
-
2. Monoclonal Antibody Therapies
- 2.1. Bevacizumab (Avastin)
- 2.2. Rituximab (Rituxan)
- 2.3. Trastuzumab (Herceptin)
- 2.4. Cetuximab (Erbitux)
- 2.5. Panitumumab (Vectibix)
- 2.6. Other Monoclonal Antibody Therapies
-
3. Application
- 3.1. Breast Cancer
- 3.2. Blood Cancer
- 3.3. Liver Cancer
- 3.4. Brain Cancer
- 3.5. Colorectal Cancer
- 3.6. Other Applications
Cancer Monoclonal Antibodies Industry Segmentation By Geography
-
1. North America
- 1.1. United States
- 1.2. Canada
- 1.3. Mexico
-
2. Europe
- 2.1. Germany
- 2.2. United Kingdom
- 2.3. France
- 2.4. Italy
- 2.5. Spain
- 2.6. Rest of Europe
-
3. Asia Pacific
- 3.1. China
- 3.2. Japan
- 3.3. India
- 3.4. Australia
- 3.5. South korea
- 3.6. Rest of Asia Pacific
-
4. Middle East and Africa
- 4.1. GCC
- 4.2. South Africa
- 4.3. Rest of Middle East and Africa
-
5. South America
- 5.1. Brazil
- 5.2. Argentina
- 5.3. Rest of South America
Cancer Monoclonal Antibodies Industry REPORT HIGHLIGHTS
| Aspects | Details |
|---|---|
| Study Period | 2019-2033 |
| Base Year | 2024 |
| Estimated Year | 2025 |
| Forecast Period | 2025-2033 |
| Historical Period | 2019-2024 |
| Growth Rate | CAGR of 9.20% from 2019-2033 |
| Segmentation |
|
Table of Contents
- 1. Introduction
- 1.1. Research Scope
- 1.2. Market Segmentation
- 1.3. Research Methodology
- 1.4. Definitions and Assumptions
- 2. Executive Summary
- 2.1. Introduction
- 3. Market Dynamics
- 3.1. Introduction
- 3.2. Market Drivers
- 3.2.1. Growing Prevalence of Cancer; Increasing Investment in Research and Development of Genomic Studies; Rising Advancements and Preference toward Specificity of Monoclonal Antibodies to Target Cancer
- 3.3. Market Restrains
- 3.3.1. Stringent Regulatory Guidelines; Long Duration of Research and Development with Rising Failures in Clinical Trials
- 3.4. Market Trends
- 3.4.1. Trastuzumab (Herceptin) is Expected to Hold Significant Market Share in Monoclonal Antibody Therapies
- 4. Market Factor Analysis
- 4.1. Porters Five Forces
- 4.2. Supply/Value Chain
- 4.3. PESTEL analysis
- 4.4. Market Entropy
- 4.5. Patent/Trademark Analysis
- 5. Cancer Monoclonal Antibodies Industry Analysis, Insights and Forecast, 2019-2031
- 5.1. Market Analysis, Insights and Forecast - by Types of Monoclonal Antibody
- 5.1.1. Murine Antibodies
- 5.1.2. Chimeric Antibodies
- 5.1.3. Humanized Antibodies
- 5.2. Market Analysis, Insights and Forecast - by Monoclonal Antibody Therapies
- 5.2.1. Bevacizumab (Avastin)
- 5.2.2. Rituximab (Rituxan)
- 5.2.3. Trastuzumab (Herceptin)
- 5.2.4. Cetuximab (Erbitux)
- 5.2.5. Panitumumab (Vectibix)
- 5.2.6. Other Monoclonal Antibody Therapies
- 5.3. Market Analysis, Insights and Forecast - by Application
- 5.3.1. Breast Cancer
- 5.3.2. Blood Cancer
- 5.3.3. Liver Cancer
- 5.3.4. Brain Cancer
- 5.3.5. Colorectal Cancer
- 5.3.6. Other Applications
- 5.4. Market Analysis, Insights and Forecast - by Region
- 5.4.1. North America
- 5.4.2. Europe
- 5.4.3. Asia Pacific
- 5.4.4. Middle East and Africa
- 5.4.5. South America
- 5.1. Market Analysis, Insights and Forecast - by Types of Monoclonal Antibody
- 6. North America Cancer Monoclonal Antibodies Industry Analysis, Insights and Forecast, 2019-2031
- 6.1. Market Analysis, Insights and Forecast - by Types of Monoclonal Antibody
- 6.1.1. Murine Antibodies
- 6.1.2. Chimeric Antibodies
- 6.1.3. Humanized Antibodies
- 6.2. Market Analysis, Insights and Forecast - by Monoclonal Antibody Therapies
- 6.2.1. Bevacizumab (Avastin)
- 6.2.2. Rituximab (Rituxan)
- 6.2.3. Trastuzumab (Herceptin)
- 6.2.4. Cetuximab (Erbitux)
- 6.2.5. Panitumumab (Vectibix)
- 6.2.6. Other Monoclonal Antibody Therapies
- 6.3. Market Analysis, Insights and Forecast - by Application
- 6.3.1. Breast Cancer
- 6.3.2. Blood Cancer
- 6.3.3. Liver Cancer
- 6.3.4. Brain Cancer
- 6.3.5. Colorectal Cancer
- 6.3.6. Other Applications
- 6.1. Market Analysis, Insights and Forecast - by Types of Monoclonal Antibody
- 7. Europe Cancer Monoclonal Antibodies Industry Analysis, Insights and Forecast, 2019-2031
- 7.1. Market Analysis, Insights and Forecast - by Types of Monoclonal Antibody
- 7.1.1. Murine Antibodies
- 7.1.2. Chimeric Antibodies
- 7.1.3. Humanized Antibodies
- 7.2. Market Analysis, Insights and Forecast - by Monoclonal Antibody Therapies
- 7.2.1. Bevacizumab (Avastin)
- 7.2.2. Rituximab (Rituxan)
- 7.2.3. Trastuzumab (Herceptin)
- 7.2.4. Cetuximab (Erbitux)
- 7.2.5. Panitumumab (Vectibix)
- 7.2.6. Other Monoclonal Antibody Therapies
- 7.3. Market Analysis, Insights and Forecast - by Application
- 7.3.1. Breast Cancer
- 7.3.2. Blood Cancer
- 7.3.3. Liver Cancer
- 7.3.4. Brain Cancer
- 7.3.5. Colorectal Cancer
- 7.3.6. Other Applications
- 7.1. Market Analysis, Insights and Forecast - by Types of Monoclonal Antibody
- 8. Asia Pacific Cancer Monoclonal Antibodies Industry Analysis, Insights and Forecast, 2019-2031
- 8.1. Market Analysis, Insights and Forecast - by Types of Monoclonal Antibody
- 8.1.1. Murine Antibodies
- 8.1.2. Chimeric Antibodies
- 8.1.3. Humanized Antibodies
- 8.2. Market Analysis, Insights and Forecast - by Monoclonal Antibody Therapies
- 8.2.1. Bevacizumab (Avastin)
- 8.2.2. Rituximab (Rituxan)
- 8.2.3. Trastuzumab (Herceptin)
- 8.2.4. Cetuximab (Erbitux)
- 8.2.5. Panitumumab (Vectibix)
- 8.2.6. Other Monoclonal Antibody Therapies
- 8.3. Market Analysis, Insights and Forecast - by Application
- 8.3.1. Breast Cancer
- 8.3.2. Blood Cancer
- 8.3.3. Liver Cancer
- 8.3.4. Brain Cancer
- 8.3.5. Colorectal Cancer
- 8.3.6. Other Applications
- 8.1. Market Analysis, Insights and Forecast - by Types of Monoclonal Antibody
- 9. Middle East and Africa Cancer Monoclonal Antibodies Industry Analysis, Insights and Forecast, 2019-2031
- 9.1. Market Analysis, Insights and Forecast - by Types of Monoclonal Antibody
- 9.1.1. Murine Antibodies
- 9.1.2. Chimeric Antibodies
- 9.1.3. Humanized Antibodies
- 9.2. Market Analysis, Insights and Forecast - by Monoclonal Antibody Therapies
- 9.2.1. Bevacizumab (Avastin)
- 9.2.2. Rituximab (Rituxan)
- 9.2.3. Trastuzumab (Herceptin)
- 9.2.4. Cetuximab (Erbitux)
- 9.2.5. Panitumumab (Vectibix)
- 9.2.6. Other Monoclonal Antibody Therapies
- 9.3. Market Analysis, Insights and Forecast - by Application
- 9.3.1. Breast Cancer
- 9.3.2. Blood Cancer
- 9.3.3. Liver Cancer
- 9.3.4. Brain Cancer
- 9.3.5. Colorectal Cancer
- 9.3.6. Other Applications
- 9.1. Market Analysis, Insights and Forecast - by Types of Monoclonal Antibody
- 10. South America Cancer Monoclonal Antibodies Industry Analysis, Insights and Forecast, 2019-2031
- 10.1. Market Analysis, Insights and Forecast - by Types of Monoclonal Antibody
- 10.1.1. Murine Antibodies
- 10.1.2. Chimeric Antibodies
- 10.1.3. Humanized Antibodies
- 10.2. Market Analysis, Insights and Forecast - by Monoclonal Antibody Therapies
- 10.2.1. Bevacizumab (Avastin)
- 10.2.2. Rituximab (Rituxan)
- 10.2.3. Trastuzumab (Herceptin)
- 10.2.4. Cetuximab (Erbitux)
- 10.2.5. Panitumumab (Vectibix)
- 10.2.6. Other Monoclonal Antibody Therapies
- 10.3. Market Analysis, Insights and Forecast - by Application
- 10.3.1. Breast Cancer
- 10.3.2. Blood Cancer
- 10.3.3. Liver Cancer
- 10.3.4. Brain Cancer
- 10.3.5. Colorectal Cancer
- 10.3.6. Other Applications
- 10.1. Market Analysis, Insights and Forecast - by Types of Monoclonal Antibody
- 11. North America Cancer Monoclonal Antibodies Industry Analysis, Insights and Forecast, 2019-2031
- 11.1. Market Analysis, Insights and Forecast - By Country/Sub-region
- 11.1.1 United States
- 11.1.2 Canada
- 11.1.3 Mexico
- 12. Europe Cancer Monoclonal Antibodies Industry Analysis, Insights and Forecast, 2019-2031
- 12.1. Market Analysis, Insights and Forecast - By Country/Sub-region
- 12.1.1 Germany
- 12.1.2 United Kingdom
- 12.1.3 France
- 12.1.4 Italy
- 12.1.5 Spain
- 12.1.6 Rest of Europe
- 13. Asia Pacific Cancer Monoclonal Antibodies Industry Analysis, Insights and Forecast, 2019-2031
- 13.1. Market Analysis, Insights and Forecast - By Country/Sub-region
- 13.1.1 China
- 13.1.2 Japan
- 13.1.3 India
- 13.1.4 Australia
- 13.1.5 South korea
- 13.1.6 Rest of Asia Pacific
- 14. Middle East and Africa Cancer Monoclonal Antibodies Industry Analysis, Insights and Forecast, 2019-2031
- 14.1. Market Analysis, Insights and Forecast - By Country/Sub-region
- 14.1.1 GCC
- 14.1.2 South Africa
- 14.1.3 Rest of Middle East and Africa
- 15. South America Cancer Monoclonal Antibodies Industry Analysis, Insights and Forecast, 2019-2031
- 15.1. Market Analysis, Insights and Forecast - By Country/Sub-region
- 15.1.1 Brazil
- 15.1.2 Argentina
- 15.1.3 Rest of South America
- 16. Competitive Analysis
- 16.1. Market Share Analysis 2024
- 16.2. Company Profiles
- 16.2.1 Genmab AS
- 16.2.1.1. Overview
- 16.2.1.2. Products
- 16.2.1.3. SWOT Analysis
- 16.2.1.4. Recent Developments
- 16.2.1.5. Financials (Based on Availability)
- 16.2.2 Novartis AG
- 16.2.2.1. Overview
- 16.2.2.2. Products
- 16.2.2.3. SWOT Analysis
- 16.2.2.4. Recent Developments
- 16.2.2.5. Financials (Based on Availability)
- 16.2.3 Amgen Inc
- 16.2.3.1. Overview
- 16.2.3.2. Products
- 16.2.3.3. SWOT Analysis
- 16.2.3.4. Recent Developments
- 16.2.3.5. Financials (Based on Availability)
- 16.2.4 Merck & Co Inc
- 16.2.4.1. Overview
- 16.2.4.2. Products
- 16.2.4.3. SWOT Analysis
- 16.2.4.4. Recent Developments
- 16.2.4.5. Financials (Based on Availability)
- 16.2.5 F Hoffmann-La Roche Ltd
- 16.2.5.1. Overview
- 16.2.5.2. Products
- 16.2.5.3. SWOT Analysis
- 16.2.5.4. Recent Developments
- 16.2.5.5. Financials (Based on Availability)
- 16.2.6 Spectrum Pharmaceuticals Inc
- 16.2.6.1. Overview
- 16.2.6.2. Products
- 16.2.6.3. SWOT Analysis
- 16.2.6.4. Recent Developments
- 16.2.6.5. Financials (Based on Availability)
- 16.2.7 Eli Lilly and Company
- 16.2.7.1. Overview
- 16.2.7.2. Products
- 16.2.7.3. SWOT Analysis
- 16.2.7.4. Recent Developments
- 16.2.7.5. Financials (Based on Availability)
- 16.2.8 Bristol Myers Squibb Company
- 16.2.8.1. Overview
- 16.2.8.2. Products
- 16.2.8.3. SWOT Analysis
- 16.2.8.4. Recent Developments
- 16.2.8.5. Financials (Based on Availability)
- 16.2.9 Johnson & Johnson
- 16.2.9.1. Overview
- 16.2.9.2. Products
- 16.2.9.3. SWOT Analysis
- 16.2.9.4. Recent Developments
- 16.2.9.5. Financials (Based on Availability)
- 16.2.10 GlaxoSmithKline PLC
- 16.2.10.1. Overview
- 16.2.10.2. Products
- 16.2.10.3. SWOT Analysis
- 16.2.10.4. Recent Developments
- 16.2.10.5. Financials (Based on Availability)
- 16.2.1 Genmab AS
List of Figures
- Figure 1: Cancer Monoclonal Antibodies Industry Revenue Breakdown (Million, %) by Product 2024 & 2032
- Figure 2: Cancer Monoclonal Antibodies Industry Share (%) by Company 2024
List of Tables
- Table 1: Cancer Monoclonal Antibodies Industry Revenue Million Forecast, by Region 2019 & 2032
- Table 2: Cancer Monoclonal Antibodies Industry Volume K Unit Forecast, by Region 2019 & 2032
- Table 3: Cancer Monoclonal Antibodies Industry Revenue Million Forecast, by Types of Monoclonal Antibody 2019 & 2032
- Table 4: Cancer Monoclonal Antibodies Industry Volume K Unit Forecast, by Types of Monoclonal Antibody 2019 & 2032
- Table 5: Cancer Monoclonal Antibodies Industry Revenue Million Forecast, by Monoclonal Antibody Therapies 2019 & 2032
- Table 6: Cancer Monoclonal Antibodies Industry Volume K Unit Forecast, by Monoclonal Antibody Therapies 2019 & 2032
- Table 7: Cancer Monoclonal Antibodies Industry Revenue Million Forecast, by Application 2019 & 2032
- Table 8: Cancer Monoclonal Antibodies Industry Volume K Unit Forecast, by Application 2019 & 2032
- Table 9: Cancer Monoclonal Antibodies Industry Revenue Million Forecast, by Region 2019 & 2032
- Table 10: Cancer Monoclonal Antibodies Industry Volume K Unit Forecast, by Region 2019 & 2032
- Table 11: Cancer Monoclonal Antibodies Industry Revenue Million Forecast, by Country 2019 & 2032
- Table 12: Cancer Monoclonal Antibodies Industry Volume K Unit Forecast, by Country 2019 & 2032
- Table 13: United States Cancer Monoclonal Antibodies Industry Revenue (Million) Forecast, by Application 2019 & 2032
- Table 14: United States Cancer Monoclonal Antibodies Industry Volume (K Unit) Forecast, by Application 2019 & 2032
- Table 15: Canada Cancer Monoclonal Antibodies Industry Revenue (Million) Forecast, by Application 2019 & 2032
- Table 16: Canada Cancer Monoclonal Antibodies Industry Volume (K Unit) Forecast, by Application 2019 & 2032
- Table 17: Mexico Cancer Monoclonal Antibodies Industry Revenue (Million) Forecast, by Application 2019 & 2032
- Table 18: Mexico Cancer Monoclonal Antibodies Industry Volume (K Unit) Forecast, by Application 2019 & 2032
- Table 19: Cancer Monoclonal Antibodies Industry Revenue Million Forecast, by Country 2019 & 2032
- Table 20: Cancer Monoclonal Antibodies Industry Volume K Unit Forecast, by Country 2019 & 2032
- Table 21: Germany Cancer Monoclonal Antibodies Industry Revenue (Million) Forecast, by Application 2019 & 2032
- Table 22: Germany Cancer Monoclonal Antibodies Industry Volume (K Unit) Forecast, by Application 2019 & 2032
- Table 23: United Kingdom Cancer Monoclonal Antibodies Industry Revenue (Million) Forecast, by Application 2019 & 2032
- Table 24: United Kingdom Cancer Monoclonal Antibodies Industry Volume (K Unit) Forecast, by Application 2019 & 2032
- Table 25: France Cancer Monoclonal Antibodies Industry Revenue (Million) Forecast, by Application 2019 & 2032
- Table 26: France Cancer Monoclonal Antibodies Industry Volume (K Unit) Forecast, by Application 2019 & 2032
- Table 27: Italy Cancer Monoclonal Antibodies Industry Revenue (Million) Forecast, by Application 2019 & 2032
- Table 28: Italy Cancer Monoclonal Antibodies Industry Volume (K Unit) Forecast, by Application 2019 & 2032
- Table 29: Spain Cancer Monoclonal Antibodies Industry Revenue (Million) Forecast, by Application 2019 & 2032
- Table 30: Spain Cancer Monoclonal Antibodies Industry Volume (K Unit) Forecast, by Application 2019 & 2032
- Table 31: Rest of Europe Cancer Monoclonal Antibodies Industry Revenue (Million) Forecast, by Application 2019 & 2032
- Table 32: Rest of Europe Cancer Monoclonal Antibodies Industry Volume (K Unit) Forecast, by Application 2019 & 2032
- Table 33: Cancer Monoclonal Antibodies Industry Revenue Million Forecast, by Country 2019 & 2032
- Table 34: Cancer Monoclonal Antibodies Industry Volume K Unit Forecast, by Country 2019 & 2032
- Table 35: China Cancer Monoclonal Antibodies Industry Revenue (Million) Forecast, by Application 2019 & 2032
- Table 36: China Cancer Monoclonal Antibodies Industry Volume (K Unit) Forecast, by Application 2019 & 2032
- Table 37: Japan Cancer Monoclonal Antibodies Industry Revenue (Million) Forecast, by Application 2019 & 2032
- Table 38: Japan Cancer Monoclonal Antibodies Industry Volume (K Unit) Forecast, by Application 2019 & 2032
- Table 39: India Cancer Monoclonal Antibodies Industry Revenue (Million) Forecast, by Application 2019 & 2032
- Table 40: India Cancer Monoclonal Antibodies Industry Volume (K Unit) Forecast, by Application 2019 & 2032
- Table 41: Australia Cancer Monoclonal Antibodies Industry Revenue (Million) Forecast, by Application 2019 & 2032
- Table 42: Australia Cancer Monoclonal Antibodies Industry Volume (K Unit) Forecast, by Application 2019 & 2032
- Table 43: South korea Cancer Monoclonal Antibodies Industry Revenue (Million) Forecast, by Application 2019 & 2032
- Table 44: South korea Cancer Monoclonal Antibodies Industry Volume (K Unit) Forecast, by Application 2019 & 2032
- Table 45: Rest of Asia Pacific Cancer Monoclonal Antibodies Industry Revenue (Million) Forecast, by Application 2019 & 2032
- Table 46: Rest of Asia Pacific Cancer Monoclonal Antibodies Industry Volume (K Unit) Forecast, by Application 2019 & 2032
- Table 47: Cancer Monoclonal Antibodies Industry Revenue Million Forecast, by Country 2019 & 2032
- Table 48: Cancer Monoclonal Antibodies Industry Volume K Unit Forecast, by Country 2019 & 2032
- Table 49: GCC Cancer Monoclonal Antibodies Industry Revenue (Million) Forecast, by Application 2019 & 2032
- Table 50: GCC Cancer Monoclonal Antibodies Industry Volume (K Unit) Forecast, by Application 2019 & 2032
- Table 51: South Africa Cancer Monoclonal Antibodies Industry Revenue (Million) Forecast, by Application 2019 & 2032
- Table 52: South Africa Cancer Monoclonal Antibodies Industry Volume (K Unit) Forecast, by Application 2019 & 2032
- Table 53: Rest of Middle East and Africa Cancer Monoclonal Antibodies Industry Revenue (Million) Forecast, by Application 2019 & 2032
- Table 54: Rest of Middle East and Africa Cancer Monoclonal Antibodies Industry Volume (K Unit) Forecast, by Application 2019 & 2032
- Table 55: Cancer Monoclonal Antibodies Industry Revenue Million Forecast, by Country 2019 & 2032
- Table 56: Cancer Monoclonal Antibodies Industry Volume K Unit Forecast, by Country 2019 & 2032
- Table 57: Brazil Cancer Monoclonal Antibodies Industry Revenue (Million) Forecast, by Application 2019 & 2032
- Table 58: Brazil Cancer Monoclonal Antibodies Industry Volume (K Unit) Forecast, by Application 2019 & 2032
- Table 59: Argentina Cancer Monoclonal Antibodies Industry Revenue (Million) Forecast, by Application 2019 & 2032
- Table 60: Argentina Cancer Monoclonal Antibodies Industry Volume (K Unit) Forecast, by Application 2019 & 2032
- Table 61: Rest of South America Cancer Monoclonal Antibodies Industry Revenue (Million) Forecast, by Application 2019 & 2032
- Table 62: Rest of South America Cancer Monoclonal Antibodies Industry Volume (K Unit) Forecast, by Application 2019 & 2032
- Table 63: Cancer Monoclonal Antibodies Industry Revenue Million Forecast, by Types of Monoclonal Antibody 2019 & 2032
- Table 64: Cancer Monoclonal Antibodies Industry Volume K Unit Forecast, by Types of Monoclonal Antibody 2019 & 2032
- Table 65: Cancer Monoclonal Antibodies Industry Revenue Million Forecast, by Monoclonal Antibody Therapies 2019 & 2032
- Table 66: Cancer Monoclonal Antibodies Industry Volume K Unit Forecast, by Monoclonal Antibody Therapies 2019 & 2032
- Table 67: Cancer Monoclonal Antibodies Industry Revenue Million Forecast, by Application 2019 & 2032
- Table 68: Cancer Monoclonal Antibodies Industry Volume K Unit Forecast, by Application 2019 & 2032
- Table 69: Cancer Monoclonal Antibodies Industry Revenue Million Forecast, by Country 2019 & 2032
- Table 70: Cancer Monoclonal Antibodies Industry Volume K Unit Forecast, by Country 2019 & 2032
- Table 71: United States Cancer Monoclonal Antibodies Industry Revenue (Million) Forecast, by Application 2019 & 2032
- Table 72: United States Cancer Monoclonal Antibodies Industry Volume (K Unit) Forecast, by Application 2019 & 2032
- Table 73: Canada Cancer Monoclonal Antibodies Industry Revenue (Million) Forecast, by Application 2019 & 2032
- Table 74: Canada Cancer Monoclonal Antibodies Industry Volume (K Unit) Forecast, by Application 2019 & 2032
- Table 75: Mexico Cancer Monoclonal Antibodies Industry Revenue (Million) Forecast, by Application 2019 & 2032
- Table 76: Mexico Cancer Monoclonal Antibodies Industry Volume (K Unit) Forecast, by Application 2019 & 2032
- Table 77: Cancer Monoclonal Antibodies Industry Revenue Million Forecast, by Types of Monoclonal Antibody 2019 & 2032
- Table 78: Cancer Monoclonal Antibodies Industry Volume K Unit Forecast, by Types of Monoclonal Antibody 2019 & 2032
- Table 79: Cancer Monoclonal Antibodies Industry Revenue Million Forecast, by Monoclonal Antibody Therapies 2019 & 2032
- Table 80: Cancer Monoclonal Antibodies Industry Volume K Unit Forecast, by Monoclonal Antibody Therapies 2019 & 2032
- Table 81: Cancer Monoclonal Antibodies Industry Revenue Million Forecast, by Application 2019 & 2032
- Table 82: Cancer Monoclonal Antibodies Industry Volume K Unit Forecast, by Application 2019 & 2032
- Table 83: Cancer Monoclonal Antibodies Industry Revenue Million Forecast, by Country 2019 & 2032
- Table 84: Cancer Monoclonal Antibodies Industry Volume K Unit Forecast, by Country 2019 & 2032
- Table 85: Germany Cancer Monoclonal Antibodies Industry Revenue (Million) Forecast, by Application 2019 & 2032
- Table 86: Germany Cancer Monoclonal Antibodies Industry Volume (K Unit) Forecast, by Application 2019 & 2032
- Table 87: United Kingdom Cancer Monoclonal Antibodies Industry Revenue (Million) Forecast, by Application 2019 & 2032
- Table 88: United Kingdom Cancer Monoclonal Antibodies Industry Volume (K Unit) Forecast, by Application 2019 & 2032
- Table 89: France Cancer Monoclonal Antibodies Industry Revenue (Million) Forecast, by Application 2019 & 2032
- Table 90: France Cancer Monoclonal Antibodies Industry Volume (K Unit) Forecast, by Application 2019 & 2032
- Table 91: Italy Cancer Monoclonal Antibodies Industry Revenue (Million) Forecast, by Application 2019 & 2032
- Table 92: Italy Cancer Monoclonal Antibodies Industry Volume (K Unit) Forecast, by Application 2019 & 2032
- Table 93: Spain Cancer Monoclonal Antibodies Industry Revenue (Million) Forecast, by Application 2019 & 2032
- Table 94: Spain Cancer Monoclonal Antibodies Industry Volume (K Unit) Forecast, by Application 2019 & 2032
- Table 95: Rest of Europe Cancer Monoclonal Antibodies Industry Revenue (Million) Forecast, by Application 2019 & 2032
- Table 96: Rest of Europe Cancer Monoclonal Antibodies Industry Volume (K Unit) Forecast, by Application 2019 & 2032
- Table 97: Cancer Monoclonal Antibodies Industry Revenue Million Forecast, by Types of Monoclonal Antibody 2019 & 2032
- Table 98: Cancer Monoclonal Antibodies Industry Volume K Unit Forecast, by Types of Monoclonal Antibody 2019 & 2032
- Table 99: Cancer Monoclonal Antibodies Industry Revenue Million Forecast, by Monoclonal Antibody Therapies 2019 & 2032
- Table 100: Cancer Monoclonal Antibodies Industry Volume K Unit Forecast, by Monoclonal Antibody Therapies 2019 & 2032
- Table 101: Cancer Monoclonal Antibodies Industry Revenue Million Forecast, by Application 2019 & 2032
- Table 102: Cancer Monoclonal Antibodies Industry Volume K Unit Forecast, by Application 2019 & 2032
- Table 103: Cancer Monoclonal Antibodies Industry Revenue Million Forecast, by Country 2019 & 2032
- Table 104: Cancer Monoclonal Antibodies Industry Volume K Unit Forecast, by Country 2019 & 2032
- Table 105: China Cancer Monoclonal Antibodies Industry Revenue (Million) Forecast, by Application 2019 & 2032
- Table 106: China Cancer Monoclonal Antibodies Industry Volume (K Unit) Forecast, by Application 2019 & 2032
- Table 107: Japan Cancer Monoclonal Antibodies Industry Revenue (Million) Forecast, by Application 2019 & 2032
- Table 108: Japan Cancer Monoclonal Antibodies Industry Volume (K Unit) Forecast, by Application 2019 & 2032
- Table 109: India Cancer Monoclonal Antibodies Industry Revenue (Million) Forecast, by Application 2019 & 2032
- Table 110: India Cancer Monoclonal Antibodies Industry Volume (K Unit) Forecast, by Application 2019 & 2032
- Table 111: Australia Cancer Monoclonal Antibodies Industry Revenue (Million) Forecast, by Application 2019 & 2032
- Table 112: Australia Cancer Monoclonal Antibodies Industry Volume (K Unit) Forecast, by Application 2019 & 2032
- Table 113: South korea Cancer Monoclonal Antibodies Industry Revenue (Million) Forecast, by Application 2019 & 2032
- Table 114: South korea Cancer Monoclonal Antibodies Industry Volume (K Unit) Forecast, by Application 2019 & 2032
- Table 115: Rest of Asia Pacific Cancer Monoclonal Antibodies Industry Revenue (Million) Forecast, by Application 2019 & 2032
- Table 116: Rest of Asia Pacific Cancer Monoclonal Antibodies Industry Volume (K Unit) Forecast, by Application 2019 & 2032
- Table 117: Cancer Monoclonal Antibodies Industry Revenue Million Forecast, by Types of Monoclonal Antibody 2019 & 2032
- Table 118: Cancer Monoclonal Antibodies Industry Volume K Unit Forecast, by Types of Monoclonal Antibody 2019 & 2032
- Table 119: Cancer Monoclonal Antibodies Industry Revenue Million Forecast, by Monoclonal Antibody Therapies 2019 & 2032
- Table 120: Cancer Monoclonal Antibodies Industry Volume K Unit Forecast, by Monoclonal Antibody Therapies 2019 & 2032
- Table 121: Cancer Monoclonal Antibodies Industry Revenue Million Forecast, by Application 2019 & 2032
- Table 122: Cancer Monoclonal Antibodies Industry Volume K Unit Forecast, by Application 2019 & 2032
- Table 123: Cancer Monoclonal Antibodies Industry Revenue Million Forecast, by Country 2019 & 2032
- Table 124: Cancer Monoclonal Antibodies Industry Volume K Unit Forecast, by Country 2019 & 2032
- Table 125: GCC Cancer Monoclonal Antibodies Industry Revenue (Million) Forecast, by Application 2019 & 2032
- Table 126: GCC Cancer Monoclonal Antibodies Industry Volume (K Unit) Forecast, by Application 2019 & 2032
- Table 127: South Africa Cancer Monoclonal Antibodies Industry Revenue (Million) Forecast, by Application 2019 & 2032
- Table 128: South Africa Cancer Monoclonal Antibodies Industry Volume (K Unit) Forecast, by Application 2019 & 2032
- Table 129: Rest of Middle East and Africa Cancer Monoclonal Antibodies Industry Revenue (Million) Forecast, by Application 2019 & 2032
- Table 130: Rest of Middle East and Africa Cancer Monoclonal Antibodies Industry Volume (K Unit) Forecast, by Application 2019 & 2032
- Table 131: Cancer Monoclonal Antibodies Industry Revenue Million Forecast, by Types of Monoclonal Antibody 2019 & 2032
- Table 132: Cancer Monoclonal Antibodies Industry Volume K Unit Forecast, by Types of Monoclonal Antibody 2019 & 2032
- Table 133: Cancer Monoclonal Antibodies Industry Revenue Million Forecast, by Monoclonal Antibody Therapies 2019 & 2032
- Table 134: Cancer Monoclonal Antibodies Industry Volume K Unit Forecast, by Monoclonal Antibody Therapies 2019 & 2032
- Table 135: Cancer Monoclonal Antibodies Industry Revenue Million Forecast, by Application 2019 & 2032
- Table 136: Cancer Monoclonal Antibodies Industry Volume K Unit Forecast, by Application 2019 & 2032
- Table 137: Cancer Monoclonal Antibodies Industry Revenue Million Forecast, by Country 2019 & 2032
- Table 138: Cancer Monoclonal Antibodies Industry Volume K Unit Forecast, by Country 2019 & 2032
- Table 139: Brazil Cancer Monoclonal Antibodies Industry Revenue (Million) Forecast, by Application 2019 & 2032
- Table 140: Brazil Cancer Monoclonal Antibodies Industry Volume (K Unit) Forecast, by Application 2019 & 2032
- Table 141: Argentina Cancer Monoclonal Antibodies Industry Revenue (Million) Forecast, by Application 2019 & 2032
- Table 142: Argentina Cancer Monoclonal Antibodies Industry Volume (K Unit) Forecast, by Application 2019 & 2032
- Table 143: Rest of South America Cancer Monoclonal Antibodies Industry Revenue (Million) Forecast, by Application 2019 & 2032
- Table 144: Rest of South America Cancer Monoclonal Antibodies Industry Volume (K Unit) Forecast, by Application 2019 & 2032
Frequently Asked Questions
1. What is the projected Compound Annual Growth Rate (CAGR) of the Cancer Monoclonal Antibodies Industry?
The projected CAGR is approximately 9.20%.
2. Which companies are prominent players in the Cancer Monoclonal Antibodies Industry?
Key companies in the market include Genmab AS, Novartis AG, Amgen Inc, Merck & Co Inc, F Hoffmann-La Roche Ltd, Spectrum Pharmaceuticals Inc , Eli Lilly and Company, Bristol Myers Squibb Company, Johnson & Johnson, GlaxoSmithKline PLC.
3. What are the main segments of the Cancer Monoclonal Antibodies Industry?
The market segments include Types of Monoclonal Antibody, Monoclonal Antibody Therapies, Application.
4. Can you provide details about the market size?
The market size is estimated to be USD XX Million as of 2022.
5. What are some drivers contributing to market growth?
Growing Prevalence of Cancer; Increasing Investment in Research and Development of Genomic Studies; Rising Advancements and Preference toward Specificity of Monoclonal Antibodies to Target Cancer.
6. What are the notable trends driving market growth?
Trastuzumab (Herceptin) is Expected to Hold Significant Market Share in Monoclonal Antibody Therapies.
7. Are there any restraints impacting market growth?
Stringent Regulatory Guidelines; Long Duration of Research and Development with Rising Failures in Clinical Trials.
8. Can you provide examples of recent developments in the market?
In February 2022, the Janssen Pharmaceutical Companies of Johnson & Johnson received United States Food and Drug Administration (FDA) approval for CARVYKTI (ciltacabtagene autoleucel; cilta-cel) for the treatment of adults with relapsed or refractory multiple myeloma (RRMM) after four or more prior lines of therapy, including a proteasome inhibitor, an immunomodulatory agent, and an anti-CD38 monoclonal antibody.
9. What pricing options are available for accessing the report?
Pricing options include single-user, multi-user, and enterprise licenses priced at USD 3800, USD 4500, and USD 5800 respectively.
10. Is the market size provided in terms of value or volume?
The market size is provided in terms of value, measured in Million and volume, measured in K Unit.
11. Are there any specific market keywords associated with the report?
Yes, the market keyword associated with the report is "Cancer Monoclonal Antibodies Industry," which aids in identifying and referencing the specific market segment covered.
12. How do I determine which pricing option suits my needs best?
The pricing options vary based on user requirements and access needs. Individual users may opt for single-user licenses, while businesses requiring broader access may choose multi-user or enterprise licenses for cost-effective access to the report.
13. Are there any additional resources or data provided in the Cancer Monoclonal Antibodies Industry report?
While the report offers comprehensive insights, it's advisable to review the specific contents or supplementary materials provided to ascertain if additional resources or data are available.
14. How can I stay updated on further developments or reports in the Cancer Monoclonal Antibodies Industry?
To stay informed about further developments, trends, and reports in the Cancer Monoclonal Antibodies Industry, consider subscribing to industry newsletters, following relevant companies and organizations, or regularly checking reputable industry news sources and publications.
Methodology
Step 1 - Identification of Relevant Samples Size from Population Database


Step 2 - Approaches for Defining Global Market Size (Value, Volume* & Price*)

Note*: In applicable scenarios
Step 3 - Data Sources
Primary Research
- Web Analytics
- Survey Reports
- Research Institute
- Latest Research Reports
- Opinion Leaders
Secondary Research
- Annual Reports
- White Paper
- Latest Press Release
- Industry Association
- Paid Database
- Investor Presentations

Step 4 - Data Triangulation
Involves using different sources of information in order to increase the validity of a study
These sources are likely to be stakeholders in a program - participants, other researchers, program staff, other community members, and so on.
Then we put all data in single framework & apply various statistical tools to find out the dynamic on the market.
During the analysis stage, feedback from the stakeholder groups would be compared to determine areas of agreement as well as areas of divergence


