

Key Insights
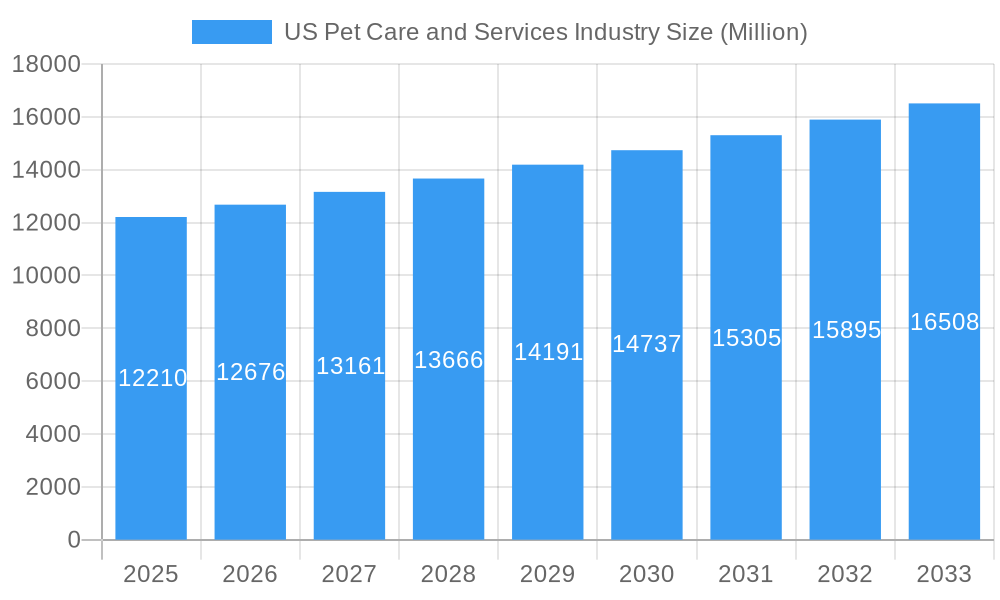
The US pet care and services industry is a robust and expanding market, projected to reach a value of $12.21 billion in 2025 and exhibiting a Compound Annual Growth Rate (CAGR) of 3.51% from 2025 to 2033. This growth is fueled by several key factors. The increasing humanization of pets, leading to higher spending on premium pet food, advanced grooming services, and enriching experiences like pet sitting and boarding, is a significant driver. The expanding pet ownership base, particularly among millennials and Gen Z, contributes significantly to market expansion. Furthermore, the rising availability and affordability of specialized pet healthcare services, including veterinary care and pet insurance, are contributing to the market's positive trajectory. Technological advancements, such as pet tech devices and online pet services platforms, are also enhancing convenience and creating new revenue streams within the industry.
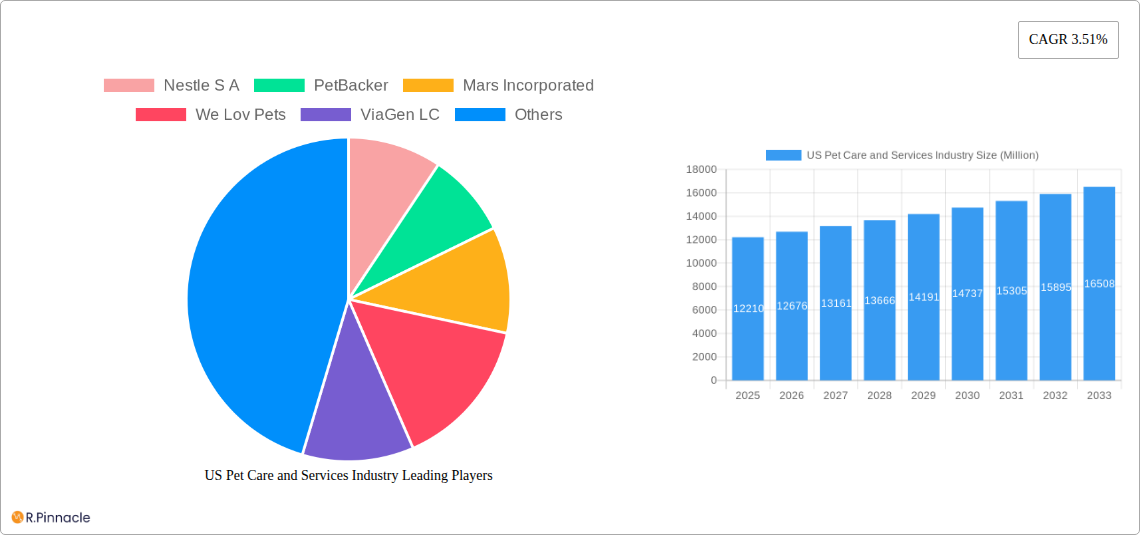
US Pet Care and Services Industry Market Size (In Billion)
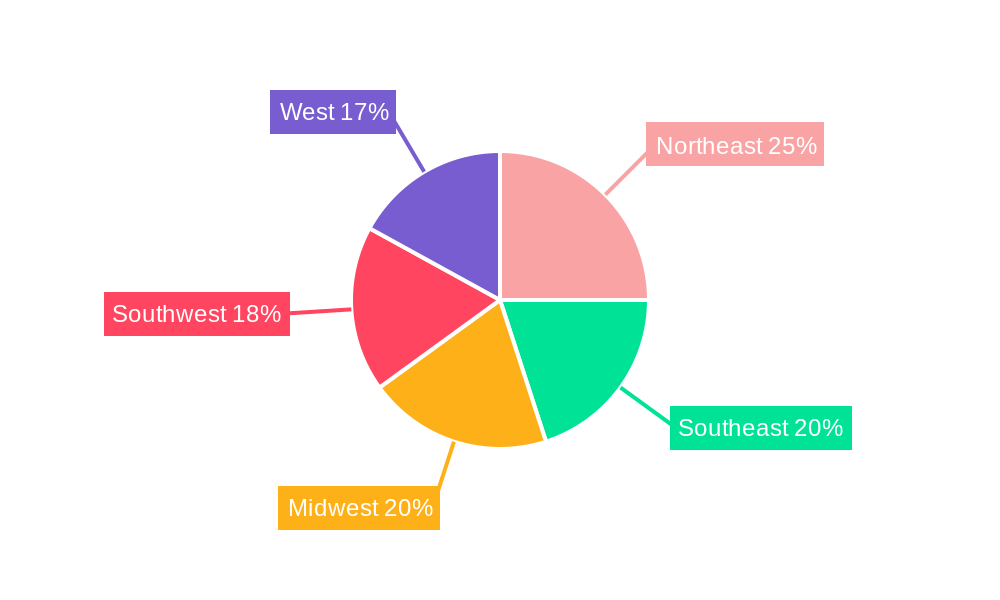
Regional variations exist within the US market, with densely populated areas such as the Northeast and West potentially exhibiting higher market penetration and average spending per pet compared to other regions. However, the overall growth is expected to be widespread, driven by nationwide trends in pet ownership and the increasing willingness of pet owners to invest in their companions' well-being. Challenges such as economic downturns and potential shifts in consumer spending habits could impact growth, but the strong bond between humans and their pets suggests the industry's resilience in the face of economic fluctuations. The competitive landscape is characterized by both large multinational corporations like Nestle S.A. and Mars Incorporated and smaller, specialized businesses focusing on niche services or pet types. This competition fosters innovation and a diverse range of offerings catering to a wide spectrum of pet owners' needs and preferences.
US Pet Care and Services Industry Company Market Share
US Pet Care and Services Industry: A Comprehensive Market Report (2019-2033)
This comprehensive report provides an in-depth analysis of the US Pet Care and Services industry, offering valuable insights for industry professionals, investors, and stakeholders. The study period covers 2019-2033, with 2025 as the base and estimated year. The forecast period spans 2025-2033, and the historical period encompasses 2019-2024. This report leverages extensive market data to analyze key trends, growth drivers, challenges, and opportunities, ultimately projecting a robust future for the sector.
US Pet Care and Services Industry Market Structure & Innovation Trends
This section analyzes the market concentration, innovation drivers, regulatory landscape, product substitutes, end-user demographics, and mergers & acquisitions (M&A) activities within the US pet care and services industry. The market is characterized by a mix of large multinational corporations and smaller, specialized businesses. Key players such as Nestle S.A., Mars Incorporated, and PetSmart LLC hold significant market share, while smaller companies are driving innovation in niche segments.
- Market Concentration: The top 5 players account for approximately xx% of the total market revenue in 2025. This suggests a moderately concentrated market with significant opportunities for both established players and emerging companies.
- Innovation Drivers: Technological advancements in pet food formulations (e.g., personalized nutrition), telehealth for pet care, and innovative service offerings (e.g., pet tech solutions) are driving industry innovation.
- Regulatory Framework: Federal and state regulations concerning pet food safety, animal welfare, and service provision impact market dynamics. These regulations create both opportunities and challenges for businesses operating in this space.
- Product Substitutes: The availability of homemade pet food and alternative pet care services presents competitive pressure for established industry players.
- End-User Demographics: The growing number of pet owners, increasing pet humanization, and rising disposable incomes are key demographic drivers of industry growth.
- M&A Activity: Consolidation within the pet care industry is evident through significant M&A activity. Recent deals, while specific values aren't publicly available for all, indicate a trend towards larger players acquiring smaller, specialized companies to expand their product and service portfolios. Total M&A deal value for the period 2019-2024 is estimated at $xx Million.
US Pet Care and Services Industry Market Dynamics & Trends
This section delves into the market's growth drivers, technological disruptions, evolving consumer preferences, and competitive landscape. The US pet care and services market exhibits a robust growth trajectory, driven by several factors. The increasing humanization of pets, leading to higher spending on pet care, is a significant contributor. This trend, coupled with the growing pet ownership rates and rising disposable incomes among pet owners, fuels market expansion. Technological advancements are transforming the sector, with innovative products like smart feeders and wearables enhancing pet care and owner convenience. Moreover, the increasing preference for premium and specialized pet products and services further drives growth. The market's competitive dynamics are shaped by the presence of both large multinational companies and smaller, specialized businesses, creating a diverse and dynamic environment.
- CAGR (2025-2033): The market is projected to experience a CAGR of xx%.
- Market Penetration: The market penetration of premium pet food is estimated at xx% in 2025.
Dominant Regions & Segments in US Pet Care and Services Industry
This section identifies the leading regions and segments within the US pet care and services market. The market is geographically diverse, with varying levels of growth and penetration across different regions. Specific regional data would require further research based on available reports.
- By Pet Type: Dogs remain the dominant segment, followed by cats, horses, and other animals. The higher ownership rates of dogs drive higher demand for dog-specific products and services.
- By Product Type: Pet food holds the largest market share, followed by pet care products and grooming products. The growing preference for premium and specialized pet food contributes significantly to this dominance.
- By Service Type: Pet grooming services are the leading service segment, followed by pet sitting, pet boarding, and pet walking. The increased demand for convenience and professional pet care drives the growth of these services.
Key drivers for each dominant segment include factors such as increasing pet ownership, rising disposable incomes, and changing consumer preferences towards premium and specialized products and services. The convenience factor and increasing willingness to pay for premium services also greatly influence the growth in specific service areas.
US Pet Care and Services Industry Product Innovations
Recent innovations include advancements in pet food formulations, incorporating functional ingredients for enhanced health and wellness. Technological advancements such as smart feeders, pet wearables, and telehealth platforms are transforming the delivery and management of pet care services. These innovations cater to the increasing demand for convenience, personalized care, and proactive health management for pets. The successful integration of these technologies with existing service models offers significant competitive advantages.
Report Scope & Segmentation Analysis
This report provides a comprehensive analysis of the US pet care and services market, segmented by pet type (cat, dog, horse, other animals), product type (pet food, grooming products, pet care products), and service type (grooming, pet transportation, pet boarding, pet sitting, pet walking, other services). Each segment's growth projections, market size, and competitive dynamics are analyzed, highlighting key trends and opportunities within each specific area.
Key Drivers of US Pet Care and Services Industry Growth
Several factors drive the growth of the US pet care and services industry. The rising pet ownership rates, fueled by changing lifestyles and increased pet humanization, is a primary driver. Rising disposable incomes among pet owners allow for increased spending on premium pet products and services. Technological advancements such as telehealth and smart pet devices are also contributing to market growth, enhancing pet care convenience.
Challenges in the US Pet Care and Services Industry Sector
The industry faces challenges, including fluctuations in raw material costs impacting pet food production and supply chain disruptions affecting the availability of products and services. Increased competition, both from established players and new entrants, also presents a challenge. Regulatory changes and compliance requirements can impact operational costs and market entry.
Emerging Opportunities in US Pet Care and Services Industry
Emerging opportunities lie in the growth of specialized pet care services (e.g., pet nutrition consulting), the expansion of telehealth for pets, and the increasing demand for sustainable and ethically sourced pet products. The market for personalized pet care products and services tailored to specific breeds or health conditions also presents significant growth opportunities.
Leading Players in the US Pet Care and Services Industry Market
- Nestle S.A.
- PetBacker
- Mars Incorporated
- We Lov Pets
- ViaGen LC
- Petmate
- Tail Blazers
- PetSmart LLC
- Hill's Pet Nutrition Inc
- Rover Inc
Key Developments in US Pet Care and Services Industry
- January 2023: Village Pet Care launched, receiving strategic growth investment from General Atlantic, aiming to build a national pet care platform through acquisitions and service expansion.
- February 2023: Bark&Spark launched a new probiotic chew for dogs, emphasizing perfectly dosed, diet-compatible benefits.
Future Outlook for US Pet Care and Services Industry Market
The US pet care and services industry is poised for continued growth, driven by sustained pet humanization, increasing pet ownership, and technological innovation. Strategic opportunities lie in expanding service offerings, investing in technology, and focusing on sustainable and ethical practices. The market's future is bright, with strong potential for growth and innovation in the coming years.
US Pet Care and Services Industry Segmentation
-
1. Pet Type
- 1.1. Cat
- 1.2. Dog
- 1.3. Horse
- 1.4. Other Animals
-
2. Product Type
- 2.1. Pet Food
- 2.2. Grooming Products
- 2.3. Pet Care
-
3. Service Type
- 3.1. Grooming
- 3.2. Pet Transportation
- 3.3. Pet Boarding
- 3.4. Pet Sitting
- 3.5. Pet Walking
- 3.6. Other Services
US Pet Care and Services Industry Segmentation By Geography
-
1. North America
- 1.1. United States
- 1.2. Canada
- 1.3. Mexico
-
2. South America
- 2.1. Brazil
- 2.2. Argentina
- 2.3. Rest of South America
-
3. Europe
- 3.1. United Kingdom
- 3.2. Germany
- 3.3. France
- 3.4. Italy
- 3.5. Spain
- 3.6. Russia
- 3.7. Benelux
- 3.8. Nordics
- 3.9. Rest of Europe
-
4. Middle East & Africa
- 4.1. Turkey
- 4.2. Israel
- 4.3. GCC
- 4.4. North Africa
- 4.5. South Africa
- 4.6. Rest of Middle East & Africa
-
5. Asia Pacific
- 5.1. China
- 5.2. India
- 5.3. Japan
- 5.4. South Korea
- 5.5. ASEAN
- 5.6. Oceania
- 5.7. Rest of Asia Pacific
US Pet Care and Services Industry Regional Market Share
Geographic Coverage of US Pet Care and Services Industry
US Pet Care and Services Industry REPORT HIGHLIGHTS
| Aspects | Details |
|---|---|
| Study Period | 2020-2034 |
| Base Year | 2025 |
| Estimated Year | 2026 |
| Forecast Period | 2026-2034 |
| Historical Period | 2020-2025 |
| Growth Rate | CAGR of 3.51% from 2020-2034 |
| Segmentation |
|
Table of Contents
- 1. Introduction
- 1.1. Research Scope
- 1.2. Market Segmentation
- 1.3. Research Objective
- 1.4. Definitions and Assumptions
- 2. Executive Summary
- 2.1. Market Snapshot
- 3. Market Dynamics
- 3.1. Market Drivers
- 3.2. Market Restrains
- 3.3. Market Trends
- 3.4. Market Opportunities
- 4. Market Factor Analysis
- 4.1. Porters Five Forces
- 4.1.1. Bargaining Power of Suppliers
- 4.1.2. Bargaining Power of Buyers
- 4.1.3. Threat of New Entrants
- 4.1.4. Threat of Substitutes
- 4.1.5. Competitive Rivalry
- 4.2. PESTEL analysis
- 4.3. BCG Analysis
- 4.3.1. Stars (High Growth, High Market Share)
- 4.3.2. Cash Cows (Low Growth, High Market Share)
- 4.3.3. Question Mark (High Growth, Low Market Share)
- 4.3.4. Dogs (Low Growth, Low Market Share)
- 4.4. Ansoff Matrix Analysis
- 4.5. Supply Chain Analysis
- 4.6. Regulatory Landscape
- 4.7. Current Market Potential and Opportunity Assessment (TAM–SAM–SOM Framework)
- 4.8. PRI Analyst Note
- 4.1. Porters Five Forces
- 5. Market Analysis, Insights and Forecast 2021-2033
- 5.1. Market Analysis, Insights and Forecast - by Pet Type
- 5.1.1. Cat
- 5.1.2. Dog
- 5.1.3. Horse
- 5.1.4. Other Animals
- 5.2. Market Analysis, Insights and Forecast - by Product Type
- 5.2.1. Pet Food
- 5.2.2. Grooming Products
- 5.2.3. Pet Care
- 5.3. Market Analysis, Insights and Forecast - by Service Type
- 5.3.1. Grooming
- 5.3.2. Pet Transportation
- 5.3.3. Pet Boarding
- 5.3.4. Pet Sitting
- 5.3.5. Pet Walking
- 5.3.6. Other Services
- 5.4. Market Analysis, Insights and Forecast - by Region
- 5.4.1. North America
- 5.4.2. South America
- 5.4.3. Europe
- 5.4.4. Middle East & Africa
- 5.4.5. Asia Pacific
- 5.1. Market Analysis, Insights and Forecast - by Pet Type
- 6. Global US Pet Care and Services Industry Analysis, Insights and Forecast, 2021-2033
- 6.1. Market Analysis, Insights and Forecast - by Pet Type
- 6.1.1. Cat
- 6.1.2. Dog
- 6.1.3. Horse
- 6.1.4. Other Animals
- 6.2. Market Analysis, Insights and Forecast - by Product Type
- 6.2.1. Pet Food
- 6.2.2. Grooming Products
- 6.2.3. Pet Care
- 6.3. Market Analysis, Insights and Forecast - by Service Type
- 6.3.1. Grooming
- 6.3.2. Pet Transportation
- 6.3.3. Pet Boarding
- 6.3.4. Pet Sitting
- 6.3.5. Pet Walking
- 6.3.6. Other Services
- 6.1. Market Analysis, Insights and Forecast - by Pet Type
- 7. North America US Pet Care and Services Industry Analysis, Insights and Forecast, 2020-2032
- 7.1. Market Analysis, Insights and Forecast - by Pet Type
- 7.1.1. Cat
- 7.1.2. Dog
- 7.1.3. Horse
- 7.1.4. Other Animals
- 7.2. Market Analysis, Insights and Forecast - by Product Type
- 7.2.1. Pet Food
- 7.2.2. Grooming Products
- 7.2.3. Pet Care
- 7.3. Market Analysis, Insights and Forecast - by Service Type
- 7.3.1. Grooming
- 7.3.2. Pet Transportation
- 7.3.3. Pet Boarding
- 7.3.4. Pet Sitting
- 7.3.5. Pet Walking
- 7.3.6. Other Services
- 7.1. Market Analysis, Insights and Forecast - by Pet Type
- 8. South America US Pet Care and Services Industry Analysis, Insights and Forecast, 2020-2032
- 8.1. Market Analysis, Insights and Forecast - by Pet Type
- 8.1.1. Cat
- 8.1.2. Dog
- 8.1.3. Horse
- 8.1.4. Other Animals
- 8.2. Market Analysis, Insights and Forecast - by Product Type
- 8.2.1. Pet Food
- 8.2.2. Grooming Products
- 8.2.3. Pet Care
- 8.3. Market Analysis, Insights and Forecast - by Service Type
- 8.3.1. Grooming
- 8.3.2. Pet Transportation
- 8.3.3. Pet Boarding
- 8.3.4. Pet Sitting
- 8.3.5. Pet Walking
- 8.3.6. Other Services
- 8.1. Market Analysis, Insights and Forecast - by Pet Type
- 9. Europe US Pet Care and Services Industry Analysis, Insights and Forecast, 2020-2032
- 9.1. Market Analysis, Insights and Forecast - by Pet Type
- 9.1.1. Cat
- 9.1.2. Dog
- 9.1.3. Horse
- 9.1.4. Other Animals
- 9.2. Market Analysis, Insights and Forecast - by Product Type
- 9.2.1. Pet Food
- 9.2.2. Grooming Products
- 9.2.3. Pet Care
- 9.3. Market Analysis, Insights and Forecast - by Service Type
- 9.3.1. Grooming
- 9.3.2. Pet Transportation
- 9.3.3. Pet Boarding
- 9.3.4. Pet Sitting
- 9.3.5. Pet Walking
- 9.3.6. Other Services
- 9.1. Market Analysis, Insights and Forecast - by Pet Type
- 10. Middle East & Africa US Pet Care and Services Industry Analysis, Insights and Forecast, 2020-2032
- 10.1. Market Analysis, Insights and Forecast - by Pet Type
- 10.1.1. Cat
- 10.1.2. Dog
- 10.1.3. Horse
- 10.1.4. Other Animals
- 10.2. Market Analysis, Insights and Forecast - by Product Type
- 10.2.1. Pet Food
- 10.2.2. Grooming Products
- 10.2.3. Pet Care
- 10.3. Market Analysis, Insights and Forecast - by Service Type
- 10.3.1. Grooming
- 10.3.2. Pet Transportation
- 10.3.3. Pet Boarding
- 10.3.4. Pet Sitting
- 10.3.5. Pet Walking
- 10.3.6. Other Services
- 10.1. Market Analysis, Insights and Forecast - by Pet Type
- 11. Asia Pacific US Pet Care and Services Industry Analysis, Insights and Forecast, 2020-2032
- 11.1. Market Analysis, Insights and Forecast - by Pet Type
- 11.1.1. Cat
- 11.1.2. Dog
- 11.1.3. Horse
- 11.1.4. Other Animals
- 11.2. Market Analysis, Insights and Forecast - by Product Type
- 11.2.1. Pet Food
- 11.2.2. Grooming Products
- 11.2.3. Pet Care
- 11.3. Market Analysis, Insights and Forecast - by Service Type
- 11.3.1. Grooming
- 11.3.2. Pet Transportation
- 11.3.3. Pet Boarding
- 11.3.4. Pet Sitting
- 11.3.5. Pet Walking
- 11.3.6. Other Services
- 11.1. Market Analysis, Insights and Forecast - by Pet Type
- 12. Competitive Analysis
- 12.1. Company Profiles
- 12.1.1 Nestle S A
- 12.1.1.1. Company Overview
- 12.1.1.2. Products
- 12.1.1.3. Company Financials
- 12.1.1.4. SWOT Analysis
- 12.1.2 PetBacker
- 12.1.2.1. Company Overview
- 12.1.2.2. Products
- 12.1.2.3. Company Financials
- 12.1.2.4. SWOT Analysis
- 12.1.3 Mars Incorporated
- 12.1.3.1. Company Overview
- 12.1.3.2. Products
- 12.1.3.3. Company Financials
- 12.1.3.4. SWOT Analysis
- 12.1.4 We Lov Pets
- 12.1.4.1. Company Overview
- 12.1.4.2. Products
- 12.1.4.3. Company Financials
- 12.1.4.4. SWOT Analysis
- 12.1.5 ViaGen LC
- 12.1.5.1. Company Overview
- 12.1.5.2. Products
- 12.1.5.3. Company Financials
- 12.1.5.4. SWOT Analysis
- 12.1.6 Petmate
- 12.1.6.1. Company Overview
- 12.1.6.2. Products
- 12.1.6.3. Company Financials
- 12.1.6.4. SWOT Analysis
- 12.1.7 Tail Blazers
- 12.1.7.1. Company Overview
- 12.1.7.2. Products
- 12.1.7.3. Company Financials
- 12.1.7.4. SWOT Analysis
- 12.1.8 PetSmart LLC
- 12.1.8.1. Company Overview
- 12.1.8.2. Products
- 12.1.8.3. Company Financials
- 12.1.8.4. SWOT Analysis
- 12.1.9 Hill's Pet Nutrition Inc
- 12.1.9.1. Company Overview
- 12.1.9.2. Products
- 12.1.9.3. Company Financials
- 12.1.9.4. SWOT Analysis
- 12.1.10 Rover Inc
- 12.1.10.1. Company Overview
- 12.1.10.2. Products
- 12.1.10.3. Company Financials
- 12.1.10.4. SWOT Analysis
- 12.1.1 Nestle S A
- 12.2. Market Entropy
- 12.2.1 Company's Key Areas Served
- 12.2.2 Recent Developments
- 12.3. Company Market Share Analysis 2025
- 12.3.1 Top 5 Companies Market Share Analysis
- 12.3.2 Top 3 Companies Market Share Analysis
- 12.4. List of Potential Customers
- 13. Research Methodology
List of Figures
- Figure 1: Global US Pet Care and Services Industry Revenue Breakdown (Million, %) by Region 2025 & 2033
- Figure 2: Global US Pet Care and Services Industry Volume Breakdown (K Unit, %) by Region 2025 & 2033
- Figure 3: North America US Pet Care and Services Industry Revenue (Million), by Pet Type 2025 & 2033
- Figure 4: North America US Pet Care and Services Industry Volume (K Unit), by Pet Type 2025 & 2033
- Figure 5: North America US Pet Care and Services Industry Revenue Share (%), by Pet Type 2025 & 2033
- Figure 6: North America US Pet Care and Services Industry Volume Share (%), by Pet Type 2025 & 2033
- Figure 7: North America US Pet Care and Services Industry Revenue (Million), by Product Type 2025 & 2033
- Figure 8: North America US Pet Care and Services Industry Volume (K Unit), by Product Type 2025 & 2033
- Figure 9: North America US Pet Care and Services Industry Revenue Share (%), by Product Type 2025 & 2033
- Figure 10: North America US Pet Care and Services Industry Volume Share (%), by Product Type 2025 & 2033
- Figure 11: North America US Pet Care and Services Industry Revenue (Million), by Service Type 2025 & 2033
- Figure 12: North America US Pet Care and Services Industry Volume (K Unit), by Service Type 2025 & 2033
- Figure 13: North America US Pet Care and Services Industry Revenue Share (%), by Service Type 2025 & 2033
- Figure 14: North America US Pet Care and Services Industry Volume Share (%), by Service Type 2025 & 2033
- Figure 15: North America US Pet Care and Services Industry Revenue (Million), by Country 2025 & 2033
- Figure 16: North America US Pet Care and Services Industry Volume (K Unit), by Country 2025 & 2033
- Figure 17: North America US Pet Care and Services Industry Revenue Share (%), by Country 2025 & 2033
- Figure 18: North America US Pet Care and Services Industry Volume Share (%), by Country 2025 & 2033
- Figure 19: South America US Pet Care and Services Industry Revenue (Million), by Pet Type 2025 & 2033
- Figure 20: South America US Pet Care and Services Industry Volume (K Unit), by Pet Type 2025 & 2033
- Figure 21: South America US Pet Care and Services Industry Revenue Share (%), by Pet Type 2025 & 2033
- Figure 22: South America US Pet Care and Services Industry Volume Share (%), by Pet Type 2025 & 2033
- Figure 23: South America US Pet Care and Services Industry Revenue (Million), by Product Type 2025 & 2033
- Figure 24: South America US Pet Care and Services Industry Volume (K Unit), by Product Type 2025 & 2033
- Figure 25: South America US Pet Care and Services Industry Revenue Share (%), by Product Type 2025 & 2033
- Figure 26: South America US Pet Care and Services Industry Volume Share (%), by Product Type 2025 & 2033
- Figure 27: South America US Pet Care and Services Industry Revenue (Million), by Service Type 2025 & 2033
- Figure 28: South America US Pet Care and Services Industry Volume (K Unit), by Service Type 2025 & 2033
- Figure 29: South America US Pet Care and Services Industry Revenue Share (%), by Service Type 2025 & 2033
- Figure 30: South America US Pet Care and Services Industry Volume Share (%), by Service Type 2025 & 2033
- Figure 31: South America US Pet Care and Services Industry Revenue (Million), by Country 2025 & 2033
- Figure 32: South America US Pet Care and Services Industry Volume (K Unit), by Country 2025 & 2033
- Figure 33: South America US Pet Care and Services Industry Revenue Share (%), by Country 2025 & 2033
- Figure 34: South America US Pet Care and Services Industry Volume Share (%), by Country 2025 & 2033
- Figure 35: Europe US Pet Care and Services Industry Revenue (Million), by Pet Type 2025 & 2033
- Figure 36: Europe US Pet Care and Services Industry Volume (K Unit), by Pet Type 2025 & 2033
- Figure 37: Europe US Pet Care and Services Industry Revenue Share (%), by Pet Type 2025 & 2033
- Figure 38: Europe US Pet Care and Services Industry Volume Share (%), by Pet Type 2025 & 2033
- Figure 39: Europe US Pet Care and Services Industry Revenue (Million), by Product Type 2025 & 2033
- Figure 40: Europe US Pet Care and Services Industry Volume (K Unit), by Product Type 2025 & 2033
- Figure 41: Europe US Pet Care and Services Industry Revenue Share (%), by Product Type 2025 & 2033
- Figure 42: Europe US Pet Care and Services Industry Volume Share (%), by Product Type 2025 & 2033
- Figure 43: Europe US Pet Care and Services Industry Revenue (Million), by Service Type 2025 & 2033
- Figure 44: Europe US Pet Care and Services Industry Volume (K Unit), by Service Type 2025 & 2033
- Figure 45: Europe US Pet Care and Services Industry Revenue Share (%), by Service Type 2025 & 2033
- Figure 46: Europe US Pet Care and Services Industry Volume Share (%), by Service Type 2025 & 2033
- Figure 47: Europe US Pet Care and Services Industry Revenue (Million), by Country 2025 & 2033
- Figure 48: Europe US Pet Care and Services Industry Volume (K Unit), by Country 2025 & 2033
- Figure 49: Europe US Pet Care and Services Industry Revenue Share (%), by Country 2025 & 2033
- Figure 50: Europe US Pet Care and Services Industry Volume Share (%), by Country 2025 & 2033
- Figure 51: Middle East & Africa US Pet Care and Services Industry Revenue (Million), by Pet Type 2025 & 2033
- Figure 52: Middle East & Africa US Pet Care and Services Industry Volume (K Unit), by Pet Type 2025 & 2033
- Figure 53: Middle East & Africa US Pet Care and Services Industry Revenue Share (%), by Pet Type 2025 & 2033
- Figure 54: Middle East & Africa US Pet Care and Services Industry Volume Share (%), by Pet Type 2025 & 2033
- Figure 55: Middle East & Africa US Pet Care and Services Industry Revenue (Million), by Product Type 2025 & 2033
- Figure 56: Middle East & Africa US Pet Care and Services Industry Volume (K Unit), by Product Type 2025 & 2033
- Figure 57: Middle East & Africa US Pet Care and Services Industry Revenue Share (%), by Product Type 2025 & 2033
- Figure 58: Middle East & Africa US Pet Care and Services Industry Volume Share (%), by Product Type 2025 & 2033
- Figure 59: Middle East & Africa US Pet Care and Services Industry Revenue (Million), by Service Type 2025 & 2033
- Figure 60: Middle East & Africa US Pet Care and Services Industry Volume (K Unit), by Service Type 2025 & 2033
- Figure 61: Middle East & Africa US Pet Care and Services Industry Revenue Share (%), by Service Type 2025 & 2033
- Figure 62: Middle East & Africa US Pet Care and Services Industry Volume Share (%), by Service Type 2025 & 2033
- Figure 63: Middle East & Africa US Pet Care and Services Industry Revenue (Million), by Country 2025 & 2033
- Figure 64: Middle East & Africa US Pet Care and Services Industry Volume (K Unit), by Country 2025 & 2033
- Figure 65: Middle East & Africa US Pet Care and Services Industry Revenue Share (%), by Country 2025 & 2033
- Figure 66: Middle East & Africa US Pet Care and Services Industry Volume Share (%), by Country 2025 & 2033
- Figure 67: Asia Pacific US Pet Care and Services Industry Revenue (Million), by Pet Type 2025 & 2033
- Figure 68: Asia Pacific US Pet Care and Services Industry Volume (K Unit), by Pet Type 2025 & 2033
- Figure 69: Asia Pacific US Pet Care and Services Industry Revenue Share (%), by Pet Type 2025 & 2033
- Figure 70: Asia Pacific US Pet Care and Services Industry Volume Share (%), by Pet Type 2025 & 2033
- Figure 71: Asia Pacific US Pet Care and Services Industry Revenue (Million), by Product Type 2025 & 2033
- Figure 72: Asia Pacific US Pet Care and Services Industry Volume (K Unit), by Product Type 2025 & 2033
- Figure 73: Asia Pacific US Pet Care and Services Industry Revenue Share (%), by Product Type 2025 & 2033
- Figure 74: Asia Pacific US Pet Care and Services Industry Volume Share (%), by Product Type 2025 & 2033
- Figure 75: Asia Pacific US Pet Care and Services Industry Revenue (Million), by Service Type 2025 & 2033
- Figure 76: Asia Pacific US Pet Care and Services Industry Volume (K Unit), by Service Type 2025 & 2033
- Figure 77: Asia Pacific US Pet Care and Services Industry Revenue Share (%), by Service Type 2025 & 2033
- Figure 78: Asia Pacific US Pet Care and Services Industry Volume Share (%), by Service Type 2025 & 2033
- Figure 79: Asia Pacific US Pet Care and Services Industry Revenue (Million), by Country 2025 & 2033
- Figure 80: Asia Pacific US Pet Care and Services Industry Volume (K Unit), by Country 2025 & 2033
- Figure 81: Asia Pacific US Pet Care and Services Industry Revenue Share (%), by Country 2025 & 2033
- Figure 82: Asia Pacific US Pet Care and Services Industry Volume Share (%), by Country 2025 & 2033
List of Tables
- Table 1: Global US Pet Care and Services Industry Revenue Million Forecast, by Pet Type 2020 & 2033
- Table 2: Global US Pet Care and Services Industry Volume K Unit Forecast, by Pet Type 2020 & 2033
- Table 3: Global US Pet Care and Services Industry Revenue Million Forecast, by Product Type 2020 & 2033
- Table 4: Global US Pet Care and Services Industry Volume K Unit Forecast, by Product Type 2020 & 2033
- Table 5: Global US Pet Care and Services Industry Revenue Million Forecast, by Service Type 2020 & 2033
- Table 6: Global US Pet Care and Services Industry Volume K Unit Forecast, by Service Type 2020 & 2033
- Table 7: Global US Pet Care and Services Industry Revenue Million Forecast, by Region 2020 & 2033
- Table 8: Global US Pet Care and Services Industry Volume K Unit Forecast, by Region 2020 & 2033
- Table 9: Global US Pet Care and Services Industry Revenue Million Forecast, by Pet Type 2020 & 2033
- Table 10: Global US Pet Care and Services Industry Volume K Unit Forecast, by Pet Type 2020 & 2033
- Table 11: Global US Pet Care and Services Industry Revenue Million Forecast, by Product Type 2020 & 2033
- Table 12: Global US Pet Care and Services Industry Volume K Unit Forecast, by Product Type 2020 & 2033
- Table 13: Global US Pet Care and Services Industry Revenue Million Forecast, by Service Type 2020 & 2033
- Table 14: Global US Pet Care and Services Industry Volume K Unit Forecast, by Service Type 2020 & 2033
- Table 15: Global US Pet Care and Services Industry Revenue Million Forecast, by Country 2020 & 2033
- Table 16: Global US Pet Care and Services Industry Volume K Unit Forecast, by Country 2020 & 2033
- Table 17: United States US Pet Care and Services Industry Revenue (Million) Forecast, by Application 2020 & 2033
- Table 18: United States US Pet Care and Services Industry Volume (K Unit) Forecast, by Application 2020 & 2033
- Table 19: Canada US Pet Care and Services Industry Revenue (Million) Forecast, by Application 2020 & 2033
- Table 20: Canada US Pet Care and Services Industry Volume (K Unit) Forecast, by Application 2020 & 2033
- Table 21: Mexico US Pet Care and Services Industry Revenue (Million) Forecast, by Application 2020 & 2033
- Table 22: Mexico US Pet Care and Services Industry Volume (K Unit) Forecast, by Application 2020 & 2033
- Table 23: Global US Pet Care and Services Industry Revenue Million Forecast, by Pet Type 2020 & 2033
- Table 24: Global US Pet Care and Services Industry Volume K Unit Forecast, by Pet Type 2020 & 2033
- Table 25: Global US Pet Care and Services Industry Revenue Million Forecast, by Product Type 2020 & 2033
- Table 26: Global US Pet Care and Services Industry Volume K Unit Forecast, by Product Type 2020 & 2033
- Table 27: Global US Pet Care and Services Industry Revenue Million Forecast, by Service Type 2020 & 2033
- Table 28: Global US Pet Care and Services Industry Volume K Unit Forecast, by Service Type 2020 & 2033
- Table 29: Global US Pet Care and Services Industry Revenue Million Forecast, by Country 2020 & 2033
- Table 30: Global US Pet Care and Services Industry Volume K Unit Forecast, by Country 2020 & 2033
- Table 31: Brazil US Pet Care and Services Industry Revenue (Million) Forecast, by Application 2020 & 2033
- Table 32: Brazil US Pet Care and Services Industry Volume (K Unit) Forecast, by Application 2020 & 2033
- Table 33: Argentina US Pet Care and Services Industry Revenue (Million) Forecast, by Application 2020 & 2033
- Table 34: Argentina US Pet Care and Services Industry Volume (K Unit) Forecast, by Application 2020 & 2033
- Table 35: Rest of South America US Pet Care and Services Industry Revenue (Million) Forecast, by Application 2020 & 2033
- Table 36: Rest of South America US Pet Care and Services Industry Volume (K Unit) Forecast, by Application 2020 & 2033
- Table 37: Global US Pet Care and Services Industry Revenue Million Forecast, by Pet Type 2020 & 2033
- Table 38: Global US Pet Care and Services Industry Volume K Unit Forecast, by Pet Type 2020 & 2033
- Table 39: Global US Pet Care and Services Industry Revenue Million Forecast, by Product Type 2020 & 2033
- Table 40: Global US Pet Care and Services Industry Volume K Unit Forecast, by Product Type 2020 & 2033
- Table 41: Global US Pet Care and Services Industry Revenue Million Forecast, by Service Type 2020 & 2033
- Table 42: Global US Pet Care and Services Industry Volume K Unit Forecast, by Service Type 2020 & 2033
- Table 43: Global US Pet Care and Services Industry Revenue Million Forecast, by Country 2020 & 2033
- Table 44: Global US Pet Care and Services Industry Volume K Unit Forecast, by Country 2020 & 2033
- Table 45: United Kingdom US Pet Care and Services Industry Revenue (Million) Forecast, by Application 2020 & 2033
- Table 46: United Kingdom US Pet Care and Services Industry Volume (K Unit) Forecast, by Application 2020 & 2033
- Table 47: Germany US Pet Care and Services Industry Revenue (Million) Forecast, by Application 2020 & 2033
- Table 48: Germany US Pet Care and Services Industry Volume (K Unit) Forecast, by Application 2020 & 2033
- Table 49: France US Pet Care and Services Industry Revenue (Million) Forecast, by Application 2020 & 2033
- Table 50: France US Pet Care and Services Industry Volume (K Unit) Forecast, by Application 2020 & 2033
- Table 51: Italy US Pet Care and Services Industry Revenue (Million) Forecast, by Application 2020 & 2033
- Table 52: Italy US Pet Care and Services Industry Volume (K Unit) Forecast, by Application 2020 & 2033
- Table 53: Spain US Pet Care and Services Industry Revenue (Million) Forecast, by Application 2020 & 2033
- Table 54: Spain US Pet Care and Services Industry Volume (K Unit) Forecast, by Application 2020 & 2033
- Table 55: Russia US Pet Care and Services Industry Revenue (Million) Forecast, by Application 2020 & 2033
- Table 56: Russia US Pet Care and Services Industry Volume (K Unit) Forecast, by Application 2020 & 2033
- Table 57: Benelux US Pet Care and Services Industry Revenue (Million) Forecast, by Application 2020 & 2033
- Table 58: Benelux US Pet Care and Services Industry Volume (K Unit) Forecast, by Application 2020 & 2033
- Table 59: Nordics US Pet Care and Services Industry Revenue (Million) Forecast, by Application 2020 & 2033
- Table 60: Nordics US Pet Care and Services Industry Volume (K Unit) Forecast, by Application 2020 & 2033
- Table 61: Rest of Europe US Pet Care and Services Industry Revenue (Million) Forecast, by Application 2020 & 2033
- Table 62: Rest of Europe US Pet Care and Services Industry Volume (K Unit) Forecast, by Application 2020 & 2033
- Table 63: Global US Pet Care and Services Industry Revenue Million Forecast, by Pet Type 2020 & 2033
- Table 64: Global US Pet Care and Services Industry Volume K Unit Forecast, by Pet Type 2020 & 2033
- Table 65: Global US Pet Care and Services Industry Revenue Million Forecast, by Product Type 2020 & 2033
- Table 66: Global US Pet Care and Services Industry Volume K Unit Forecast, by Product Type 2020 & 2033
- Table 67: Global US Pet Care and Services Industry Revenue Million Forecast, by Service Type 2020 & 2033
- Table 68: Global US Pet Care and Services Industry Volume K Unit Forecast, by Service Type 2020 & 2033
- Table 69: Global US Pet Care and Services Industry Revenue Million Forecast, by Country 2020 & 2033
- Table 70: Global US Pet Care and Services Industry Volume K Unit Forecast, by Country 2020 & 2033
- Table 71: Turkey US Pet Care and Services Industry Revenue (Million) Forecast, by Application 2020 & 2033
- Table 72: Turkey US Pet Care and Services Industry Volume (K Unit) Forecast, by Application 2020 & 2033
- Table 73: Israel US Pet Care and Services Industry Revenue (Million) Forecast, by Application 2020 & 2033
- Table 74: Israel US Pet Care and Services Industry Volume (K Unit) Forecast, by Application 2020 & 2033
- Table 75: GCC US Pet Care and Services Industry Revenue (Million) Forecast, by Application 2020 & 2033
- Table 76: GCC US Pet Care and Services Industry Volume (K Unit) Forecast, by Application 2020 & 2033
- Table 77: North Africa US Pet Care and Services Industry Revenue (Million) Forecast, by Application 2020 & 2033
- Table 78: North Africa US Pet Care and Services Industry Volume (K Unit) Forecast, by Application 2020 & 2033
- Table 79: South Africa US Pet Care and Services Industry Revenue (Million) Forecast, by Application 2020 & 2033
- Table 80: South Africa US Pet Care and Services Industry Volume (K Unit) Forecast, by Application 2020 & 2033
- Table 81: Rest of Middle East & Africa US Pet Care and Services Industry Revenue (Million) Forecast, by Application 2020 & 2033
- Table 82: Rest of Middle East & Africa US Pet Care and Services Industry Volume (K Unit) Forecast, by Application 2020 & 2033
- Table 83: Global US Pet Care and Services Industry Revenue Million Forecast, by Pet Type 2020 & 2033
- Table 84: Global US Pet Care and Services Industry Volume K Unit Forecast, by Pet Type 2020 & 2033
- Table 85: Global US Pet Care and Services Industry Revenue Million Forecast, by Product Type 2020 & 2033
- Table 86: Global US Pet Care and Services Industry Volume K Unit Forecast, by Product Type 2020 & 2033
- Table 87: Global US Pet Care and Services Industry Revenue Million Forecast, by Service Type 2020 & 2033
- Table 88: Global US Pet Care and Services Industry Volume K Unit Forecast, by Service Type 2020 & 2033
- Table 89: Global US Pet Care and Services Industry Revenue Million Forecast, by Country 2020 & 2033
- Table 90: Global US Pet Care and Services Industry Volume K Unit Forecast, by Country 2020 & 2033
- Table 91: China US Pet Care and Services Industry Revenue (Million) Forecast, by Application 2020 & 2033
- Table 92: China US Pet Care and Services Industry Volume (K Unit) Forecast, by Application 2020 & 2033
- Table 93: India US Pet Care and Services Industry Revenue (Million) Forecast, by Application 2020 & 2033
- Table 94: India US Pet Care and Services Industry Volume (K Unit) Forecast, by Application 2020 & 2033
- Table 95: Japan US Pet Care and Services Industry Revenue (Million) Forecast, by Application 2020 & 2033
- Table 96: Japan US Pet Care and Services Industry Volume (K Unit) Forecast, by Application 2020 & 2033
- Table 97: South Korea US Pet Care and Services Industry Revenue (Million) Forecast, by Application 2020 & 2033
- Table 98: South Korea US Pet Care and Services Industry Volume (K Unit) Forecast, by Application 2020 & 2033
- Table 99: ASEAN US Pet Care and Services Industry Revenue (Million) Forecast, by Application 2020 & 2033
- Table 100: ASEAN US Pet Care and Services Industry Volume (K Unit) Forecast, by Application 2020 & 2033
- Table 101: Oceania US Pet Care and Services Industry Revenue (Million) Forecast, by Application 2020 & 2033
- Table 102: Oceania US Pet Care and Services Industry Volume (K Unit) Forecast, by Application 2020 & 2033
- Table 103: Rest of Asia Pacific US Pet Care and Services Industry Revenue (Million) Forecast, by Application 2020 & 2033
- Table 104: Rest of Asia Pacific US Pet Care and Services Industry Volume (K Unit) Forecast, by Application 2020 & 2033
Frequently Asked Questions
1. What is the projected Compound Annual Growth Rate (CAGR) of the US Pet Care and Services Industry?
The projected CAGR is approximately 3.51%.
2. Which companies are prominent players in the US Pet Care and Services Industry?
Key companies in the market include Nestle S A, PetBacker, Mars Incorporated, We Lov Pets, ViaGen LC, Petmate, Tail Blazers, PetSmart LLC, Hill's Pet Nutrition Inc, Rover Inc.
3. What are the main segments of the US Pet Care and Services Industry?
The market segments include Pet Type , Product Type, Service Type.
4. Can you provide details about the market size?
The market size is estimated to be USD 12.21 Million as of 2022.
5. What are some drivers contributing to market growth?
Rising Pet Ownership and Pet Insurance; Increased Adoption of Technology for Pet Care.
6. What are the notable trends driving market growth?
Dog Segment is Expected to Account for the Large Market Share Over the Forecast Period.
7. Are there any restraints impacting market growth?
High Cost of Products and Services.
8. Can you provide examples of recent developments in the market?
February 2023: Bark&Spark released a new Probiotic Chew for Dogs. Bark&Spark's chews are touted as perfectly dosed and compatible with any dog's diet, with just a few chews a day giving the desired effects.
9. What pricing options are available for accessing the report?
Pricing options include single-user, multi-user, and enterprise licenses priced at USD 3800, USD 4500, and USD 5800 respectively.
10. Is the market size provided in terms of value or volume?
The market size is provided in terms of value, measured in Million and volume, measured in K Unit.
11. Are there any specific market keywords associated with the report?
Yes, the market keyword associated with the report is "US Pet Care and Services Industry," which aids in identifying and referencing the specific market segment covered.
12. How do I determine which pricing option suits my needs best?
The pricing options vary based on user requirements and access needs. Individual users may opt for single-user licenses, while businesses requiring broader access may choose multi-user or enterprise licenses for cost-effective access to the report.
13. Are there any additional resources or data provided in the US Pet Care and Services Industry report?
While the report offers comprehensive insights, it's advisable to review the specific contents or supplementary materials provided to ascertain if additional resources or data are available.
14. How can I stay updated on further developments or reports in the US Pet Care and Services Industry?
To stay informed about further developments, trends, and reports in the US Pet Care and Services Industry, consider subscribing to industry newsletters, following relevant companies and organizations, or regularly checking reputable industry news sources and publications.
Methodology
Step 1 - Identification of Relevant Samples Size from Population Database


Step 2 - Approaches for Defining Global Market Size (Value, Volume* & Price*)

Note*: In applicable scenarios
Step 3 - Data Sources
Primary Research
- Web Analytics
- Survey Reports
- Research Institute
- Latest Research Reports
- Opinion Leaders
Secondary Research
- Annual Reports
- White Paper
- Latest Press Release
- Industry Association
- Paid Database
- Investor Presentations

Step 4 - Data Triangulation
Involves using different sources of information in order to increase the validity of a study
These sources are likely to be stakeholders in a program - participants, other researchers, program staff, other community members, and so on.
Then we put all data in single framework & apply various statistical tools to find out the dynamic on the market.
During the analysis stage, feedback from the stakeholder groups would be compared to determine areas of agreement as well as areas of divergence