Unveiling Carbon Nanotubes Market Growth Patterns: CAGR Analysis and Forecasts 2025-2033

Carbon Nanotubes Market by Type (Multi-walled Carbon Nanotubes (MWCNT), Single-walled Carbon Nanotubes (SWCNT), Other Ty), by End-user Industry (Electronics, Aerospace and Defense, Automotive, Healthcare, Energy, Other En), by Asia Pacific (China, India, Japan, South Korea, Rest of Asia Pacific), by North America (United States, Canada, Mexico), by Europe (Germany, United Kingdom, Italy, France, Spain, Rest of Europe), by South America (Brazil, Argentina, Rest of South America), by Middle East and Africa (Saudi Arabia, South Africa, Rest of Middle East and Africa) Forecast 2025-2033

Aug 12 2025
Base Year: 2024

180 Pages
Main Logo

Unveiling Carbon Nanotubes Market Growth Patterns: CAGR Analysis and Forecasts 2025-2033


Home
Industries
Chemicals & Materials
sponsor image
sponsor image
sponsor image
sponsor image

Tailored for you

  • In-depth Analysis Tailored to Specified Regions or Segments
  • Company Profiles Customized to User Preferences
  • Comprehensive Insights Focused on Specific Segments or Regions
  • Customized Evaluation of Competitive Landscape to Meet Your Needs
  • Tailored Customization to Address Other Specific Requirements
Ask for customization


Key Insights

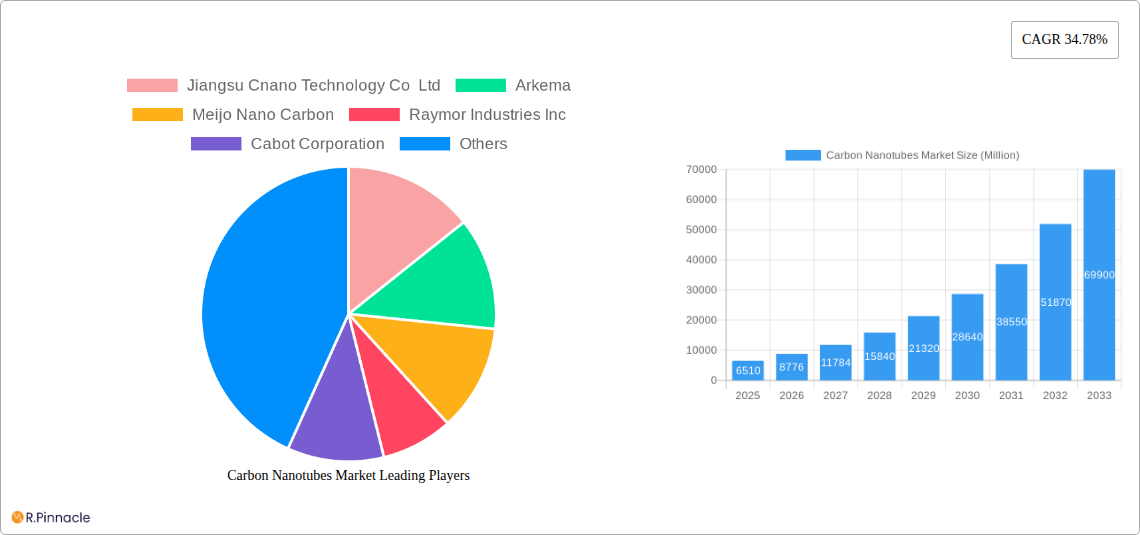
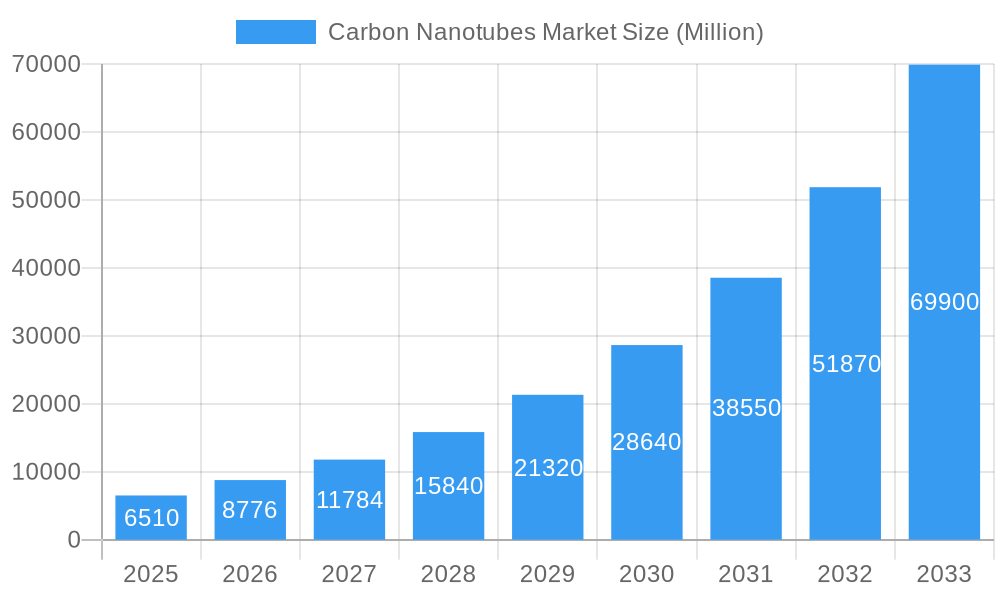
The global carbon nanotubes (CNTs) market, valued at $6.51 billion in 2025, is projected to experience robust growth, driven by a compound annual growth rate (CAGR) of 34.78% from 2025 to 2033. This rapid expansion is fueled by the increasing adoption of CNTs across diverse sectors. The electronics industry, a major driver, leverages CNTs' exceptional electrical conductivity and high surface area for advanced applications in transistors, sensors, and flexible electronics. Furthermore, the aerospace and defense industries are increasingly utilizing CNTs to develop lightweight yet high-strength composites for aircraft and defense systems. The automotive sector is exploring CNTs for enhancing battery performance and creating lighter, more fuel-efficient vehicles. Growth is also spurred by the rising demand for CNTs in the healthcare industry for drug delivery systems and biosensors, and in the energy sector for improved solar cells and energy storage solutions. The market segmentation reveals that multi-walled carbon nanotubes (MWCNTs) currently hold a larger market share compared to single-walled carbon nanotubes (SWCNTs), although the latter segment is expected to witness faster growth due to their superior electrical properties and potential in high-end applications. Geographical analysis indicates that Asia Pacific, particularly China, is a dominant region in CNT production and consumption, driven by a robust manufacturing base and growing technological advancements. However, North America and Europe are expected to exhibit significant growth due to increasing research and development activities and a high adoption rate in various applications. While challenges like high production costs and potential toxicity concerns exist, ongoing innovations in synthesis and processing techniques are addressing these limitations, paving the way for broader market penetration.

The continued advancements in CNT production methods are expected to lead to cost reductions, making CNTs more competitive with traditional materials. This, coupled with the increasing awareness of the environmental benefits associated with using lighter and more durable materials, is expected to further fuel market growth. The development of new applications, especially in areas like advanced biomedical devices and flexible displays, will further drive demand. Strategic collaborations between material manufacturers and end-users are crucial in accelerating the adoption of CNTs and realizing their full potential. Competitive landscape analysis reveals a mix of established players and emerging companies, leading to an environment of innovation and collaboration. However, maintaining consistent product quality and addressing potential safety concerns remain essential for sustainable market growth. The forecast period of 2025-2033 anticipates a substantial increase in market size, reflecting the growing technological adoption and the diverse applications across various industries.

Carbon Nanotubes Market Research Report - Market Size, Growth & Forecast

Carbon Nanotubes Market Report: 2019-2033

This comprehensive report provides a detailed analysis of the Carbon Nanotubes Market, offering invaluable insights for industry professionals, investors, and researchers. Covering the period from 2019 to 2033, with a focus on 2025, this report examines market dynamics, competitive landscapes, and future growth potential. The report leverages a robust methodology and incorporates recent industry developments, providing actionable intelligence for strategic decision-making.

Carbon Nanotubes Market Structure & Innovation Trends

This section analyzes the Carbon Nanotubes market structure, highlighting key trends driving innovation. We delve into market concentration, examining the market share held by leading players like LG Chem, Cabot Corporation, and Ocsial. The report assesses the impact of mergers and acquisitions (M&A) activities, including deal values and their influence on market consolidation. Innovation drivers, such as advancements in synthesis techniques and the development of new applications, are explored. Furthermore, the report analyzes regulatory frameworks impacting the market and examines the influence of substitute products. End-user demographics and their evolving needs are analyzed, offering a granular understanding of market segmentation.

  • Market Concentration: The market exhibits a moderately concentrated structure with a few major players holding significant market share. The exact figures for market share will be detailed in the full report.
  • M&A Activity: Several notable M&A activities have shaped the market landscape, particularly the recent merger of Showa Denko KK and Showa Denko Materials Co. Ltd. The report details the financial aspects of these deals and their strategic implications.
  • Innovation Drivers: Advancements in CNT synthesis, including improved purity and yield, are driving market growth. Exploration of new applications in various sectors further contributes to innovation.
  • Regulatory Landscape: Government policies and regulations related to nanomaterials safety and environmental impact will be assessed in the report, with analysis of their potential effect on market growth.
  • Substitute Products: The report discusses potential substitutes for CNTs and their impact on market competition. The market share of these substitutes will be included.
Carbon Nanotubes Market Growth

Carbon Nanotubes Market Dynamics & Trends

This section provides a detailed analysis of market dynamics, including growth drivers, technological disruptions, consumer preferences, and competitive dynamics within the Carbon Nanotubes market. The report projects a Compound Annual Growth Rate (CAGR) of xx% during the forecast period (2025-2033), driven by the increasing demand for lightweight and high-strength materials in various sectors. Technological advancements in CNT synthesis and functionalization are significantly impacting market penetration. The analysis also considers the shifting consumer preferences towards sustainable and eco-friendly materials and the overall competitive landscape.

Carbon Nanotubes Market Growth

Dominant Regions & Segments in Carbon Nanotubes Market

This section identifies the leading regions and segments within the Carbon Nanotubes market. While detailed market share data will be presented in the full report, preliminary analysis suggests that Asia-Pacific is currently the dominant region, driven by strong demand from the electronics and automotive industries. The report further breaks down the market by type (Multi-walled Carbon Nanotubes (MWCNT), Single-walled Carbon Nanotubes (SWCNT), Other Types) and end-user industry (Electronics, Aerospace and Defense, Automotive, Healthcare, Energy, Other End-user Industries).

  • By Type:

    • MWCNT: This segment holds the largest market share due to its lower production cost and wider applications.
    • SWCNT: This segment exhibits high growth potential driven by its superior electrical and mechanical properties.
    • Other Types: This segment includes functionalized CNTs and other specialized types, which are experiencing niche growth.
  • By End-user Industry:

    • Electronics: This segment remains a major driver of market growth, fueled by the increasing demand for high-performance electronics.
    • Aerospace and Defense: The need for lightweight and durable materials in aerospace and defense applications fuels segment growth.
    • Automotive: Growing demand for lightweight vehicles and improved fuel efficiency is driving the automotive segment.
    • Healthcare: Emerging applications in drug delivery and medical devices contribute to the growth of this segment.
    • Energy: The usage of CNTs in energy storage and generation applications continues to grow.
    • Other End-user Industries: Textiles, plastics, and composites industries are adopting CNTs for enhanced material properties.

Carbon Nanotubes Market Product Innovations

This section focuses on recent product developments, applications, and competitive advantages within the Carbon Nanotubes market. Key technological trends include advancements in CNT synthesis methods leading to improved purity and functionality, as well as the development of novel applications across various sectors. Companies are focusing on improving the dispersibility and processability of CNTs to enhance their integration into existing manufacturing processes. This leads to a better market fit, and enhanced product performance and cost-effectiveness drive market competitiveness.

Report Scope & Segmentation Analysis

This report comprehensively segments the Carbon Nanotubes market by type (MWCNT, SWCNT, Other Types) and end-user industry (Electronics, Aerospace & Defense, Automotive, Healthcare, Energy, Other End-user Industries). Each segment’s growth projections, market size, and competitive dynamics are detailed in the full report. For instance, the electronics segment is expected to experience substantial growth, driven by increasing demand for advanced electronics and consumer electronics.

Key Drivers of Carbon Nanotubes Market Growth

The Carbon Nanotubes market is driven by several key factors, including technological advancements in CNT synthesis and functionalization leading to superior material properties. Growing demand across various end-use industries, particularly in electronics, aerospace, and automotive sectors, also contributes to market expansion. Favorable government policies and initiatives promoting the use of advanced materials further fuel market growth.

Challenges in the Carbon Nanotubes Market Sector

Despite promising growth prospects, the Carbon Nanotubes market faces several challenges, including the high production cost of high-quality CNTs, the complexity of their dispersion and integration into composite materials, and concerns related to their potential health and environmental impacts. These challenges create barriers to broader adoption and significantly influence market dynamics. Supply chain disruptions could also negatively impact market growth.

Emerging Opportunities in Carbon Nanotubes Market

Emerging opportunities exist within the Carbon Nanotubes market, such as the development of new applications in areas like flexible electronics, energy storage, and biomedical devices. Further research and development into improving the scalability and cost-effectiveness of CNT production will unlock significant market potential. The exploration of novel applications will further expand the market's reach.

Leading Players in the Carbon Nanotubes Market Market

  • Jiangsu Cnano Technology Co Ltd
  • Arkema
  • Meijo Nano Carbon
  • Raymor Industries Inc
  • Cabot Corporation
  • Nanocyl SA
  • Showa Denko KK (Resonac Holdings Corporation)
  • Ocsial
  • Hyperion Catalysis International
  • LG Chem
  • Nano-C
  • CHASM
  • Chengdu Organic Chemicals Co Ltd (Timesnano)
  • Kumho Petrochemical

Key Developments in Carbon Nanotubes Market Industry

  • May 2023: LG Chem announced the construction of its fourth carbon nanotube (CNT) plant in Daesan, South Korea, with operation slated for 2025. This expansion will double LG Chem's annual CNT production capacity to 6,100 tons.
  • January 2023: Showa Denko KK and Showa Denko Materials Co. Ltd unified to establish Resonac Holdings Corporation and Resonac Corporation.

Future Outlook for Carbon Nanotubes Market Market

The Carbon Nanotubes market holds immense future potential, driven by ongoing technological advancements, growing demand from diverse industries, and increasing investments in research and development. Strategic partnerships and collaborations amongst key players are expected to further accelerate market growth. The market is poised for significant expansion as applications continue to broaden across diverse sectors.

Carbon Nanotubes Market Segmentation

  • 1. Type
    • 1.1. Multi-walled Carbon Nanotubes (MWCNT)
    • 1.2. Single-walled Carbon Nanotubes (SWCNT)
    • 1.3. Other Ty
  • 2. End-user Industry
    • 2.1. Electronics
    • 2.2. Aerospace and Defense
    • 2.3. Automotive
    • 2.4. Healthcare
    • 2.5. Energy
    • 2.6. Other En

Carbon Nanotubes Market Segmentation By Geography

  • 1. Asia Pacific
    • 1.1. China
    • 1.2. India
    • 1.3. Japan
    • 1.4. South Korea
    • 1.5. Rest of Asia Pacific
  • 2. North America
    • 2.1. United States
    • 2.2. Canada
    • 2.3. Mexico
  • 3. Europe
    • 3.1. Germany
    • 3.2. United Kingdom
    • 3.3. Italy
    • 3.4. France
    • 3.5. Spain
    • 3.6. Rest of Europe
  • 4. South America
    • 4.1. Brazil
    • 4.2. Argentina
    • 4.3. Rest of South America
  • 5. Middle East and Africa
    • 5.1. Saudi Arabia
    • 5.2. South Africa
    • 5.3. Rest of Middle East and Africa
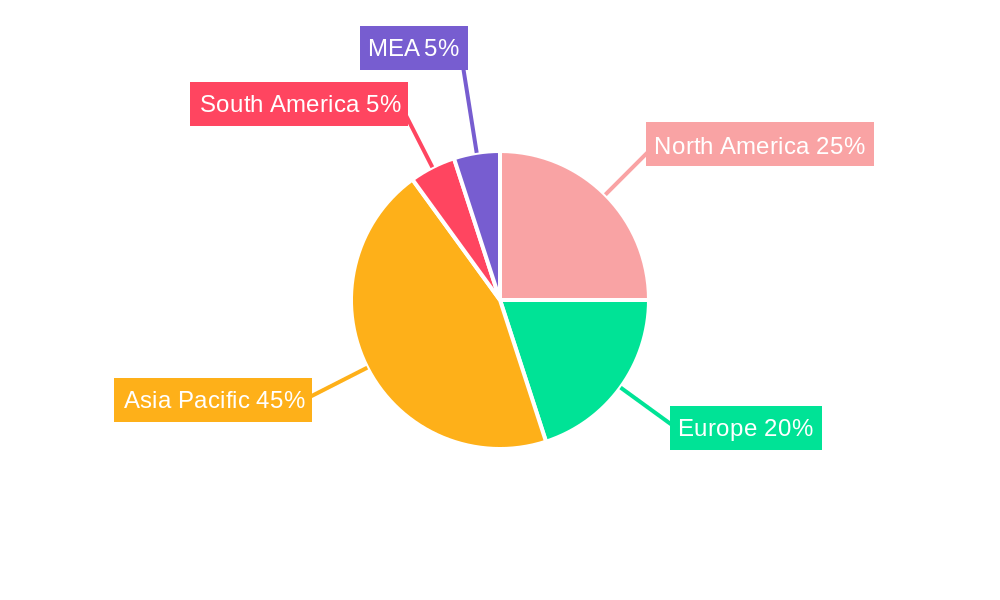
Carbon Nanotubes Market Regional Share


Carbon Nanotubes Market REPORT HIGHLIGHTS

AspectsDetails
Study Period 2019-2033
Base Year 2024
Estimated Year 2025
Forecast Period2025-2033
Historical Period2019-2024
Growth RateCAGR of 34.78% from 2019-2033
Segmentation
    • By Type
      • Multi-walled Carbon Nanotubes (MWCNT)
      • Single-walled Carbon Nanotubes (SWCNT)
      • Other Ty
    • By End-user Industry
      • Electronics
      • Aerospace and Defense
      • Automotive
      • Healthcare
      • Energy
      • Other En
  • By Geography
    • Asia Pacific
      • China
      • India
      • Japan
      • South Korea
      • Rest of Asia Pacific
    • North America
      • United States
      • Canada
      • Mexico
    • Europe
      • Germany
      • United Kingdom
      • Italy
      • France
      • Spain
      • Rest of Europe
    • South America
      • Brazil
      • Argentina
      • Rest of South America
    • Middle East and Africa
      • Saudi Arabia
      • South Africa
      • Rest of Middle East and Africa


Table of Contents

  1. 1. Introduction
    • 1.1. Research Scope
    • 1.2. Market Segmentation
    • 1.3. Research Methodology
    • 1.4. Definitions and Assumptions
  2. 2. Executive Summary
    • 2.1. Introduction
  3. 3. Market Dynamics
    • 3.1. Introduction
      • 3.2. Market Drivers
        • 3.2.1. Growing Usage of Carbon Nantotubes in Electric Vehicles; Increasing Demand for Advance Materials in Numerous Applications
      • 3.3. Market Restrains
        • 3.3.1. Environmental Concerns and Health Safety Issues; Other Restraints
      • 3.4. Market Trends
        • 3.4.1. Energy Segment to Dominate the Market
  4. 4. Market Factor Analysis
    • 4.1. Porters Five Forces
    • 4.2. Supply/Value Chain
    • 4.3. PESTEL analysis
    • 4.4. Market Entropy
    • 4.5. Patent/Trademark Analysis
  5. 5. Global Carbon Nanotubes Market Analysis, Insights and Forecast, 2019-2031
    • 5.1. Market Analysis, Insights and Forecast - by Type
      • 5.1.1. Multi-walled Carbon Nanotubes (MWCNT)
      • 5.1.2. Single-walled Carbon Nanotubes (SWCNT)
      • 5.1.3. Other Ty
    • 5.2. Market Analysis, Insights and Forecast - by End-user Industry
      • 5.2.1. Electronics
      • 5.2.2. Aerospace and Defense
      • 5.2.3. Automotive
      • 5.2.4. Healthcare
      • 5.2.5. Energy
      • 5.2.6. Other En
    • 5.3. Market Analysis, Insights and Forecast - by Region
      • 5.3.1. Asia Pacific
      • 5.3.2. North America
      • 5.3.3. Europe
      • 5.3.4. South America
      • 5.3.5. Middle East and Africa
  6. 6. Asia Pacific Carbon Nanotubes Market Analysis, Insights and Forecast, 2019-2031
    • 6.1. Market Analysis, Insights and Forecast - by Type
      • 6.1.1. Multi-walled Carbon Nanotubes (MWCNT)
      • 6.1.2. Single-walled Carbon Nanotubes (SWCNT)
      • 6.1.3. Other Ty
    • 6.2. Market Analysis, Insights and Forecast - by End-user Industry
      • 6.2.1. Electronics
      • 6.2.2. Aerospace and Defense
      • 6.2.3. Automotive
      • 6.2.4. Healthcare
      • 6.2.5. Energy
      • 6.2.6. Other En
  7. 7. North America Carbon Nanotubes Market Analysis, Insights and Forecast, 2019-2031
    • 7.1. Market Analysis, Insights and Forecast - by Type
      • 7.1.1. Multi-walled Carbon Nanotubes (MWCNT)
      • 7.1.2. Single-walled Carbon Nanotubes (SWCNT)
      • 7.1.3. Other Ty
    • 7.2. Market Analysis, Insights and Forecast - by End-user Industry
      • 7.2.1. Electronics
      • 7.2.2. Aerospace and Defense
      • 7.2.3. Automotive
      • 7.2.4. Healthcare
      • 7.2.5. Energy
      • 7.2.6. Other En
  8. 8. Europe Carbon Nanotubes Market Analysis, Insights and Forecast, 2019-2031
    • 8.1. Market Analysis, Insights and Forecast - by Type
      • 8.1.1. Multi-walled Carbon Nanotubes (MWCNT)
      • 8.1.2. Single-walled Carbon Nanotubes (SWCNT)
      • 8.1.3. Other Ty
    • 8.2. Market Analysis, Insights and Forecast - by End-user Industry
      • 8.2.1. Electronics
      • 8.2.2. Aerospace and Defense
      • 8.2.3. Automotive
      • 8.2.4. Healthcare
      • 8.2.5. Energy
      • 8.2.6. Other En
  9. 9. South America Carbon Nanotubes Market Analysis, Insights and Forecast, 2019-2031
    • 9.1. Market Analysis, Insights and Forecast - by Type
      • 9.1.1. Multi-walled Carbon Nanotubes (MWCNT)
      • 9.1.2. Single-walled Carbon Nanotubes (SWCNT)
      • 9.1.3. Other Ty
    • 9.2. Market Analysis, Insights and Forecast - by End-user Industry
      • 9.2.1. Electronics
      • 9.2.2. Aerospace and Defense
      • 9.2.3. Automotive
      • 9.2.4. Healthcare
      • 9.2.5. Energy
      • 9.2.6. Other En
  10. 10. Middle East and Africa Carbon Nanotubes Market Analysis, Insights and Forecast, 2019-2031
    • 10.1. Market Analysis, Insights and Forecast - by Type
      • 10.1.1. Multi-walled Carbon Nanotubes (MWCNT)
      • 10.1.2. Single-walled Carbon Nanotubes (SWCNT)
      • 10.1.3. Other Ty
    • 10.2. Market Analysis, Insights and Forecast - by End-user Industry
      • 10.2.1. Electronics
      • 10.2.2. Aerospace and Defense
      • 10.2.3. Automotive
      • 10.2.4. Healthcare
      • 10.2.5. Energy
      • 10.2.6. Other En
  11. 11. North America Carbon Nanotubes Market Analysis, Insights and Forecast, 2019-2031
      • 11.1. Market Analysis, Insights and Forecast - By Country/Sub-region
        • 11.1.1 United States
        • 11.1.2 Canada
        • 11.1.3 Mexico
  12. 12. Europe Carbon Nanotubes Market Analysis, Insights and Forecast, 2019-2031
      • 12.1. Market Analysis, Insights and Forecast - By Country/Sub-region
        • 12.1.1 Germany
        • 12.1.2 France
        • 12.1.3 Italy
        • 12.1.4 United Kingdom
        • 12.1.5 Netherlands
        • 12.1.6 Rest of Europe
  13. 13. Asia Pacific Carbon Nanotubes Market Analysis, Insights and Forecast, 2019-2031
      • 13.1. Market Analysis, Insights and Forecast - By Country/Sub-region
        • 13.1.1 China
        • 13.1.2 Japan
        • 13.1.3 India
        • 13.1.4 South Korea
        • 13.1.5 Taiwan
        • 13.1.6 Australia
        • 13.1.7 Rest of Asia-Pacific
  14. 14. South America Carbon Nanotubes Market Analysis, Insights and Forecast, 2019-2031
      • 14.1. Market Analysis, Insights and Forecast - By Country/Sub-region
        • 14.1.1 Brazil
        • 14.1.2 Argentina
        • 14.1.3 Rest of South America
  15. 15. MEA Carbon Nanotubes Market Analysis, Insights and Forecast, 2019-2031
      • 15.1. Market Analysis, Insights and Forecast - By Country/Sub-region
        • 15.1.1 Middle East
        • 15.1.2 Africa
  16. 16. Competitive Analysis
    • 16.1. Global Market Share Analysis 2024
      • 16.2. Company Profiles
        • 16.2.1 Jiangsu Cnano Technology Co Ltd
          • 16.2.1.1. Overview
          • 16.2.1.2. Products
          • 16.2.1.3. SWOT Analysis
          • 16.2.1.4. Recent Developments
          • 16.2.1.5. Financials (Based on Availability)
        • 16.2.2 Arkema
          • 16.2.2.1. Overview
          • 16.2.2.2. Products
          • 16.2.2.3. SWOT Analysis
          • 16.2.2.4. Recent Developments
          • 16.2.2.5. Financials (Based on Availability)
        • 16.2.3 Meijo Nano Carbon
          • 16.2.3.1. Overview
          • 16.2.3.2. Products
          • 16.2.3.3. SWOT Analysis
          • 16.2.3.4. Recent Developments
          • 16.2.3.5. Financials (Based on Availability)
        • 16.2.4 Raymor Industries Inc
          • 16.2.4.1. Overview
          • 16.2.4.2. Products
          • 16.2.4.3. SWOT Analysis
          • 16.2.4.4. Recent Developments
          • 16.2.4.5. Financials (Based on Availability)
        • 16.2.5 Cabot Corporation
          • 16.2.5.1. Overview
          • 16.2.5.2. Products
          • 16.2.5.3. SWOT Analysis
          • 16.2.5.4. Recent Developments
          • 16.2.5.5. Financials (Based on Availability)
        • 16.2.6 Nanocyl SA
          • 16.2.6.1. Overview
          • 16.2.6.2. Products
          • 16.2.6.3. SWOT Analysis
          • 16.2.6.4. Recent Developments
          • 16.2.6.5. Financials (Based on Availability)
        • 16.2.7 Showa Denko KK (Resonac Holdings Corporation)
          • 16.2.7.1. Overview
          • 16.2.7.2. Products
          • 16.2.7.3. SWOT Analysis
          • 16.2.7.4. Recent Developments
          • 16.2.7.5. Financials (Based on Availability)
        • 16.2.8 Ocsial
          • 16.2.8.1. Overview
          • 16.2.8.2. Products
          • 16.2.8.3. SWOT Analysis
          • 16.2.8.4. Recent Developments
          • 16.2.8.5. Financials (Based on Availability)
        • 16.2.9 Hyperion Catalysis International
          • 16.2.9.1. Overview
          • 16.2.9.2. Products
          • 16.2.9.3. SWOT Analysis
          • 16.2.9.4. Recent Developments
          • 16.2.9.5. Financials (Based on Availability)
        • 16.2.10 LG Chem
          • 16.2.10.1. Overview
          • 16.2.10.2. Products
          • 16.2.10.3. SWOT Analysis
          • 16.2.10.4. Recent Developments
          • 16.2.10.5. Financials (Based on Availability)
        • 16.2.11 Nano-C
          • 16.2.11.1. Overview
          • 16.2.11.2. Products
          • 16.2.11.3. SWOT Analysis
          • 16.2.11.4. Recent Developments
          • 16.2.11.5. Financials (Based on Availability)
        • 16.2.12 CHASM
          • 16.2.12.1. Overview
          • 16.2.12.2. Products
          • 16.2.12.3. SWOT Analysis
          • 16.2.12.4. Recent Developments
          • 16.2.12.5. Financials (Based on Availability)
        • 16.2.13 Chengdu Organic Chemicals Co Ltd (Timesnano)
          • 16.2.13.1. Overview
          • 16.2.13.2. Products
          • 16.2.13.3. SWOT Analysis
          • 16.2.13.4. Recent Developments
          • 16.2.13.5. Financials (Based on Availability)
        • 16.2.14 Kumho Petrochemical
          • 16.2.14.1. Overview
          • 16.2.14.2. Products
          • 16.2.14.3. SWOT Analysis
          • 16.2.14.4. Recent Developments
          • 16.2.14.5. Financials (Based on Availability)

List of Figures

  1. Figure 1: Global Carbon Nanotubes Market Revenue Breakdown (Million, %) by Region 2024 & 2032
  2. Figure 2: Global Carbon Nanotubes Market Volume Breakdown (K Tons, %) by Region 2024 & 2032
  3. Figure 3: North America Carbon Nanotubes Market Revenue (Million), by Country 2024 & 2032
  4. Figure 4: North America Carbon Nanotubes Market Volume (K Tons), by Country 2024 & 2032
  5. Figure 5: North America Carbon Nanotubes Market Revenue Share (%), by Country 2024 & 2032
  6. Figure 6: North America Carbon Nanotubes Market Volume Share (%), by Country 2024 & 2032
  7. Figure 7: Europe Carbon Nanotubes Market Revenue (Million), by Country 2024 & 2032
  8. Figure 8: Europe Carbon Nanotubes Market Volume (K Tons), by Country 2024 & 2032
  9. Figure 9: Europe Carbon Nanotubes Market Revenue Share (%), by Country 2024 & 2032
  10. Figure 10: Europe Carbon Nanotubes Market Volume Share (%), by Country 2024 & 2032
  11. Figure 11: Asia Pacific Carbon Nanotubes Market Revenue (Million), by Country 2024 & 2032
  12. Figure 12: Asia Pacific Carbon Nanotubes Market Volume (K Tons), by Country 2024 & 2032
  13. Figure 13: Asia Pacific Carbon Nanotubes Market Revenue Share (%), by Country 2024 & 2032
  14. Figure 14: Asia Pacific Carbon Nanotubes Market Volume Share (%), by Country 2024 & 2032
  15. Figure 15: South America Carbon Nanotubes Market Revenue (Million), by Country 2024 & 2032
  16. Figure 16: South America Carbon Nanotubes Market Volume (K Tons), by Country 2024 & 2032
  17. Figure 17: South America Carbon Nanotubes Market Revenue Share (%), by Country 2024 & 2032
  18. Figure 18: South America Carbon Nanotubes Market Volume Share (%), by Country 2024 & 2032
  19. Figure 19: MEA Carbon Nanotubes Market Revenue (Million), by Country 2024 & 2032
  20. Figure 20: MEA Carbon Nanotubes Market Volume (K Tons), by Country 2024 & 2032
  21. Figure 21: MEA Carbon Nanotubes Market Revenue Share (%), by Country 2024 & 2032
  22. Figure 22: MEA Carbon Nanotubes Market Volume Share (%), by Country 2024 & 2032
  23. Figure 23: Asia Pacific Carbon Nanotubes Market Revenue (Million), by Type 2024 & 2032
  24. Figure 24: Asia Pacific Carbon Nanotubes Market Volume (K Tons), by Type 2024 & 2032
  25. Figure 25: Asia Pacific Carbon Nanotubes Market Revenue Share (%), by Type 2024 & 2032
  26. Figure 26: Asia Pacific Carbon Nanotubes Market Volume Share (%), by Type 2024 & 2032
  27. Figure 27: Asia Pacific Carbon Nanotubes Market Revenue (Million), by End-user Industry 2024 & 2032
  28. Figure 28: Asia Pacific Carbon Nanotubes Market Volume (K Tons), by End-user Industry 2024 & 2032
  29. Figure 29: Asia Pacific Carbon Nanotubes Market Revenue Share (%), by End-user Industry 2024 & 2032
  30. Figure 30: Asia Pacific Carbon Nanotubes Market Volume Share (%), by End-user Industry 2024 & 2032
  31. Figure 31: Asia Pacific Carbon Nanotubes Market Revenue (Million), by Country 2024 & 2032
  32. Figure 32: Asia Pacific Carbon Nanotubes Market Volume (K Tons), by Country 2024 & 2032
  33. Figure 33: Asia Pacific Carbon Nanotubes Market Revenue Share (%), by Country 2024 & 2032
  34. Figure 34: Asia Pacific Carbon Nanotubes Market Volume Share (%), by Country 2024 & 2032
  35. Figure 35: North America Carbon Nanotubes Market Revenue (Million), by Type 2024 & 2032
  36. Figure 36: North America Carbon Nanotubes Market Volume (K Tons), by Type 2024 & 2032
  37. Figure 37: North America Carbon Nanotubes Market Revenue Share (%), by Type 2024 & 2032
  38. Figure 38: North America Carbon Nanotubes Market Volume Share (%), by Type 2024 & 2032
  39. Figure 39: North America Carbon Nanotubes Market Revenue (Million), by End-user Industry 2024 & 2032
  40. Figure 40: North America Carbon Nanotubes Market Volume (K Tons), by End-user Industry 2024 & 2032
  41. Figure 41: North America Carbon Nanotubes Market Revenue Share (%), by End-user Industry 2024 & 2032
  42. Figure 42: North America Carbon Nanotubes Market Volume Share (%), by End-user Industry 2024 & 2032
  43. Figure 43: North America Carbon Nanotubes Market Revenue (Million), by Country 2024 & 2032
  44. Figure 44: North America Carbon Nanotubes Market Volume (K Tons), by Country 2024 & 2032
  45. Figure 45: North America Carbon Nanotubes Market Revenue Share (%), by Country 2024 & 2032
  46. Figure 46: North America Carbon Nanotubes Market Volume Share (%), by Country 2024 & 2032
  47. Figure 47: Europe Carbon Nanotubes Market Revenue (Million), by Type 2024 & 2032
  48. Figure 48: Europe Carbon Nanotubes Market Volume (K Tons), by Type 2024 & 2032
  49. Figure 49: Europe Carbon Nanotubes Market Revenue Share (%), by Type 2024 & 2032
  50. Figure 50: Europe Carbon Nanotubes Market Volume Share (%), by Type 2024 & 2032
  51. Figure 51: Europe Carbon Nanotubes Market Revenue (Million), by End-user Industry 2024 & 2032
  52. Figure 52: Europe Carbon Nanotubes Market Volume (K Tons), by End-user Industry 2024 & 2032
  53. Figure 53: Europe Carbon Nanotubes Market Revenue Share (%), by End-user Industry 2024 & 2032
  54. Figure 54: Europe Carbon Nanotubes Market Volume Share (%), by End-user Industry 2024 & 2032
  55. Figure 55: Europe Carbon Nanotubes Market Revenue (Million), by Country 2024 & 2032
  56. Figure 56: Europe Carbon Nanotubes Market Volume (K Tons), by Country 2024 & 2032
  57. Figure 57: Europe Carbon Nanotubes Market Revenue Share (%), by Country 2024 & 2032
  58. Figure 58: Europe Carbon Nanotubes Market Volume Share (%), by Country 2024 & 2032
  59. Figure 59: South America Carbon Nanotubes Market Revenue (Million), by Type 2024 & 2032
  60. Figure 60: South America Carbon Nanotubes Market Volume (K Tons), by Type 2024 & 2032
  61. Figure 61: South America Carbon Nanotubes Market Revenue Share (%), by Type 2024 & 2032
  62. Figure 62: South America Carbon Nanotubes Market Volume Share (%), by Type 2024 & 2032
  63. Figure 63: South America Carbon Nanotubes Market Revenue (Million), by End-user Industry 2024 & 2032
  64. Figure 64: South America Carbon Nanotubes Market Volume (K Tons), by End-user Industry 2024 & 2032
  65. Figure 65: South America Carbon Nanotubes Market Revenue Share (%), by End-user Industry 2024 & 2032
  66. Figure 66: South America Carbon Nanotubes Market Volume Share (%), by End-user Industry 2024 & 2032
  67. Figure 67: South America Carbon Nanotubes Market Revenue (Million), by Country 2024 & 2032
  68. Figure 68: South America Carbon Nanotubes Market Volume (K Tons), by Country 2024 & 2032
  69. Figure 69: South America Carbon Nanotubes Market Revenue Share (%), by Country 2024 & 2032
  70. Figure 70: South America Carbon Nanotubes Market Volume Share (%), by Country 2024 & 2032
  71. Figure 71: Middle East and Africa Carbon Nanotubes Market Revenue (Million), by Type 2024 & 2032
  72. Figure 72: Middle East and Africa Carbon Nanotubes Market Volume (K Tons), by Type 2024 & 2032
  73. Figure 73: Middle East and Africa Carbon Nanotubes Market Revenue Share (%), by Type 2024 & 2032
  74. Figure 74: Middle East and Africa Carbon Nanotubes Market Volume Share (%), by Type 2024 & 2032
  75. Figure 75: Middle East and Africa Carbon Nanotubes Market Revenue (Million), by End-user Industry 2024 & 2032
  76. Figure 76: Middle East and Africa Carbon Nanotubes Market Volume (K Tons), by End-user Industry 2024 & 2032
  77. Figure 77: Middle East and Africa Carbon Nanotubes Market Revenue Share (%), by End-user Industry 2024 & 2032
  78. Figure 78: Middle East and Africa Carbon Nanotubes Market Volume Share (%), by End-user Industry 2024 & 2032
  79. Figure 79: Middle East and Africa Carbon Nanotubes Market Revenue (Million), by Country 2024 & 2032
  80. Figure 80: Middle East and Africa Carbon Nanotubes Market Volume (K Tons), by Country 2024 & 2032
  81. Figure 81: Middle East and Africa Carbon Nanotubes Market Revenue Share (%), by Country 2024 & 2032
  82. Figure 82: Middle East and Africa Carbon Nanotubes Market Volume Share (%), by Country 2024 & 2032

List of Tables

  1. Table 1: Global Carbon Nanotubes Market Revenue Million Forecast, by Region 2019 & 2032
  2. Table 2: Global Carbon Nanotubes Market Volume K Tons Forecast, by Region 2019 & 2032
  3. Table 3: Global Carbon Nanotubes Market Revenue Million Forecast, by Type 2019 & 2032
  4. Table 4: Global Carbon Nanotubes Market Volume K Tons Forecast, by Type 2019 & 2032
  5. Table 5: Global Carbon Nanotubes Market Revenue Million Forecast, by End-user Industry 2019 & 2032
  6. Table 6: Global Carbon Nanotubes Market Volume K Tons Forecast, by End-user Industry 2019 & 2032
  7. Table 7: Global Carbon Nanotubes Market Revenue Million Forecast, by Region 2019 & 2032
  8. Table 8: Global Carbon Nanotubes Market Volume K Tons Forecast, by Region 2019 & 2032
  9. Table 9: Global Carbon Nanotubes Market Revenue Million Forecast, by Country 2019 & 2032
  10. Table 10: Global Carbon Nanotubes Market Volume K Tons Forecast, by Country 2019 & 2032
  11. Table 11: United States Carbon Nanotubes Market Revenue (Million) Forecast, by Application 2019 & 2032
  12. Table 12: United States Carbon Nanotubes Market Volume (K Tons) Forecast, by Application 2019 & 2032
  13. Table 13: Canada Carbon Nanotubes Market Revenue (Million) Forecast, by Application 2019 & 2032
  14. Table 14: Canada Carbon Nanotubes Market Volume (K Tons) Forecast, by Application 2019 & 2032
  15. Table 15: Mexico Carbon Nanotubes Market Revenue (Million) Forecast, by Application 2019 & 2032
  16. Table 16: Mexico Carbon Nanotubes Market Volume (K Tons) Forecast, by Application 2019 & 2032
  17. Table 17: Global Carbon Nanotubes Market Revenue Million Forecast, by Country 2019 & 2032
  18. Table 18: Global Carbon Nanotubes Market Volume K Tons Forecast, by Country 2019 & 2032
  19. Table 19: Germany Carbon Nanotubes Market Revenue (Million) Forecast, by Application 2019 & 2032
  20. Table 20: Germany Carbon Nanotubes Market Volume (K Tons) Forecast, by Application 2019 & 2032
  21. Table 21: France Carbon Nanotubes Market Revenue (Million) Forecast, by Application 2019 & 2032
  22. Table 22: France Carbon Nanotubes Market Volume (K Tons) Forecast, by Application 2019 & 2032
  23. Table 23: Italy Carbon Nanotubes Market Revenue (Million) Forecast, by Application 2019 & 2032
  24. Table 24: Italy Carbon Nanotubes Market Volume (K Tons) Forecast, by Application 2019 & 2032
  25. Table 25: United Kingdom Carbon Nanotubes Market Revenue (Million) Forecast, by Application 2019 & 2032
  26. Table 26: United Kingdom Carbon Nanotubes Market Volume (K Tons) Forecast, by Application 2019 & 2032
  27. Table 27: Netherlands Carbon Nanotubes Market Revenue (Million) Forecast, by Application 2019 & 2032
  28. Table 28: Netherlands Carbon Nanotubes Market Volume (K Tons) Forecast, by Application 2019 & 2032
  29. Table 29: Rest of Europe Carbon Nanotubes Market Revenue (Million) Forecast, by Application 2019 & 2032
  30. Table 30: Rest of Europe Carbon Nanotubes Market Volume (K Tons) Forecast, by Application 2019 & 2032
  31. Table 31: Global Carbon Nanotubes Market Revenue Million Forecast, by Country 2019 & 2032
  32. Table 32: Global Carbon Nanotubes Market Volume K Tons Forecast, by Country 2019 & 2032
  33. Table 33: China Carbon Nanotubes Market Revenue (Million) Forecast, by Application 2019 & 2032
  34. Table 34: China Carbon Nanotubes Market Volume (K Tons) Forecast, by Application 2019 & 2032
  35. Table 35: Japan Carbon Nanotubes Market Revenue (Million) Forecast, by Application 2019 & 2032
  36. Table 36: Japan Carbon Nanotubes Market Volume (K Tons) Forecast, by Application 2019 & 2032
  37. Table 37: India Carbon Nanotubes Market Revenue (Million) Forecast, by Application 2019 & 2032
  38. Table 38: India Carbon Nanotubes Market Volume (K Tons) Forecast, by Application 2019 & 2032
  39. Table 39: South Korea Carbon Nanotubes Market Revenue (Million) Forecast, by Application 2019 & 2032
  40. Table 40: South Korea Carbon Nanotubes Market Volume (K Tons) Forecast, by Application 2019 & 2032
  41. Table 41: Taiwan Carbon Nanotubes Market Revenue (Million) Forecast, by Application 2019 & 2032
  42. Table 42: Taiwan Carbon Nanotubes Market Volume (K Tons) Forecast, by Application 2019 & 2032
  43. Table 43: Australia Carbon Nanotubes Market Revenue (Million) Forecast, by Application 2019 & 2032
  44. Table 44: Australia Carbon Nanotubes Market Volume (K Tons) Forecast, by Application 2019 & 2032
  45. Table 45: Rest of Asia-Pacific Carbon Nanotubes Market Revenue (Million) Forecast, by Application 2019 & 2032
  46. Table 46: Rest of Asia-Pacific Carbon Nanotubes Market Volume (K Tons) Forecast, by Application 2019 & 2032
  47. Table 47: Global Carbon Nanotubes Market Revenue Million Forecast, by Country 2019 & 2032
  48. Table 48: Global Carbon Nanotubes Market Volume K Tons Forecast, by Country 2019 & 2032
  49. Table 49: Brazil Carbon Nanotubes Market Revenue (Million) Forecast, by Application 2019 & 2032
  50. Table 50: Brazil Carbon Nanotubes Market Volume (K Tons) Forecast, by Application 2019 & 2032
  51. Table 51: Argentina Carbon Nanotubes Market Revenue (Million) Forecast, by Application 2019 & 2032
  52. Table 52: Argentina Carbon Nanotubes Market Volume (K Tons) Forecast, by Application 2019 & 2032
  53. Table 53: Rest of South America Carbon Nanotubes Market Revenue (Million) Forecast, by Application 2019 & 2032
  54. Table 54: Rest of South America Carbon Nanotubes Market Volume (K Tons) Forecast, by Application 2019 & 2032
  55. Table 55: Global Carbon Nanotubes Market Revenue Million Forecast, by Country 2019 & 2032
  56. Table 56: Global Carbon Nanotubes Market Volume K Tons Forecast, by Country 2019 & 2032
  57. Table 57: Middle East Carbon Nanotubes Market Revenue (Million) Forecast, by Application 2019 & 2032
  58. Table 58: Middle East Carbon Nanotubes Market Volume (K Tons) Forecast, by Application 2019 & 2032
  59. Table 59: Africa Carbon Nanotubes Market Revenue (Million) Forecast, by Application 2019 & 2032
  60. Table 60: Africa Carbon Nanotubes Market Volume (K Tons) Forecast, by Application 2019 & 2032
  61. Table 61: Global Carbon Nanotubes Market Revenue Million Forecast, by Type 2019 & 2032
  62. Table 62: Global Carbon Nanotubes Market Volume K Tons Forecast, by Type 2019 & 2032
  63. Table 63: Global Carbon Nanotubes Market Revenue Million Forecast, by End-user Industry 2019 & 2032
  64. Table 64: Global Carbon Nanotubes Market Volume K Tons Forecast, by End-user Industry 2019 & 2032
  65. Table 65: Global Carbon Nanotubes Market Revenue Million Forecast, by Country 2019 & 2032
  66. Table 66: Global Carbon Nanotubes Market Volume K Tons Forecast, by Country 2019 & 2032
  67. Table 67: China Carbon Nanotubes Market Revenue (Million) Forecast, by Application 2019 & 2032
  68. Table 68: China Carbon Nanotubes Market Volume (K Tons) Forecast, by Application 2019 & 2032
  69. Table 69: India Carbon Nanotubes Market Revenue (Million) Forecast, by Application 2019 & 2032
  70. Table 70: India Carbon Nanotubes Market Volume (K Tons) Forecast, by Application 2019 & 2032
  71. Table 71: Japan Carbon Nanotubes Market Revenue (Million) Forecast, by Application 2019 & 2032
  72. Table 72: Japan Carbon Nanotubes Market Volume (K Tons) Forecast, by Application 2019 & 2032
  73. Table 73: South Korea Carbon Nanotubes Market Revenue (Million) Forecast, by Application 2019 & 2032
  74. Table 74: South Korea Carbon Nanotubes Market Volume (K Tons) Forecast, by Application 2019 & 2032
  75. Table 75: Rest of Asia Pacific Carbon Nanotubes Market Revenue (Million) Forecast, by Application 2019 & 2032
  76. Table 76: Rest of Asia Pacific Carbon Nanotubes Market Volume (K Tons) Forecast, by Application 2019 & 2032
  77. Table 77: Global Carbon Nanotubes Market Revenue Million Forecast, by Type 2019 & 2032
  78. Table 78: Global Carbon Nanotubes Market Volume K Tons Forecast, by Type 2019 & 2032
  79. Table 79: Global Carbon Nanotubes Market Revenue Million Forecast, by End-user Industry 2019 & 2032
  80. Table 80: Global Carbon Nanotubes Market Volume K Tons Forecast, by End-user Industry 2019 & 2032
  81. Table 81: Global Carbon Nanotubes Market Revenue Million Forecast, by Country 2019 & 2032
  82. Table 82: Global Carbon Nanotubes Market Volume K Tons Forecast, by Country 2019 & 2032
  83. Table 83: United States Carbon Nanotubes Market Revenue (Million) Forecast, by Application 2019 & 2032
  84. Table 84: United States Carbon Nanotubes Market Volume (K Tons) Forecast, by Application 2019 & 2032
  85. Table 85: Canada Carbon Nanotubes Market Revenue (Million) Forecast, by Application 2019 & 2032
  86. Table 86: Canada Carbon Nanotubes Market Volume (K Tons) Forecast, by Application 2019 & 2032
  87. Table 87: Mexico Carbon Nanotubes Market Revenue (Million) Forecast, by Application 2019 & 2032
  88. Table 88: Mexico Carbon Nanotubes Market Volume (K Tons) Forecast, by Application 2019 & 2032
  89. Table 89: Global Carbon Nanotubes Market Revenue Million Forecast, by Type 2019 & 2032
  90. Table 90: Global Carbon Nanotubes Market Volume K Tons Forecast, by Type 2019 & 2032
  91. Table 91: Global Carbon Nanotubes Market Revenue Million Forecast, by End-user Industry 2019 & 2032
  92. Table 92: Global Carbon Nanotubes Market Volume K Tons Forecast, by End-user Industry 2019 & 2032
  93. Table 93: Global Carbon Nanotubes Market Revenue Million Forecast, by Country 2019 & 2032
  94. Table 94: Global Carbon Nanotubes Market Volume K Tons Forecast, by Country 2019 & 2032
  95. Table 95: Germany Carbon Nanotubes Market Revenue (Million) Forecast, by Application 2019 & 2032
  96. Table 96: Germany Carbon Nanotubes Market Volume (K Tons) Forecast, by Application 2019 & 2032
  97. Table 97: United Kingdom Carbon Nanotubes Market Revenue (Million) Forecast, by Application 2019 & 2032
  98. Table 98: United Kingdom Carbon Nanotubes Market Volume (K Tons) Forecast, by Application 2019 & 2032
  99. Table 99: Italy Carbon Nanotubes Market Revenue (Million) Forecast, by Application 2019 & 2032
  100. Table 100: Italy Carbon Nanotubes Market Volume (K Tons) Forecast, by Application 2019 & 2032
  101. Table 101: France Carbon Nanotubes Market Revenue (Million) Forecast, by Application 2019 & 2032
  102. Table 102: France Carbon Nanotubes Market Volume (K Tons) Forecast, by Application 2019 & 2032
  103. Table 103: Spain Carbon Nanotubes Market Revenue (Million) Forecast, by Application 2019 & 2032
  104. Table 104: Spain Carbon Nanotubes Market Volume (K Tons) Forecast, by Application 2019 & 2032
  105. Table 105: Rest of Europe Carbon Nanotubes Market Revenue (Million) Forecast, by Application 2019 & 2032
  106. Table 106: Rest of Europe Carbon Nanotubes Market Volume (K Tons) Forecast, by Application 2019 & 2032
  107. Table 107: Global Carbon Nanotubes Market Revenue Million Forecast, by Type 2019 & 2032
  108. Table 108: Global Carbon Nanotubes Market Volume K Tons Forecast, by Type 2019 & 2032
  109. Table 109: Global Carbon Nanotubes Market Revenue Million Forecast, by End-user Industry 2019 & 2032
  110. Table 110: Global Carbon Nanotubes Market Volume K Tons Forecast, by End-user Industry 2019 & 2032
  111. Table 111: Global Carbon Nanotubes Market Revenue Million Forecast, by Country 2019 & 2032
  112. Table 112: Global Carbon Nanotubes Market Volume K Tons Forecast, by Country 2019 & 2032
  113. Table 113: Brazil Carbon Nanotubes Market Revenue (Million) Forecast, by Application 2019 & 2032
  114. Table 114: Brazil Carbon Nanotubes Market Volume (K Tons) Forecast, by Application 2019 & 2032
  115. Table 115: Argentina Carbon Nanotubes Market Revenue (Million) Forecast, by Application 2019 & 2032
  116. Table 116: Argentina Carbon Nanotubes Market Volume (K Tons) Forecast, by Application 2019 & 2032
  117. Table 117: Rest of South America Carbon Nanotubes Market Revenue (Million) Forecast, by Application 2019 & 2032
  118. Table 118: Rest of South America Carbon Nanotubes Market Volume (K Tons) Forecast, by Application 2019 & 2032
  119. Table 119: Global Carbon Nanotubes Market Revenue Million Forecast, by Type 2019 & 2032
  120. Table 120: Global Carbon Nanotubes Market Volume K Tons Forecast, by Type 2019 & 2032
  121. Table 121: Global Carbon Nanotubes Market Revenue Million Forecast, by End-user Industry 2019 & 2032
  122. Table 122: Global Carbon Nanotubes Market Volume K Tons Forecast, by End-user Industry 2019 & 2032
  123. Table 123: Global Carbon Nanotubes Market Revenue Million Forecast, by Country 2019 & 2032
  124. Table 124: Global Carbon Nanotubes Market Volume K Tons Forecast, by Country 2019 & 2032
  125. Table 125: Saudi Arabia Carbon Nanotubes Market Revenue (Million) Forecast, by Application 2019 & 2032
  126. Table 126: Saudi Arabia Carbon Nanotubes Market Volume (K Tons) Forecast, by Application 2019 & 2032
  127. Table 127: South Africa Carbon Nanotubes Market Revenue (Million) Forecast, by Application 2019 & 2032
  128. Table 128: South Africa Carbon Nanotubes Market Volume (K Tons) Forecast, by Application 2019 & 2032
  129. Table 129: Rest of Middle East and Africa Carbon Nanotubes Market Revenue (Million) Forecast, by Application 2019 & 2032
  130. Table 130: Rest of Middle East and Africa Carbon Nanotubes Market Volume (K Tons) Forecast, by Application 2019 & 2032


Frequently Asked Questions

1. What is the projected Compound Annual Growth Rate (CAGR) of the Carbon Nanotubes Market?

The projected CAGR is approximately 34.78%.

2. Which companies are prominent players in the Carbon Nanotubes Market?

Key companies in the market include Jiangsu Cnano Technology Co Ltd, Arkema, Meijo Nano Carbon, Raymor Industries Inc, Cabot Corporation, Nanocyl SA, Showa Denko KK (Resonac Holdings Corporation), Ocsial, Hyperion Catalysis International, LG Chem, Nano-C, CHASM, Chengdu Organic Chemicals Co Ltd (Timesnano), Kumho Petrochemical.

3. What are the main segments of the Carbon Nanotubes Market?

The market segments include Type, End-user Industry.

4. Can you provide details about the market size?

The market size is estimated to be USD 6.51 Million as of 2022.

5. What are some drivers contributing to market growth?

Growing Usage of Carbon Nantotubes in Electric Vehicles; Increasing Demand for Advance Materials in Numerous Applications.

6. What are the notable trends driving market growth?

Energy Segment to Dominate the Market.

7. Are there any restraints impacting market growth?

Environmental Concerns and Health Safety Issues; Other Restraints.

8. Can you provide examples of recent developments in the market?

May 2023: LG CHEM announced the construction of its fourth carbon nanotube (CNT) plant at Daesan, South Korea. The plant is slated for operation in 2025. Through the expansion, the company contributes to doubling LG Chem’s annual CNT production capability to 6,100 tons, strengthening its product portfolio.

9. What pricing options are available for accessing the report?

Pricing options include single-user, multi-user, and enterprise licenses priced at USD 4750, USD 5250, and USD 8750 respectively.

10. Is the market size provided in terms of value or volume?

The market size is provided in terms of value, measured in Million and volume, measured in K Tons.

11. Are there any specific market keywords associated with the report?

Yes, the market keyword associated with the report is "Carbon Nanotubes Market," which aids in identifying and referencing the specific market segment covered.

12. How do I determine which pricing option suits my needs best?

The pricing options vary based on user requirements and access needs. Individual users may opt for single-user licenses, while businesses requiring broader access may choose multi-user or enterprise licenses for cost-effective access to the report.

13. Are there any additional resources or data provided in the Carbon Nanotubes Market report?

While the report offers comprehensive insights, it's advisable to review the specific contents or supplementary materials provided to ascertain if additional resources or data are available.

14. How can I stay updated on further developments or reports in the Carbon Nanotubes Market?

To stay informed about further developments, trends, and reports in the Carbon Nanotubes Market, consider subscribing to industry newsletters, following relevant companies and organizations, or regularly checking reputable industry news sources and publications.


Methodology

Step 1 - Identification of Relevant Samples Size from Population Database

Step Chart
Bar Chart
Method Chart

Step 2 - Approaches for Defining Global Market Size (Value, Volume* & Price*)

Approach Chart
Top-down and bottom-up approaches are used to validate the global market size and estimate the market size for manufactures, regional segments, product, and application.

Note*: In applicable scenarios

Step 3 - Data Sources

Primary Research

  • Web Analytics
  • Survey Reports
  • Research Institute
  • Latest Research Reports
  • Opinion Leaders

Secondary Research

  • Annual Reports
  • White Paper
  • Latest Press Release
  • Industry Association
  • Paid Database
  • Investor Presentations
Analyst Chart

Step 4 - Data Triangulation

Involves using different sources of information in order to increase the validity of a study

These sources are likely to be stakeholders in a program - participants, other researchers, program staff, other community members, and so on.

Then we put all data in single framework & apply various statistical tools to find out the dynamic on the market.

During the analysis stage, feedback from the stakeholder groups would be compared to determine areas of agreement as well as areas of divergence

Additionally, after gathering mixed and scattered data from a wide range of sources, data is triangulated and correlated to come up with estimated figures which are further validated through primary mediums or industry experts, opinion leaders.

About Report Pinnacle

Report Pinnacle provides top-tier market research, industry intelligence, and actionable insights for finance, technology, healthcare, and consumer sectors. Our reports empower you to make informed decisions and achieve business success.

Our expert team combines primary research, data analytics, and industry knowledge to deliver insights you can trust. We offer syndicated reports, custom research, and consulting services tailored to your unique business needs.

At Report Pinnacle, we are committed to quality, transparency, and client satisfaction. Every report is rigorously validated to ensure accuracy and relevance. Our global perspective and local expertise help you understand both broad trends and detailed market shifts.

Stay ahead with Report Pinnacle. Subscribe to our newsletter for the latest insights and research highlights, and follow us on social media for real-time updates.

Report Pinnacle – Your Partner for Reaching the Top in Market Intelligence.

artwork spiralartwork spiralRelated Reports
artwork underline

Surfactants Market Report 2025: Growth Driven by Government Incentives and Partnerships

Discover the latest trends and growth opportunities in the booming surfactants market. This comprehensive analysis reveals key drivers, restraints, and regional market shares, along with projections to 2033. Explore market segmentation by type and application, and learn about leading companies shaping the future of this vital industry.

September 2025
Base Year: 2024
No Of Pages: 234
Price: $4750

Polyethyleneimine Market Market’s Consumer Preferences: Trends and Analysis 2025-2033

Discover the latest trends and insights into the Polyethyleneimine (PEI) market, projected to reach [estimated 2033 value based on CAGR] by 2033. This comprehensive analysis covers market size, CAGR, regional breakdowns (North America, Europe, Asia-Pacific), key applications (water treatment, adhesives), and leading companies. Learn more about this growing market and its future potential.

September 2025
Base Year: 2024
No Of Pages: 234
Price: $4750

Growth Roadmap for Resorbable Polymers Market Market 2025-2033

The resorbable polymers market is booming, projected to exceed $5 billion by 2033, driven by advancements in drug delivery and orthopedics. Explore key trends, leading companies, and regional growth forecasts in this comprehensive market analysis.

September 2025
Base Year: 2024
No Of Pages: 180
Price: $4750

Engineering Plastic Industry Comprehensive Market Study: Trends and Predictions 2025-2033

Discover the booming engineering plastics market! This comprehensive analysis explores key trends, growth drivers, and restraints impacting the industry, segmented by resin type and end-user. Learn about leading companies and regional market share projections for 2025-2033.

September 2025
Base Year: 2024
No Of Pages: 197
Price: $3800

Seals Industry 2025-2033 Overview: Trends, Competitor Dynamics, and Opportunities

The global seals industry is booming, projected to reach [estimated 2033 market size] by 2033 with a CAGR exceeding 4%. Discover key market trends, regional insights, leading companies (Trelleborg, Freudenberg, SKF), and the impact of automotive, oil & gas, and industrial automation on this dynamic sector.

September 2025
Base Year: 2024
No Of Pages: 150
Price: $4750

High Performance Foam Market Market’s Consumer Preferences: Trends and Analysis 2025-2033

Discover the booming high-performance foam market, projected to reach $XX billion by 2033 with a CAGR exceeding 8%. This in-depth analysis covers market drivers, trends, restraints, segmentation (silicone, polyurethane, etc.), key players (Solvay, 3M, BASF), and regional growth. Explore the future of high-performance foams in construction, transportation, and healthcare.

September 2025
Base Year: 2024
No Of Pages: 150
Price: $4750

Charting Thin Insulation Market Growth: CAGR Projections for 2025-2033

Discover the booming thin insulation market! This comprehensive analysis reveals a CAGR >5%, driven by energy efficiency mandates & advancements in aerogels & plastic foams. Explore market size, segmentation, key players (Dow, BASF, 3M), and regional trends through 2033.

September 2025
Base Year: 2024
No Of Pages: 234
Price: $4750

Exploring United States Non-Woven Fabric Market Market Disruption and Innovation

Discover the booming US non-woven fabric market! Explore key drivers, trends, and restraints shaping this $10 Billion+ industry (2025 est.), including insights into spunbond, polyester, and polypropylene segments. Learn about major players and future growth projections through 2033.

September 2025
Base Year: 2024
No Of Pages: 150
Price: $3800

Proppants Industry Comprehensive Market Study: Trends and Predictions 2025-2033

Discover the booming proppants market analysis for 2025-2033. This in-depth report reveals key trends, CAGR projections, and regional market share for proppants used in hydraulic fracturing, offering valuable insights for investors and industry professionals. Explore the impact of oil prices, technological advancements, and environmental regulations.

September 2025
Base Year: 2024
No Of Pages: 234
Price: $4750

United Arab Emirates Protective Coatings Market Future-proof Strategies: Trends, Competitor Dynamics, and Opportunities 2025-2033

The UAE protective coatings market is booming, projected to surpass $83 million by 2033, driven by infrastructure development and technological advancements. Discover key trends, market segmentation, and leading players in this lucrative sector. Explore growth opportunities in waterborne, epoxy, and polyurethane coatings for oil & gas, construction, and power industries.

September 2025
Base Year: 2024
No Of Pages: 180
Price: $3800

Exploring Growth Patterns in Germany Water Treatment Market Market

Discover the booming German water treatment market! Explore key trends, drivers, and restraints shaping this €[estimated value] industry, projected to grow at a CAGR exceeding 4% until 2033. Learn about leading companies and key segments.

September 2025
Base Year: 2024
No Of Pages: 197
Price: $3800

Specialty Gas Market: Harnessing Emerging Innovations for Growth 2025-2033

The specialty gas market is booming, projected to exceed a 4% CAGR through 2033, driven by electronics, automotive, and healthcare advancements. This comprehensive analysis explores market size, key players (Air Products, Linde, Air Liquide), regional trends, and future growth opportunities in high-purity gases, noble gases, and more.

September 2025
Base Year: 2024
No Of Pages: 180
Price: $4750

GCC Cement Market XX CAGR Growth Analysis 2025-2033

The GCC cement market is booming, with a CAGR exceeding 4.5% through 2033. Driven by massive infrastructure projects and urbanization, this report analyzes market size, segmentation (Portland, blended, residential, commercial), key players (Cemex, Holcim), and regional trends in Saudi Arabia, UAE, Qatar, Oman, Kuwait, and Bahrain. Discover growth opportunities in this dynamic market.

September 2025
Base Year: 2024
No Of Pages: 234
Price: $4750

Car Oil in Spain Market Market Overview: Growth and Insights

Discover the latest insights into the dynamic Spanish car oil market. Explore market size, growth trends (CAGR 2.08%), key players (Castrol, Shell, Repsol), and future projections to 2033. Learn about the impact of consumer behavior, economic factors, and environmental regulations on this competitive sector.

September 2025
Base Year: 2024
No Of Pages: 197
Price: $3800

BTX Industry Decade Long Trends, Analysis and Forecast 2025-2033

The BTX market (Benzene, Toluene, Xylene) is booming, with a CAGR exceeding 4% and projected to reach $XX million by 2033. Driven by rising petrochemical demand and economic growth in Asia-Pacific, this detailed analysis explores market trends, key players (Shell, ExxonMobil, Sinopec), and regional growth forecasts. Discover insights into BTX applications, segment performance, and future market potential.

September 2025
Base Year: 2024
No Of Pages: 234
Price: $4750

Anhydrous AlCl3 Market Innovations Shaping Market Growth 2025-2033

Discover the booming anhydrous aluminum chloride market! Explore key drivers, trends, and restraints impacting this $1.5B+ market, segmented by form (powder, granules, crystals) and application (pharmaceuticals, pesticides, more). Learn about leading companies and regional growth projections through 2033.

September 2025
Base Year: 2024
No Of Pages: 234
Price: $4750

Argentina Passenger Vehicles Lubricants Market Insights: Market Size Analysis to 2033

Discover the latest insights into Argentina's passenger vehicle lubricants market. This comprehensive analysis reveals a steady growth trajectory (CAGR 2.51%), driven by automotive industry expansion and consumer demand. Explore market segmentation, key players, and future growth projections (2025-2033).

September 2025
Base Year: 2024
No Of Pages: 197
Price: $3800

Exploring Barriers in Dry Mix Mortar Market Market: Trends and Analysis 2025-2033

Discover the booming Dry Mix Mortar market! Explore key trends, growth drivers, and competitive landscape analysis from 2019-2033. Learn about regional market share, leading companies (Holcim, Sika, etc.), and the impact of sustainability. Invest in future-proof construction materials.

September 2025
Base Year: 2024
No Of Pages: 180
Price: $3800

Germany Automotive Engine Oil Industry: Disruptive Technologies Driving Market Growth 2025-2033

Discover the latest trends and insights into the booming German automotive engine oil market. Explore market size, growth projections (CAGR 1.29%), key players (Castrol, Chevron, ExxonMobil), and future opportunities within this €1.5 billion industry. Learn about segment performance and the impact of new technologies.

September 2025
Base Year: 2024
No Of Pages: 197
Price: $3800

North America Compressor Oil Market Market Expansion Strategies

The North American compressor oil market is poised for steady growth, driven by industrial expansion and technological advancements. Learn about market size, CAGR, key players, and future trends in this comprehensive analysis. Discover insights into the segmentation by base oil type and end-user industries.

September 2025
Base Year: 2024
No Of Pages: 180
Price: $4750

Water-borne Adhesives Market Market Expansion Strategies

Discover the booming water-borne adhesives market, projected to exceed a 5% CAGR through 2033. This comprehensive analysis explores market size, key drivers (sustainability, innovation), restraints, regional trends (Asia-Pacific leading the charge), and leading companies. Learn about the expanding applications across building & construction, packaging, and more.

September 2025
Base Year: 2024
No Of Pages: 150
Price: $4750

Europe Gypsum Board Market Comprehensive Market Study: Trends and Predictions 2025-2033

Discover the booming European gypsum board market! This in-depth analysis reveals a CAGR exceeding 5%, driven by construction growth and sustainability trends. Explore key players, regional breakdowns, and future forecasts for 2025-2033. Learn about market segments, drivers, and restraints impacting wall board, ceiling board, and pre-decorated board sales.

September 2025
Base Year: 2024
No Of Pages: 234
Price: $4750

Strategic Insights for SCC Market Market Growth

Discover the booming Self-Consolidating Concrete (SCC) market! Explore its 5%+ CAGR, key drivers like infrastructure development & precast concrete, and leading players like UltraTech & LafargeHolcim. This in-depth analysis forecasts market trends to 2033, covering regional breakdowns and key applications.

September 2025
Base Year: 2024
No Of Pages: 234
Price: $4750

Future-Ready Strategies for Epoxy Powder Coatings Market Market Growth

Discover the booming epoxy powder coatings market! This comprehensive analysis reveals key trends, drivers, and restraints shaping the industry's growth through 2033, including regional insights and leading companies. Explore market size, CAGR, and segmentation data for protective coatings, automotive, aerospace, and construction applications.

September 2025
Base Year: 2024
No Of Pages: 234
Price: $4750

India Floor Coatings Market Market Predictions and Opportunities 2025-2033

Discover the booming India floor coatings market! This comprehensive analysis reveals a ₹14940 million market in 2025, projecting a CAGR exceeding 7% through 2033. Explore key drivers, trends, and segmentation data including epoxy, polyurethane, and other coatings across residential, commercial, and industrial sectors. Learn about leading players like Asian Paints and Sherwin-Williams.

September 2025
Base Year: 2024
No Of Pages: 180
Price: $3800

Strategic Vision for Middle-East and Africa Thermal Spray Market Industry Trends

The Middle East & Africa thermal spray market is booming, projected to reach \$16.54 billion by 2033, driven by aerospace, automotive, and energy sectors. Discover key trends, restraints, and leading companies shaping this high-growth market.

September 2025
Base Year: 2024
No Of Pages: 180
Price: $4750

Opportunities in Ion Exchange Membrane Market Market 2025-2033

The global ion exchange membrane market is booming, driven by water treatment, renewable energy, and battery technology advancements. Explore market size, CAGR, key players, and regional trends in this comprehensive analysis projecting to 2033. Discover lucrative investment opportunities in this rapidly expanding sector.

September 2025
Base Year: 2024
No Of Pages: 150
Price: $4750

Unlocking the Future of APAC Paints & Coatings Additives Industry: Growth and Trends 2025-2033

Discover the booming APAC paints & coatings additives market! This in-depth analysis reveals a CAGR exceeding 6%, driven by construction, automotive, and sustainability trends. Learn about key players, regional breakdowns (China, India, Japan, etc.), and future growth projections to 2033.

September 2025
Base Year: 2024
No Of Pages: 180
Price: $4750

C9 Resin Market CAGR Growth Drivers and Trends: Forecasts 2025-2033

Discover the booming C9 resin market! Explore our comprehensive analysis projecting significant growth through 2033, driven by key applications and technological advancements. Learn about market size, CAGR, and regional trends in this detailed report.

September 2025
Base Year: 2024
No Of Pages: 180
Price: $4750

Analyzing Competitor Moves: Brazil Bioplastics Market Growth Outlook 2025-2033

Discover the booming Brazil bioplastics market! This comprehensive analysis reveals a CAGR of 12.80%, driven by sustainability concerns and government initiatives. Explore market size, key players (Novamont, Arkema, Braskem), segments, and future trends in bio-based biodegradable and non-biodegradable plastics in Brazil (2019-2033).

September 2025
Base Year: 2024
No Of Pages: 120
Price: $3800

Dry Mix Mortar Additives and Chemicals Market Industry Growth Trends and Analysis

Discover the booming Dry Mix Mortar Additives & Chemicals market! This comprehensive analysis reveals a CAGR of 4.52%, driven by construction growth and sustainable building trends. Explore market segmentation, key players (Nouryon, BASF, Sika), and regional insights (Asia-Pacific leading). Project your business strategy with our detailed forecast to 2033.

September 2025
Base Year: 2024
No Of Pages: 150
Price: $4750

Market Deep Dive: Exploring Betaine Market Trends 2025-2033

Discover the booming Betaine Market analysis! Explore key trends, drivers, and restraints impacting this $XX million industry, featuring insights on Betaine Anhydrous, Monohydrate, and HCl forms, across food, animal feed, and personal care applications. Growth projections to 2033 reveal lucrative investment opportunities.

August 2025
Base Year: 2024
No Of Pages: 150
Price: $4750

Acetylene Industry Market Report: Trends and Growth

Discover the latest insights into the $11.38B Acetylene market. Explore growth drivers, regional trends (Asia Pacific leading), key players (Linde, Air Products), and future forecasts (2.54% CAGR) to 2033. Understand the impact of metal working, chemical applications, and emerging technologies on this vital industry.

August 2025
Base Year: 2024
No Of Pages: 180
Price: $4750

Norway Lubricants Market in Developing Economies: Trends and Growth Analysis 2025-2033

Discover the latest insights into the Norway lubricants market. This comprehensive analysis reveals steady growth driven by automotive, marine, and industrial sectors, alongside market trends, key players (BP Castrol, ExxonMobil, Shell), and future projections to 2033. Explore market size, CAGR, and regional dynamics.

August 2025
Base Year: 2024
No Of Pages: 197
Price: $3800

South Korea Passenger Vehicles Lubricants Market Market’s Tech Revolution: Projections to 2033

Discover the booming South Korea passenger vehicle lubricants market! This in-depth analysis reveals a $250 million market in 2025, projected to reach over $350 million by 2033, driven by increasing vehicle numbers and demand for high-performance lubricants. Explore market trends, key players (ExxonMobil, Shell, Castrol, GS Caltex), and growth opportunities.

August 2025
Base Year: 2024
No Of Pages: 180
Price: $3800

Isophthalic Acid Industry Market Report: Trends and Growth

Discover the booming Isophthalic Acid market! This comprehensive analysis reveals a CAGR exceeding 4%, driven by PET packaging, construction, and technological advancements. Explore regional trends, key players (Shell, Honeywell, etc.), and future growth projections for the period 2025-2033. Get insights into market segmentation and key challenges.

August 2025
Base Year: 2024
No Of Pages: 180
Price: $4750

Ferroboron Market Charting Growth Trajectories 2025-2033: Strategic Insights and Forecasts

The Ferroboron Market is booming, with a CAGR exceeding 5.50% through 2033. Driven by automotive, construction, and steel advancements, this report analyzes market size, regional shares (North America, Europe, Asia-Pacific), key players (AMPERRE alloys, CRONIMET), and future trends. Discover insights into this high-growth sector.

August 2025
Base Year: 2024
No Of Pages: 234
Price: $4750

Unlocking Insights for Green Hydrogen Market Growth Strategies

The green hydrogen market is booming, with a CAGR exceeding 60% and a projected value of $3.28 billion in 2025. Learn about key drivers, trends, restraints, and regional market share in this comprehensive analysis, covering major players and future forecasts to 2033. Discover the opportunities and challenges in this rapidly expanding sector of the renewable energy market.

August 2025
Base Year: 2024
No Of Pages: 180
Price: $4750

Carbon Fiber Market Market Analysis and Forecasts

The global carbon fiber market is booming, projected to reach $42.9 Billion by 2033 with a 10.05% CAGR. Driven by aerospace, renewable energy, and automotive sectors, this detailed market analysis explores key trends, restraints, and leading companies shaping this high-growth industry.

August 2025
Base Year: 2024
No Of Pages: 234
Price: $4750

Deep Dive into Bromine Industry: Comprehensive Growth Analysis 2025-2033

Discover the booming bromine market forecast to 2033! This in-depth analysis reveals a CAGR of 5%, driven by flame retardants, biocides, and energy storage. Explore key players, regional trends, and market segmentation for organobromines, bromide salts, and more. Get your free market report now!

August 2025
Base Year: 2024
No Of Pages: 180
Price: $3,950

Future Trends Shaping Viscosity Reducing Agents Market Growth

Discover the booming viscosity reducing agents market! Our comprehensive analysis reveals a CAGR of 5.68% to 2033, driven by oil & gas, paints & coatings, and plastics industries. Explore key players, regional trends, and future growth projections in this detailed market report.

August 2025
Base Year: 2024
No Of Pages: 180
Price: $3,950

Europe Protective Coatings Market Projected to Grow at XX CAGR: Insights and Forecasts 2025-2033

The European Protective Coatings Market is booming, projected to surpass €20 billion by 2033, driven by infrastructure growth and eco-friendly regulations. Explore market trends, key players (Akzo Nobel, BASF, PPG), and regional analysis in this comprehensive report.

August 2025
Base Year: 2024
No Of Pages: 180
Price: $4750

Emerging Markets for Indonesia Lubricant Market Industry

Discover the booming Indonesian lubricant market forecast to 2033! This in-depth analysis reveals market size, CAGR, key drivers, trends, restraints, and leading companies like Castrol and Shell. Explore regional breakdowns and future growth opportunities in this dynamic sector.

August 2025
Base Year: 2024
No Of Pages: 197
Price: $3800

Exploring Ethyl Levulinate Market Market Ecosystem: Insights to 2033

Discover the booming Ethyl Levulinate market! This comprehensive analysis reveals a CAGR exceeding 3%, driven by soaring demand in food, fragrance, and pharmaceutical applications. Explore market size, key players, regional trends, and future growth projections from 2025-2033.

August 2025
Base Year: 2024
No Of Pages: 234
Price: $4750

Aramid Fiber Market Market Report: Trends and Growth

Discover the booming aramid fiber market! This comprehensive analysis reveals a CAGR exceeding 4%, driven by aerospace, automotive, and construction sectors. Explore market trends, key players (DuPont, Teijin, Kolon), and future growth projections for 2025-2033. Learn about regional market shares and emerging opportunities in this high-growth industry.

August 2025
Base Year: 2024
No Of Pages: 234
Price: $4750

Diamond Wire Market Future-Proof Strategies: Market Trends 2025-2033

Discover the booming diamond wire market! This comprehensive analysis reveals a CAGR exceeding 10%, driven by solar, semiconductor, and construction applications. Explore market trends, key players (Dellas S p A, Logomatic GmbH, etc.), and regional insights (Asia Pacific leading) for the period 2019-2033. Get your free report now!

August 2025
Base Year: 2024
No Of Pages: 234
Price: $4750

Europe Automotive Coatings Market Market’s Decade-Long Growth Trends and Future Projections 2025-2033

Discover the latest insights into the booming European automotive coatings market. This comprehensive analysis reveals a €4.96 billion market in 2025, projected to grow at a 3% CAGR until 2033, driven by factors like increasing vehicle production and demand for sustainable coatings. Explore market trends, key players (Sherwin-Williams, PPG, BASF), and regional variations impacting this dynamic sector.

August 2025
Base Year: 2024
No Of Pages: 180
Price: $4750

Emerging Markets Driving Bulgaria Passenger Vehicles Lubricants Market Growth

Discover the growth potential of the Bulgarian passenger vehicle lubricants market. This comprehensive analysis reveals market size, CAGR, key players (ExxonMobil, Shell, Castrol, Motul etc.), market trends, and future projections through 2033. Learn about the leading segments (engine oils, greases, etc.) and unlock valuable insights for investment and business strategies.

August 2025
Base Year: 2024
No Of Pages: 180
Price: $3800

Opacifiers Market Market Growth Fueled by CAGR to XXX Million by 2033

Discover the booming opacifiers market! This in-depth analysis reveals a $XX million market with a 4%+ CAGR, driven by construction, paints & coatings, and personal care. Explore key trends, regional insights, and leading companies like Tronox and Kronos.

August 2025
Base Year: 2024
No Of Pages: 150
Price: $4750

Brazil Lubricants Industry 2025-2033 Trends and Competitor Dynamics: Unlocking Growth Opportunities

Discover the dynamic Brazil lubricants market. This in-depth analysis reveals key trends, growth drivers, and challenges for 2025-2033, highlighting leading companies and regional market share. Explore the opportunities and risks in this expanding $5 billion market.

August 2025
Base Year: 2024
No Of Pages: 197
Price: $3800

Business Address

Head Office

Ansec House 3 rd floor Tank Road, Yerwada, Pune, Maharashtra 411014

Contact Information

Craig Francis

Business Development Head

+17162654855

[email protected]

Secure Payment Partners

payment image
RetailLogisticsPackagingAutomotiveHealthcareAgricultureEnergy & PowerFood & BeverageAerospace & DefenseChemicals & MaterialsHospitality and TourismAnimal Nutrition & WellnessConsumer Goods and ServicesReal Estate and ConstructionHome and Property ImprovementTechnology, Media and TelecomManufacturing Products and ServicesFinancial Services and Investment Intelligence

© 2025 PRDUA Research & Media Private Limited, All rights reserved

Privacy Policy
Terms and Conditions
FAQ
  • Home
  • About Us
  • Industries
    • Aerospace & Defense
    • Agriculture
    • Animal Nutrition & Wellness
    • Automotive
    • Chemicals & Materials
    • Consumer Goods and Services
    • Energy & Power
    • Financial Services and Investment Intelligence
    • Food & Beverage
    • Home and Property Improvement
    • Hospitality and Tourism
    • Logistics
    • Manufacturing Products and Services
    • Packaging
    • Professional and Commercial Services
    • Real Estate and Construction
    • Retail
    • Technology, Media and Telecom
    • Healthcare
  • Services
  • Contact
Main Logo
  • Home
  • About Us
  • Industries
    • Aerospace & Defense
    • Agriculture
    • Animal Nutrition & Wellness
    • Automotive
    • Chemicals & Materials
    • Consumer Goods and Services
    • Energy & Power
    • Financial Services and Investment Intelligence
    • Food & Beverage
    • Home and Property Improvement
    • Hospitality and Tourism
    • Logistics
    • Manufacturing Products and Services
    • Packaging
    • Professional and Commercial Services
    • Real Estate and Construction
    • Retail
    • Technology, Media and Telecom
    • Healthcare
  • Services
  • Contact
+17162654855
[email protected]

+17162654855

[email protected]