

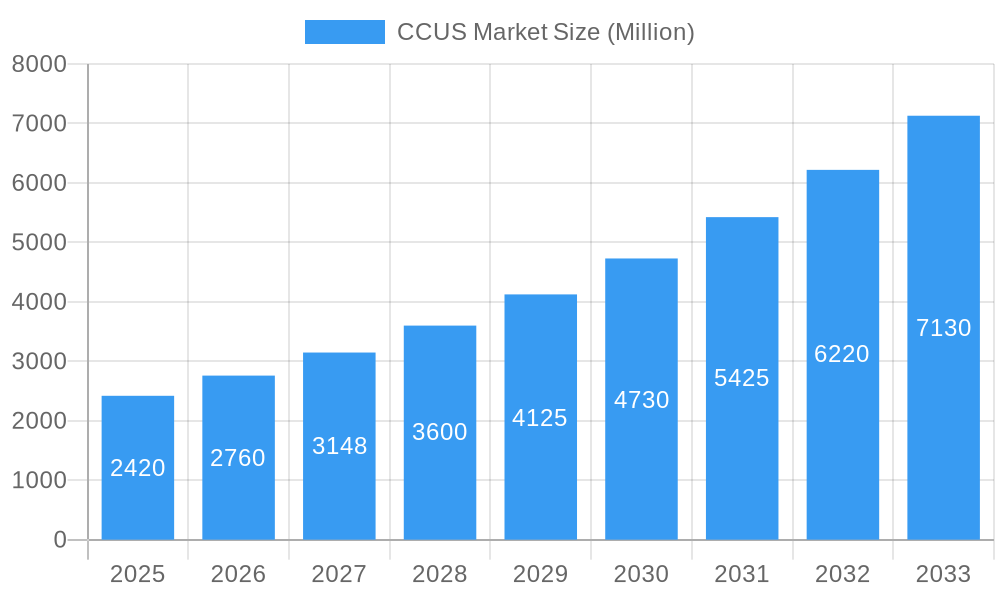
Key Insights
The Carbon Capture, Utilization, and Storage (CCUS) market is experiencing robust growth, projected to reach \$2.42 billion in 2025 and expand at a Compound Annual Growth Rate (CAGR) of 14.21% from 2025 to 2033. This expansion is driven by increasing global efforts to mitigate climate change and meet stringent emission reduction targets. Government regulations promoting carbon capture technologies, coupled with rising investments in renewable energy infrastructure, are key catalysts. The significant demand from energy-intensive industries like oil and gas, power generation (coal and biomass), iron and steel, chemicals, and cement is fueling market growth. Technological advancements in pre-combustion, oxy-fuel combustion, and post-combustion capture methods are also contributing factors. The North American market, particularly the United States, holds a substantial share due to significant government support and the presence of major industry players. Competitive landscape analysis reveals key players such as Occidental Petroleum, Linde PLC, Shell PLC, and others actively investing in research and development, mergers and acquisitions, and strategic partnerships to strengthen their market position. The ongoing development of cost-effective and efficient CCUS technologies will further accelerate market adoption.
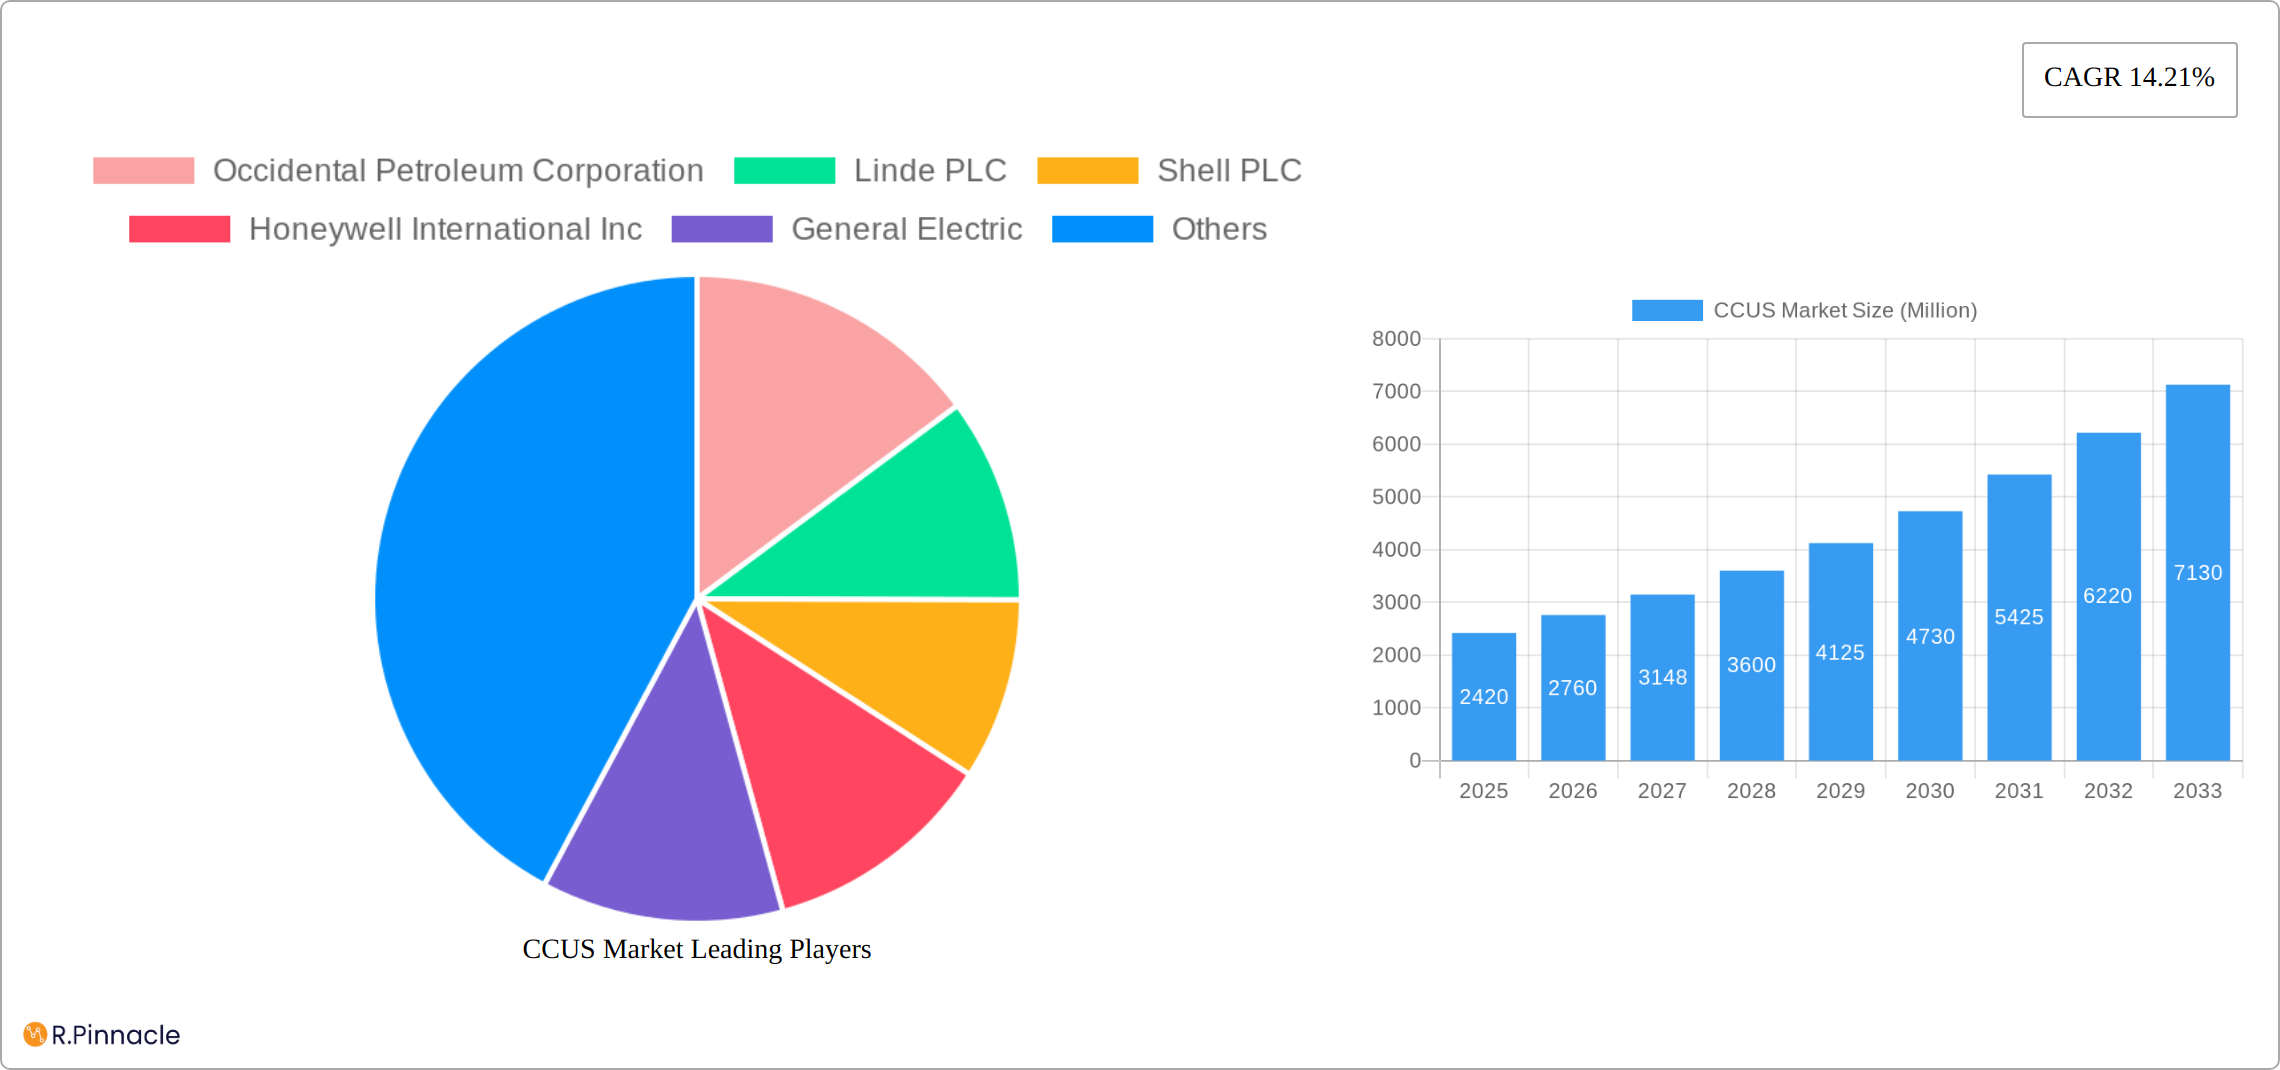
CCUS Market Market Size (In Billion)
Despite the positive outlook, challenges remain. High capital expenditure and operational costs associated with CCUS implementation are major restraints, hindering wider adoption, particularly in smaller companies or developing economies. Furthermore, technological limitations and the need for robust infrastructure to support CO2 transportation and storage pose obstacles to market expansion. However, ongoing research and development efforts, coupled with supportive government policies and increasing industry collaboration, are expected to overcome these challenges gradually, leading to sustained market growth in the forecast period. The development of CCUS projects will increasingly focus on carbon utilization opportunities, creating additional revenue streams and further encouraging market development.
CCUS Market Company Market Share
CCUS Market: A Comprehensive Report (2019-2033)
This in-depth report provides a comprehensive analysis of the Carbon Capture, Utilization, and Storage (CCUS) market, offering invaluable insights for industry professionals, investors, and policymakers. Covering the period from 2019 to 2033, with a focus on 2025, this report analyzes market dynamics, technological advancements, and key players shaping this crucial sector in the fight against climate change. The report projects a market valued at xx Million by 2033, with a CAGR of xx% during the forecast period (2025-2033).
CCUS Market Structure & Innovation Trends
The CCUS market exhibits a moderately concentrated structure, with key players like Occidental Petroleum Corporation, Linde PLC, Shell PLC, and Honeywell International Inc. holding significant market share. However, the market is dynamic, with ongoing M&A activity and the emergence of innovative technologies driving competition. Market share data for 2024 reveals that the top 5 companies hold approximately xx% of the market. Recent M&A deals, while not publicly disclosed in their entirety, have involved significant investments totaling an estimated xx Million in 2023 and are expected to continue growing in 2024.
- Market Concentration: Moderately concentrated, with several major players dominating.
- Innovation Drivers: Stringent environmental regulations, advancements in capture technologies, and the growing need for carbon emission reduction.
- Regulatory Frameworks: Vary across regions, impacting investment decisions and project feasibility.
- Product Substitutes: Limited effective substitutes currently exist for CCUS in large-scale carbon emissions reduction.
- End-user Demographics: Primarily dominated by the Oil & Gas, Power Generation, and Industrial sectors.
- M&A Activities: Significant investment and consolidation are shaping the market landscape, driving innovation and scale.
CCUS Market Dynamics & Trends
The CCUS market is experiencing rapid growth, driven by increasing global concerns about climate change and the tightening regulatory landscape. Governments worldwide are implementing stricter emission reduction targets, fueling demand for effective carbon capture solutions. Technological advancements, such as improved capture efficiency and reduced costs, are further accelerating market expansion. Consumer preferences for environmentally sustainable products and services are also indirectly driving growth. Competitive dynamics are characterized by ongoing innovation, strategic partnerships, and M&A activities among major players. Market penetration is currently at xx% in key regions and is projected to reach xx% by 2033.
Dominant Regions & Segments in CCUS Market
The North American and European regions currently dominate the CCUS market, driven by robust government support, established infrastructure, and the presence of major industry players. Within these regions, the Oil and Gas sector is the largest end-user industry segment. Post-combustion capture technology currently holds the largest market share due to its wider applicability.
Key Drivers by Region/Segment:
- North America (US and Canada): Strong government incentives, existing infrastructure, and significant Oil & Gas activity.
- Europe: Stringent environmental regulations, substantial investments in CCS projects, and technological advancements.
- Asia-Pacific: Emerging market with growing demand and significant potential, particularly in China and Japan.
Dominant Segments:
- By End-user Industry: Oil and Gas is the leading segment due to high emissions and established infrastructure.
- By Technology: Post-combustion capture currently dominates due to its versatility.
CCUS Market Product Innovations
Recent innovations in CCUS technology focus on improving capture efficiency, reducing operational costs, and expanding the range of applications. New materials, advanced separation processes, and integrated solutions are enhancing the economic viability and environmental performance of CCUS systems. The market is witnessing the emergence of integrated solutions that combine different technologies to optimize carbon capture, utilization, and storage.
Report Scope & Segmentation Analysis
This report segments the CCUS market by end-user industry (Oil and Gas, Coal and Biomass Power Plant, Iron and Steel, Chemical, Cement) and technology (Pre-combustion Capture, Oxy-fuel Combustion Capture, Post-combustion Capture). Each segment’s growth projections, market size estimations (in Millions), and competitive landscape are analyzed in detail, providing a comprehensive overview of the market's structure and dynamics. Growth projections vary significantly across segments, with Oil & Gas and Post-combustion Capture exhibiting the highest anticipated growth rates.
Key Drivers of CCUS Market Growth
Several factors are converging to propel the rapid expansion of the CCUS market. These include a confluence of stringent environmental regulations, substantial government incentives, and accelerating technological advancements. Let's examine these key drivers in more detail:
- Stringent Environmental Regulations and Policies: Globally, governments are implementing increasingly stringent regulations and carbon pricing mechanisms to curb greenhouse gas emissions. This regulatory pressure creates a compelling business case for CCUS adoption, making it a necessity for many industries to meet compliance targets and avoid penalties.
- Robust Government Incentives and Subsidies: Recognizing the crucial role of CCUS in mitigating climate change, many governments worldwide are offering significant financial support, including tax credits, grants, and direct subsidies, to incentivize CCUS project development and deployment. This financial backing significantly reduces the financial burden and risk associated with these large-scale projects.
- Technological Advancements and Cost Reductions: Continuous innovation is driving down the cost and improving the efficiency of carbon capture, utilization, and storage technologies. Advances in materials science, process engineering, and data analytics are leading to more cost-effective and scalable CCUS solutions.
- Growing Awareness of Climate Change and Corporate Sustainability Initiatives: The escalating awareness of climate change among the public and the increasing corporate commitment to sustainability goals are driving demand for CCUS solutions. Companies are actively seeking ways to reduce their carbon footprint and demonstrate their commitment to environmental responsibility, positioning CCUS as a vital tool in their sustainability strategies.
Challenges in the CCUS Market Sector
Despite the considerable growth potential, the CCUS market faces several significant hurdles that need to be addressed for widespread adoption. These challenges include:
- High Capital Expenditures and Long Project Lead Times: The initial investment required for CCUS projects is substantial, requiring significant upfront capital expenditure. Moreover, the complex nature of these projects often results in lengthy lead times before becoming operational.
- Technological Limitations and Scalability Issues: While technology is advancing rapidly, some CCUS technologies still require further development and optimization to achieve higher capture rates, lower operating costs, and improved scalability for widespread deployment.
- Regulatory Uncertainty and Policy Inconsistencies: Inconsistencies and uncertainties in regulations across different jurisdictions pose a significant challenge. A harmonized and predictable regulatory framework is crucial to attract investment and facilitate cross-border collaboration.
- Public Perception, Acceptance, and Risk Mitigation: Addressing public concerns regarding the safety and environmental impacts of CO2 storage is paramount for the successful deployment of CCUS projects. Transparent communication and robust risk assessment are essential to build public trust and acceptance.
Emerging Opportunities in CCUS Market
Beyond the core technologies, several emerging opportunities are creating new avenues for growth and innovation within the CCUS market:
- Carbon Capture Utilization (CCU): Transforming captured CO2 into valuable products, such as fuels, chemicals, and building materials, offers a pathway to create economic value while mitigating emissions. This approach is shifting the perception of CCUS from purely a cost to a potential revenue stream.
- Enhanced Oil Recovery (EOR): Injecting captured CO2 into depleted oil reservoirs enhances oil production while permanently storing the CO2 underground. This synergistic approach offers economic benefits while contributing to emission reduction.
- Expanding into Developing Economies: Developing economies with rapidly growing industrial sectors represent a significant market opportunity for CCUS deployment. Supporting these regions in adopting clean energy technologies while accelerating their industrial development will be critical.
- Innovative Financing Mechanisms and Public-Private Partnerships: Exploring innovative financing models, including carbon credits, blended finance, and public-private partnerships, is crucial to mobilize the substantial investment required for large-scale CCUS deployment.
Leading Players in the CCUS Market Market
- Occidental Petroleum Corporation
- Linde PLC
- Shell PLC
- Honeywell International Inc
- General Electric
- Exxon Mobil Corporation
- Japan CCS Co Ltd
- SLB
- Fluor Corporation
- Baker Hughes Company
- Halliburton
- Aker Solutions
- Dakota Gasification Company
- JX Nippon Oil & Gas Exploration Corporation
- Siemens Energy
- Air Liquide
- Mitsubishi Heavy Industries Ltd
Key Developments in CCUS Market Industry
- March 2024: JX Nippon Oil & Gas Exploration Corporation and Chevron New Energies signed an MoU to explore CO2 export from Japan to Asia-Pacific CCS initiatives.
- March 2024: Shell and ONGC collaborated on a storage study and enhanced oil recovery (EOR) assessment in India.
- February 2024: Fluor Corporation and Chevron New Energies signed a license agreement for Fluor's Econamine FG PlusSM carbon capture technology. These developments showcase the increasing collaborations and investments in the CCUS sector.
Future Outlook for CCUS Market Market
The future of the CCUS market is bright, driven by continued technological advancements, supportive government policies, and growing corporate commitments to sustainability. The market is expected to experience significant expansion in the coming years, driven by the increasing urgency to mitigate climate change. Strategic partnerships and investments in research and development will play a crucial role in unlocking the full potential of CCUS technologies.
CCUS Market Segmentation
-
1. Technology
- 1.1. Pre-combustion Capture
- 1.2. Oxy-fuel Combustion Capture
- 1.3. Post-combustion Capture
-
2. End-user Industry
- 2.1. Oil and Gas
- 2.2. Coal and Biomass Power Plant
- 2.3. Iron and Steel
- 2.4. Chemical
- 2.5. Cement
CCUS Market Segmentation By Geography
-
1. Asia Pacific
- 1.1. China
- 1.2. India
- 1.3. Japan
- 1.4. Australia
- 1.5. Rest of Asia Pacific
-
2. North America
- 2.1. United States
- 2.2. Canada
- 2.3. Mexico
-
3. Europe
- 3.1. Germany
- 3.2. United Kingdom
- 3.3. France
- 3.4. Norway
- 3.5. Netherlands
- 3.6. Rest of Europe
- 4. Rest of the World
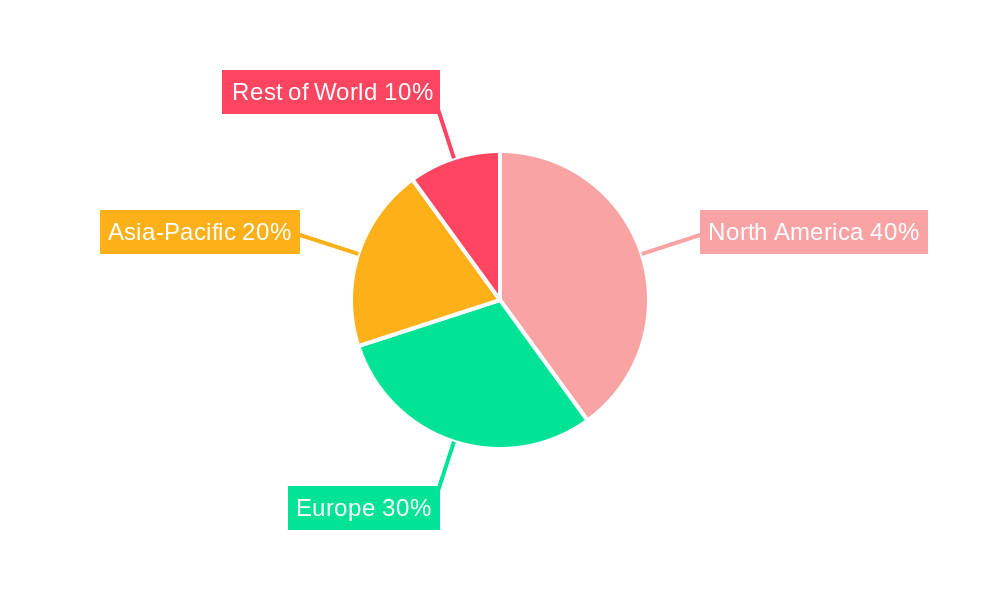
CCUS Market Regional Market Share
Geographic Coverage of CCUS Market
CCUS Market REPORT HIGHLIGHTS
| Aspects | Details |
|---|---|
| Study Period | 2020-2034 |
| Base Year | 2025 |
| Estimated Year | 2026 |
| Forecast Period | 2026-2034 |
| Historical Period | 2020-2025 |
| Growth Rate | CAGR of 14.21% from 2020-2034 |
| Segmentation |
|
Table of Contents
- 1. Introduction
- 1.1. Research Scope
- 1.2. Market Segmentation
- 1.3. Research Objective
- 1.4. Definitions and Assumptions
- 2. Executive Summary
- 2.1. Market Snapshot
- 3. Market Dynamics
- 3.1. Market Drivers
- 3.2. Market Restrains
- 3.3. Market Trends
- 3.4. Market Opportunities
- 4. Market Factor Analysis
- 4.1. Porters Five Forces
- 4.1.1. Bargaining Power of Suppliers
- 4.1.2. Bargaining Power of Buyers
- 4.1.3. Threat of New Entrants
- 4.1.4. Threat of Substitutes
- 4.1.5. Competitive Rivalry
- 4.2. PESTEL analysis
- 4.3. BCG Analysis
- 4.3.1. Stars (High Growth, High Market Share)
- 4.3.2. Cash Cows (Low Growth, High Market Share)
- 4.3.3. Question Mark (High Growth, Low Market Share)
- 4.3.4. Dogs (Low Growth, Low Market Share)
- 4.4. Ansoff Matrix Analysis
- 4.5. Supply Chain Analysis
- 4.6. Regulatory Landscape
- 4.7. Current Market Potential and Opportunity Assessment (TAM–SAM–SOM Framework)
- 4.8. PRI Analyst Note
- 4.1. Porters Five Forces
- 5. Market Analysis, Insights and Forecast 2021-2033
- 5.1. Market Analysis, Insights and Forecast - by Technology
- 5.1.1. Pre-combustion Capture
- 5.1.2. Oxy-fuel Combustion Capture
- 5.1.3. Post-combustion Capture
- 5.2. Market Analysis, Insights and Forecast - by End-user Industry
- 5.2.1. Oil and Gas
- 5.2.2. Coal and Biomass Power Plant
- 5.2.3. Iron and Steel
- 5.2.4. Chemical
- 5.2.5. Cement
- 5.3. Market Analysis, Insights and Forecast - by Region
- 5.3.1. Asia Pacific
- 5.3.2. North America
- 5.3.3. Europe
- 5.3.4. Rest of the World
- 5.1. Market Analysis, Insights and Forecast - by Technology
- 6. CCUS Market Analysis, Insights and Forecast, 2021-2033
- 6.1. Market Analysis, Insights and Forecast - by Technology
- 6.1.1. Pre-combustion Capture
- 6.1.2. Oxy-fuel Combustion Capture
- 6.1.3. Post-combustion Capture
- 6.2. Market Analysis, Insights and Forecast - by End-user Industry
- 6.2.1. Oil and Gas
- 6.2.2. Coal and Biomass Power Plant
- 6.2.3. Iron and Steel
- 6.2.4. Chemical
- 6.2.5. Cement
- 6.1. Market Analysis, Insights and Forecast - by Technology
- 7. Asia Pacific CCUS Market Analysis, Insights and Forecast, 2020-2032
- 7.1. Market Analysis, Insights and Forecast - by Technology
- 7.1.1. Pre-combustion Capture
- 7.1.2. Oxy-fuel Combustion Capture
- 7.1.3. Post-combustion Capture
- 7.2. Market Analysis, Insights and Forecast - by End-user Industry
- 7.2.1. Oil and Gas
- 7.2.2. Coal and Biomass Power Plant
- 7.2.3. Iron and Steel
- 7.2.4. Chemical
- 7.2.5. Cement
- 7.1. Market Analysis, Insights and Forecast - by Technology
- 8. North America CCUS Market Analysis, Insights and Forecast, 2020-2032
- 8.1. Market Analysis, Insights and Forecast - by Technology
- 8.1.1. Pre-combustion Capture
- 8.1.2. Oxy-fuel Combustion Capture
- 8.1.3. Post-combustion Capture
- 8.2. Market Analysis, Insights and Forecast - by End-user Industry
- 8.2.1. Oil and Gas
- 8.2.2. Coal and Biomass Power Plant
- 8.2.3. Iron and Steel
- 8.2.4. Chemical
- 8.2.5. Cement
- 8.1. Market Analysis, Insights and Forecast - by Technology
- 9. Europe CCUS Market Analysis, Insights and Forecast, 2020-2032
- 9.1. Market Analysis, Insights and Forecast - by Technology
- 9.1.1. Pre-combustion Capture
- 9.1.2. Oxy-fuel Combustion Capture
- 9.1.3. Post-combustion Capture
- 9.2. Market Analysis, Insights and Forecast - by End-user Industry
- 9.2.1. Oil and Gas
- 9.2.2. Coal and Biomass Power Plant
- 9.2.3. Iron and Steel
- 9.2.4. Chemical
- 9.2.5. Cement
- 9.1. Market Analysis, Insights and Forecast - by Technology
- 10. Rest of the World CCUS Market Analysis, Insights and Forecast, 2020-2032
- 10.1. Market Analysis, Insights and Forecast - by Technology
- 10.1.1. Pre-combustion Capture
- 10.1.2. Oxy-fuel Combustion Capture
- 10.1.3. Post-combustion Capture
- 10.2. Market Analysis, Insights and Forecast - by End-user Industry
- 10.2.1. Oil and Gas
- 10.2.2. Coal and Biomass Power Plant
- 10.2.3. Iron and Steel
- 10.2.4. Chemical
- 10.2.5. Cement
- 10.1. Market Analysis, Insights and Forecast - by Technology
- 11. Competitive Analysis
- 11.1. Company Profiles
- 11.1.1 Occidental Petroleum Corporation
- 11.1.1.1. Company Overview
- 11.1.1.2. Products
- 11.1.1.3. Company Financials
- 11.1.1.4. SWOT Analysis
- 11.1.2 Linde PLC
- 11.1.2.1. Company Overview
- 11.1.2.2. Products
- 11.1.2.3. Company Financials
- 11.1.2.4. SWOT Analysis
- 11.1.3 Shell PLC
- 11.1.3.1. Company Overview
- 11.1.3.2. Products
- 11.1.3.3. Company Financials
- 11.1.3.4. SWOT Analysis
- 11.1.4 Honeywell International Inc
- 11.1.4.1. Company Overview
- 11.1.4.2. Products
- 11.1.4.3. Company Financials
- 11.1.4.4. SWOT Analysis
- 11.1.5 General Electric
- 11.1.5.1. Company Overview
- 11.1.5.2. Products
- 11.1.5.3. Company Financials
- 11.1.5.4. SWOT Analysis
- 11.1.6 Exxon Mobil Corporation
- 11.1.6.1. Company Overview
- 11.1.6.2. Products
- 11.1.6.3. Company Financials
- 11.1.6.4. SWOT Analysis
- 11.1.7 Japan CCS Co Ltd
- 11.1.7.1. Company Overview
- 11.1.7.2. Products
- 11.1.7.3. Company Financials
- 11.1.7.4. SWOT Analysis
- 11.1.8 SLB*List Not Exhaustive
- 11.1.8.1. Company Overview
- 11.1.8.2. Products
- 11.1.8.3. Company Financials
- 11.1.8.4. SWOT Analysis
- 11.1.9 Fluor Corporation
- 11.1.9.1. Company Overview
- 11.1.9.2. Products
- 11.1.9.3. Company Financials
- 11.1.9.4. SWOT Analysis
- 11.1.10 Baker Hughes Company
- 11.1.10.1. Company Overview
- 11.1.10.2. Products
- 11.1.10.3. Company Financials
- 11.1.10.4. SWOT Analysis
- 11.1.11 Halliburton
- 11.1.11.1. Company Overview
- 11.1.11.2. Products
- 11.1.11.3. Company Financials
- 11.1.11.4. SWOT Analysis
- 11.1.12 Aker Solutions
- 11.1.12.1. Company Overview
- 11.1.12.2. Products
- 11.1.12.3. Company Financials
- 11.1.12.4. SWOT Analysis
- 11.1.13 Dakota Gasification Company
- 11.1.13.1. Company Overview
- 11.1.13.2. Products
- 11.1.13.3. Company Financials
- 11.1.13.4. SWOT Analysis
- 11.1.14 JX Nippon Oil & Gas Exploration Corporation
- 11.1.14.1. Company Overview
- 11.1.14.2. Products
- 11.1.14.3. Company Financials
- 11.1.14.4. SWOT Analysis
- 11.1.15 Siemens Energy
- 11.1.15.1. Company Overview
- 11.1.15.2. Products
- 11.1.15.3. Company Financials
- 11.1.15.4. SWOT Analysis
- 11.1.16 Air Liquide
- 11.1.16.1. Company Overview
- 11.1.16.2. Products
- 11.1.16.3. Company Financials
- 11.1.16.4. SWOT Analysis
- 11.1.17 Mitsubishi Heavy Industries Ltd
- 11.1.17.1. Company Overview
- 11.1.17.2. Products
- 11.1.17.3. Company Financials
- 11.1.17.4. SWOT Analysis
- 11.1.1 Occidental Petroleum Corporation
- 11.2. Market Entropy
- 11.2.1 Company's Key Areas Served
- 11.2.2 Recent Developments
- 11.3. Company Market Share Analysis 2025
- 11.3.1 Top 5 Companies Market Share Analysis
- 11.3.2 Top 3 Companies Market Share Analysis
- 11.4. List of Potential Customers
- 12. Research Methodology
List of Figures
- Figure 1: CCUS Market Revenue Breakdown (Million, %) by Product 2025 & 2033
- Figure 2: CCUS Market Share (%) by Company 2025
List of Tables
- Table 1: CCUS Market Revenue Million Forecast, by Technology 2020 & 2033
- Table 2: CCUS Market Volume K Tons Forecast, by Technology 2020 & 2033
- Table 3: CCUS Market Revenue Million Forecast, by End-user Industry 2020 & 2033
- Table 4: CCUS Market Volume K Tons Forecast, by End-user Industry 2020 & 2033
- Table 5: CCUS Market Revenue Million Forecast, by Region 2020 & 2033
- Table 6: CCUS Market Volume K Tons Forecast, by Region 2020 & 2033
- Table 7: CCUS Market Revenue Million Forecast, by Technology 2020 & 2033
- Table 8: CCUS Market Volume K Tons Forecast, by Technology 2020 & 2033
- Table 9: CCUS Market Revenue Million Forecast, by End-user Industry 2020 & 2033
- Table 10: CCUS Market Volume K Tons Forecast, by End-user Industry 2020 & 2033
- Table 11: CCUS Market Revenue Million Forecast, by Country 2020 & 2033
- Table 12: CCUS Market Volume K Tons Forecast, by Country 2020 & 2033
- Table 13: China CCUS Market Revenue (Million) Forecast, by Application 2020 & 2033
- Table 14: China CCUS Market Volume (K Tons) Forecast, by Application 2020 & 2033
- Table 15: India CCUS Market Revenue (Million) Forecast, by Application 2020 & 2033
- Table 16: India CCUS Market Volume (K Tons) Forecast, by Application 2020 & 2033
- Table 17: Japan CCUS Market Revenue (Million) Forecast, by Application 2020 & 2033
- Table 18: Japan CCUS Market Volume (K Tons) Forecast, by Application 2020 & 2033
- Table 19: Australia CCUS Market Revenue (Million) Forecast, by Application 2020 & 2033
- Table 20: Australia CCUS Market Volume (K Tons) Forecast, by Application 2020 & 2033
- Table 21: Rest of Asia Pacific CCUS Market Revenue (Million) Forecast, by Application 2020 & 2033
- Table 22: Rest of Asia Pacific CCUS Market Volume (K Tons) Forecast, by Application 2020 & 2033
- Table 23: CCUS Market Revenue Million Forecast, by Technology 2020 & 2033
- Table 24: CCUS Market Volume K Tons Forecast, by Technology 2020 & 2033
- Table 25: CCUS Market Revenue Million Forecast, by End-user Industry 2020 & 2033
- Table 26: CCUS Market Volume K Tons Forecast, by End-user Industry 2020 & 2033
- Table 27: CCUS Market Revenue Million Forecast, by Country 2020 & 2033
- Table 28: CCUS Market Volume K Tons Forecast, by Country 2020 & 2033
- Table 29: United States CCUS Market Revenue (Million) Forecast, by Application 2020 & 2033
- Table 30: United States CCUS Market Volume (K Tons) Forecast, by Application 2020 & 2033
- Table 31: Canada CCUS Market Revenue (Million) Forecast, by Application 2020 & 2033
- Table 32: Canada CCUS Market Volume (K Tons) Forecast, by Application 2020 & 2033
- Table 33: Mexico CCUS Market Revenue (Million) Forecast, by Application 2020 & 2033
- Table 34: Mexico CCUS Market Volume (K Tons) Forecast, by Application 2020 & 2033
- Table 35: CCUS Market Revenue Million Forecast, by Technology 2020 & 2033
- Table 36: CCUS Market Volume K Tons Forecast, by Technology 2020 & 2033
- Table 37: CCUS Market Revenue Million Forecast, by End-user Industry 2020 & 2033
- Table 38: CCUS Market Volume K Tons Forecast, by End-user Industry 2020 & 2033
- Table 39: CCUS Market Revenue Million Forecast, by Country 2020 & 2033
- Table 40: CCUS Market Volume K Tons Forecast, by Country 2020 & 2033
- Table 41: Germany CCUS Market Revenue (Million) Forecast, by Application 2020 & 2033
- Table 42: Germany CCUS Market Volume (K Tons) Forecast, by Application 2020 & 2033
- Table 43: United Kingdom CCUS Market Revenue (Million) Forecast, by Application 2020 & 2033
- Table 44: United Kingdom CCUS Market Volume (K Tons) Forecast, by Application 2020 & 2033
- Table 45: France CCUS Market Revenue (Million) Forecast, by Application 2020 & 2033
- Table 46: France CCUS Market Volume (K Tons) Forecast, by Application 2020 & 2033
- Table 47: Norway CCUS Market Revenue (Million) Forecast, by Application 2020 & 2033
- Table 48: Norway CCUS Market Volume (K Tons) Forecast, by Application 2020 & 2033
- Table 49: Netherlands CCUS Market Revenue (Million) Forecast, by Application 2020 & 2033
- Table 50: Netherlands CCUS Market Volume (K Tons) Forecast, by Application 2020 & 2033
- Table 51: Rest of Europe CCUS Market Revenue (Million) Forecast, by Application 2020 & 2033
- Table 52: Rest of Europe CCUS Market Volume (K Tons) Forecast, by Application 2020 & 2033
- Table 53: CCUS Market Revenue Million Forecast, by Technology 2020 & 2033
- Table 54: CCUS Market Volume K Tons Forecast, by Technology 2020 & 2033
- Table 55: CCUS Market Revenue Million Forecast, by End-user Industry 2020 & 2033
- Table 56: CCUS Market Volume K Tons Forecast, by End-user Industry 2020 & 2033
- Table 57: CCUS Market Revenue Million Forecast, by Country 2020 & 2033
- Table 58: CCUS Market Volume K Tons Forecast, by Country 2020 & 2033
Frequently Asked Questions
1. What is the projected Compound Annual Growth Rate (CAGR) of the CCUS Market?
The projected CAGR is approximately 14.21%.
2. Which companies are prominent players in the CCUS Market?
Key companies in the market include Occidental Petroleum Corporation, Linde PLC, Shell PLC, Honeywell International Inc, General Electric, Exxon Mobil Corporation, Japan CCS Co Ltd, SLB*List Not Exhaustive, Fluor Corporation, Baker Hughes Company, Halliburton, Aker Solutions, Dakota Gasification Company, JX Nippon Oil & Gas Exploration Corporation, Siemens Energy, Air Liquide, Mitsubishi Heavy Industries Ltd.
3. What are the main segments of the CCUS Market?
The market segments include Technology, End-user Industry.
4. Can you provide details about the market size?
The market size is estimated to be USD 2.42 Million as of 2022.
5. What are some drivers contributing to market growth?
Emerging Demand for CO2 Injection Technique for Enhanced Oil Recovery (EOR); Strict Government Norms Toward GHG Emissions.
6. What are the notable trends driving market growth?
Oil and Gas Segment to Dominate the Market.
7. Are there any restraints impacting market growth?
Huge CCS Technology Implementation Costs; Growth in Shale Investments.
8. Can you provide examples of recent developments in the market?
March 2024: JX Nippon Oil & Gas Exploration Corporation and Chevron New Energies, a division of Chevron U.S.A. Inc., entered into a memorandum of understanding aimed at assessing the potential export of carbon dioxide from Japan to carbon capture and storage (CCS) initiatives situated in Australia and other nations across Asia-Pacific. This agreement enhances the company's market footprint.
9. What pricing options are available for accessing the report?
Pricing options include single-user, multi-user, and enterprise licenses priced at USD 4750, USD 5250, and USD 8750 respectively.
10. Is the market size provided in terms of value or volume?
The market size is provided in terms of value, measured in Million and volume, measured in K Tons.
11. Are there any specific market keywords associated with the report?
Yes, the market keyword associated with the report is "CCUS Market," which aids in identifying and referencing the specific market segment covered.
12. How do I determine which pricing option suits my needs best?
The pricing options vary based on user requirements and access needs. Individual users may opt for single-user licenses, while businesses requiring broader access may choose multi-user or enterprise licenses for cost-effective access to the report.
13. Are there any additional resources or data provided in the CCUS Market report?
While the report offers comprehensive insights, it's advisable to review the specific contents or supplementary materials provided to ascertain if additional resources or data are available.
14. How can I stay updated on further developments or reports in the CCUS Market?
To stay informed about further developments, trends, and reports in the CCUS Market, consider subscribing to industry newsletters, following relevant companies and organizations, or regularly checking reputable industry news sources and publications.
Methodology
Step 1 - Identification of Relevant Samples Size from Population Database


Step 2 - Approaches for Defining Global Market Size (Value, Volume* & Price*)

Note*: In applicable scenarios
Step 3 - Data Sources
Primary Research
- Web Analytics
- Survey Reports
- Research Institute
- Latest Research Reports
- Opinion Leaders
Secondary Research
- Annual Reports
- White Paper
- Latest Press Release
- Industry Association
- Paid Database
- Investor Presentations

Step 4 - Data Triangulation
Involves using different sources of information in order to increase the validity of a study
These sources are likely to be stakeholders in a program - participants, other researchers, program staff, other community members, and so on.
Then we put all data in single framework & apply various statistical tools to find out the dynamic on the market.
During the analysis stage, feedback from the stakeholder groups would be compared to determine areas of agreement as well as areas of divergence