

Key Insights
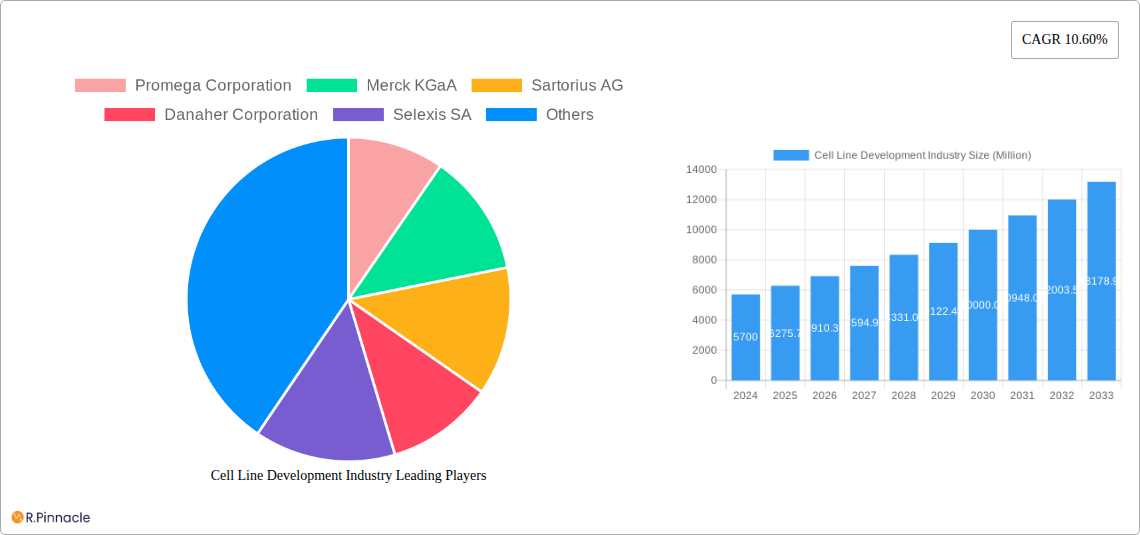
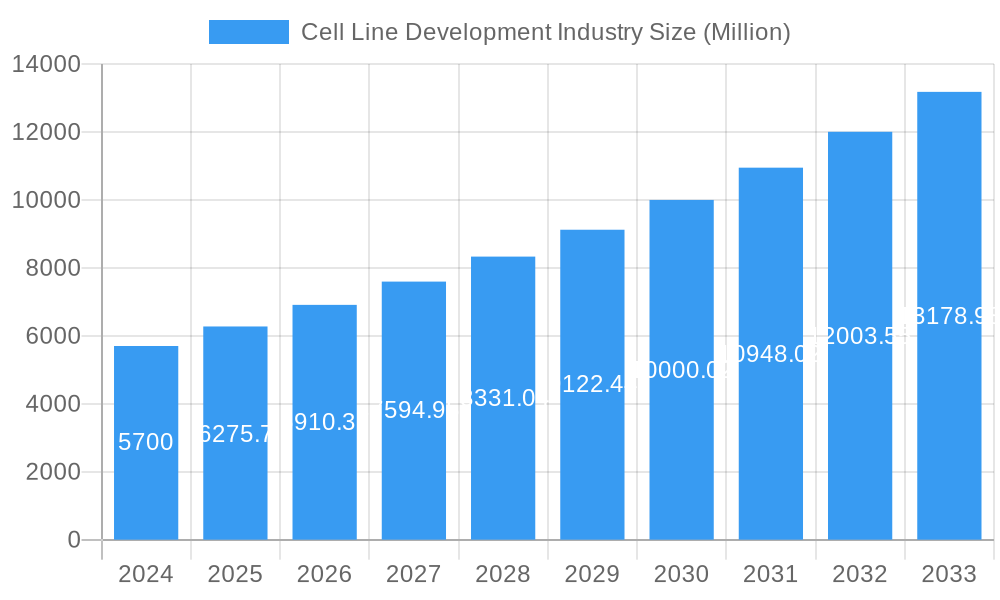
The global Cell Line Development market is poised for significant expansion, projected to reach USD 5.7 billion in 2024 and grow at a robust CAGR of 10.1% through 2033. This substantial growth is primarily fueled by the escalating demand for biopharmaceuticals, including monoclonal antibodies, recombinant proteins, and advanced therapies. The increasing prevalence of chronic diseases and infectious diseases worldwide necessitates the development of novel and effective treatments, directly driving the need for advanced cell line development services. Furthermore, a surge in R&D investments by biotechnology and pharmaceutical companies, coupled with advancements in genetic engineering and cell culture technologies, are key catalysts propelling the market forward. The market's expansion is further supported by the growing trend of outsourcing cell line development services to specialized Contract Development and Manufacturing Organizations (CDMOs), enabling faster timelines and cost efficiencies for drug developers. Emerging economies are also presenting significant growth opportunities due to increasing healthcare expenditure and a burgeoning biopharmaceutical industry.
Cell Line Development Industry Market Size (In Billion)
The Cell Line Development market is segmented across various product types, including reagents and media, equipment, finished cells, and other products, with reagents and media anticipated to hold a dominant share due to their critical role in cell growth and maintenance. Mammalian cell lines are expected to lead the source segment, owing to their high productivity and suitability for expressing complex therapeutic proteins. Application-wise, recombinant protein expression and vaccine production are significant growth drivers, reflecting the increasing development of biologics and vaccines. The end-user landscape is dominated by biotech and pharmaceutical companies, followed by academic and research institutes, underscoring the industry's reliance on these entities for therapeutic innovation. Geographically, North America and Europe currently represent the largest markets, driven by established biopharmaceutical industries and strong research ecosystems. However, the Asia Pacific region is exhibiting the fastest growth rate, attributed to government initiatives supporting biopharmaceutical manufacturing, a growing pool of skilled talent, and increasing contract research outsourcing.
Cell Line Development Industry Company Market Share
Unlocking the Future of Biologics: A Comprehensive Report on the Cell Line Development Industry
This in-depth analysis delves into the dynamic cell line development market, a critical cornerstone for the burgeoning biopharmaceutical sector. With an estimated USD 10 billion market size in 2025, this report provides unparalleled insights for stakeholders navigating the complexities of biologics manufacturing and drug discovery. We meticulously examine market structure, dynamics, segmentation, and future trends from 2019 to 2033, with a detailed focus on the forecast period 2025–2033. Essential for biotech and pharmaceutical companies, academics and research institutes, and contract development and manufacturing organizations (CDMOs), this report equips you with actionable intelligence to drive innovation and growth.
Cell Line Development Industry Market Structure & Innovation Trends
The cell line development industry is characterized by a moderate to high level of market concentration, with key players dominating specific niches. Innovation is the primary driver, fueled by the relentless pursuit of higher yields, improved product quality, and faster development timelines for biologics. Regulatory frameworks, such as those established by the FDA and EMA, play a crucial role in shaping product development and market entry. The presence of readily available cell culture media and reagents, alongside advanced cell line engineering equipment, supports a thriving ecosystem. Product substitutes are limited due to the highly specialized nature of cell line development, but advancements in gene editing technologies continuously redefine the landscape. End-user demographics are heavily skewed towards biotech and pharmaceutical companies, who represent the largest segment of the market, driven by the increasing demand for novel therapeutics. Mergers and acquisitions (M&A) are a significant aspect of market structure, with deal values in the billions of dollars, indicating strategic consolidation and expansion by leading firms. For instance, the FUJIFILM Corporation's USD 1.6 billion investment underscores the significant capital flowing into this sector. Understanding the interplay between these structural elements is vital for strategic decision-making in this competitive arena.
Cell Line Development Industry Market Dynamics & Trends
The cell line development industry is poised for robust growth, propelled by a confluence of powerful market dynamics and evolving trends. The projected Compound Annual Growth Rate (CAGR) for the cell line development market is an impressive XX%, reflecting the accelerating demand for biologics across diverse therapeutic areas. A primary growth driver is the escalating prevalence of chronic diseases globally, necessitating the development of advanced protein-based therapies and vaccines. Technological disruptions, such as the advent of CRISPR-Cas9 gene editing and other advanced genetic engineering tools, are revolutionizing the speed and precision of cell line engineering, enabling the creation of more efficient and productive cell lines. Consumer preferences, particularly the demand for personalized medicine and biopharmaceuticals with fewer side effects, are also influencing the market, pushing for more sophisticated and targeted therapeutic solutions.
The competitive landscape is intense, with established giants and agile innovators vying for market share. Companies are investing heavily in Research and Development (R&D) to enhance proprietary technologies for mammalian cell line development and non-mammalian cell line development, aiming to achieve higher titers and superior product quality. The increasing outsourcing of cell line development services to Contract Development and Manufacturing Organizations (CDMOs) is another significant trend, driven by the need for specialized expertise and infrastructure, and the desire to reduce capital expenditure. Furthermore, the growing focus on recombinant protein expression for both therapeutic and industrial applications is a substantial market penetration factor. The development of novel hybridoma technology for antibody production and the continuous need for rapid vaccine production capacity are also key dynamics shaping the market trajectory. Emerging applications in drug discovery and the broader field of cell and gene therapy are opening up new avenues for growth and innovation. The market is witnessing increased adoption of automated platforms and data analytics to streamline cell line development processes, further contributing to market expansion and efficiency.
Dominant Regions & Segments in Cell Line Development Industry
The cell line development industry exhibits distinct regional dominance and segment leadership, driven by a complex interplay of economic policies, research infrastructure, and market demand. North America, particularly the United States, stands as the leading region, owing to its mature biopharmaceutical ecosystem, significant R&D investments, and a robust presence of leading biotech and pharmaceutical companies. Government initiatives supporting life sciences research and a strong academic-medical-industry collaboration further bolster its position.
Product Segment Dominance:
- Reagent and Media: This segment holds substantial market share due to its foundational role in all cell line development processes. The continuous innovation in specialized cell culture media designed for high-yield protein expression and robust cell growth directly fuels its dominance. The market value for reagents and media is estimated to be in the billions of dollars.
- Equipment: Sophisticated equipment, including bioreactors, incubators, and analytical instruments, are crucial for efficient cell line development. Investments in advanced technology by CDMOs and research institutions contribute to the strong performance of this segment.
Source Segment Dominance:
- Mammalian Cell Line: This source dominates the market, particularly for the production of complex therapeutic proteins and monoclonal antibodies. The ability of mammalian cells to perform post-translational modifications crucial for protein functionality makes them the preferred choice for a vast array of biologics. This segment is valued in the billions of dollars.
Application Segment Dominance:
- Recombinant Protein Expression: This is the most significant application segment, as the demand for therapeutic proteins, enzymes, and other biologics continues to surge. The advancements in protein engineering and expression systems directly correlate with the growth of this segment.
End User Segment Dominance:
- Biotech and Pharmaceutical Companies: As the primary developers and manufacturers of biologics, these companies represent the largest end-user segment by a significant margin, driving the majority of demand for cell line development services and products.
Key drivers of dominance in these segments include strong governmental support for life sciences in leading regions, extensive R&D infrastructure, and the direct correlation between technological advancements and market demand. For instance, the increasing complexity of therapeutic targets necessitates advanced mammalian cell line development for effective recombinant protein expression. The proactive investment by biotech and pharmaceutical companies in cutting-edge equipment and high-quality reagent and media further solidifies the dominance of these segments. The market value for the overall cell line development industry is projected to reach billions of dollars by the end of the forecast period.
Cell Line Development Industry Product Innovations
Product innovation in the cell line development industry is primarily focused on enhancing efficiency, speed, and the quality of biologics produced. Advancements in gene editing technologies, such as CRISPR-Cas9, have revolutionized the creation of stable, high-producing cell lines. The development of novel cell culture media formulations optimized for specific cell types and therapeutic proteins significantly boosts yields and reduces production costs. Furthermore, the introduction of automated cell line development platforms and high-throughput screening systems accelerates the selection and characterization of superior cell clones. These innovations offer a competitive advantage by enabling faster drug development timelines and improving the overall cost-effectiveness of biologics manufacturing.
Report Scope & Segmentation Analysis
This report provides a comprehensive segmentation of the cell line development industry. The market is analyzed across key product categories: Reagent and Media, Equipment, Finished Cells, and Other Products. In terms of source, the report differentiates between Mammalian Cell Line and Non-mammalian Cell Line development. Application-wise, the analysis covers Recombinant Protein Expression, Hybridomas Technology, Vaccine Production, Drug Discovery, and Other Applications. Finally, end-user segmentation includes Biotech and Pharmaceutical Companies, Academics and Research Institutes, and Other End Users. Each segment's market size, growth projections, and competitive dynamics are meticulously detailed, offering granular insights into specific market areas and their potential for future expansion.
Key Drivers of Cell Line Development Industry Growth
The cell line development industry is propelled by several key drivers that underpin its significant growth trajectory. The relentless increase in the global prevalence of chronic diseases and the growing demand for biopharmaceuticals, particularly biologics like monoclonal antibodies and therapeutic proteins, are paramount. Advancements in biotechnological tools, such as gene editing technologies (e.g., CRISPR-Cas9) and high-throughput screening, are enabling faster and more efficient cell line creation. Furthermore, the expanding pipeline of innovative drugs and the increasing focus on personalized medicine necessitate sophisticated cell line development capabilities. The growing role of Contract Development and Manufacturing Organizations (CDMOs) in supporting biopharmaceutical companies with specialized expertise and infrastructure also acts as a significant growth accelerator.
Challenges in the Cell Line Development Industry Sector
Despite its robust growth, the cell line development industry sector faces several critical challenges. Regulatory hurdles and the stringent approval processes for biologics can lead to extended development timelines and increased costs. The complexity of optimizing cell lines for high-yield and consistent production of therapeutic proteins remains a technical challenge. Supply chain disruptions, as witnessed in recent global events, can impact the availability of critical raw materials and specialized equipment. Furthermore, the high capital investment required for state-of-the-art facilities and advanced technologies can be a barrier for smaller players. Intense competition among established players and emerging companies also puts pressure on pricing and innovation cycles.
Emerging Opportunities in Cell Line Development Industry
The cell line development industry is rife with emerging opportunities driven by scientific advancements and evolving market needs. The burgeoning field of cell and gene therapy presents a significant opportunity, requiring specialized cell line engineering for gene delivery vectors and therapeutic cell production. The development of cell lines for the production of novel modalities, such as bispecific antibodies and antibody-drug conjugates (ADCs), is another area of rapid growth. Expansion into emerging markets with increasing healthcare expenditure and a growing biopharmaceutical sector offers new avenues for market penetration. Furthermore, the application of artificial intelligence (AI) and machine learning (ML) in cell line development for predictive modeling and optimization holds immense potential to accelerate discovery and enhance efficiency.
Leading Players in the Cell Line Development Industry Market
- Promega Corporation
- Merck KGaA
- Sartorius AG
- Danaher Corporation
- Selexis SA
- Fujifilm Corporation (Fujifilm Diosynth Biotechnologies)
- American Type Culture Collection (ATCC)
- WuXi Biologics
- Thermo Fisher Scientific
- Corning Incorporated
Key Developments in Cell Line Development Industry Industry
- July 2022: ProBioGen and Granite Bio Collaborate to Provide GMP Manufacturing and Cell Line Development Services. A novel monoclonal antibody developed by Granite Bio is the company's top contender for the treatment of autoimmune and specific cancer indications. By using the DirectedLuck transposase.
- June 2022: FUJIFILM Corporation announced the investment of USD 1.6 billion to enhance and expand the cell culture manufacturing services of FUJIFILM Diosynth Biotechnologies, a subsidiary of FUJIFILM Corporation, and world-leading contract development and manufacturing organization (CDMO).
Future Outlook for Cell Line Development Industry Market
The future outlook for the cell line development industry is exceptionally promising, fueled by continued innovation and escalating global demand for biopharmaceuticals. The anticipated growth accelerators include the ongoing expansion of therapeutic protein and antibody pipelines, the increasing adoption of advanced gene editing technologies for rapid cell line generation, and the growing market for vaccines and cell therapies. Strategic investments by leading companies, like the USD 1.6 billion infusion by FUJIFILM Corporation, indicate strong confidence in future market expansion. Opportunities will emerge from the development of cell lines for novel drug modalities and the increasing outsourcing of development services to specialized CDMOs. The industry is set to witness significant advancements, contributing to breakthroughs in disease treatment and overall human health.
Cell Line Development Industry Segmentation
-
1. Product
- 1.1. Reagent and Media
- 1.2. Equipment
- 1.3. Finished Cells
- 1.4. Other Products
-
2. Source
- 2.1. Mammalian Cell Line
- 2.2. Non-mammalian Cell Line
-
3. Application
- 3.1. Recombinant Protein Expression
- 3.2. Hybridomas Technology
- 3.3. Vaccine Production
- 3.4. Drug Discovery
- 3.5. Other Applications
-
4. End User
- 4.1. Biotech and Pharmaceutical Companies
- 4.2. Academics and Research Institutes
- 4.3. Other End Users
Cell Line Development Industry Segmentation By Geography
-
1. North America
- 1.1. United States
- 1.2. Canada
- 1.3. Mexico
-
2. Europe
- 2.1. Germany
- 2.2. United Kingdom
- 2.3. France
- 2.4. Italy
- 2.5. Spain
- 2.6. Rest of Europe
-
3. Asia Pacific
- 3.1. China
- 3.2. Japan
- 3.3. India
- 3.4. Australia
- 3.5. South Korea
- 3.6. Rest of Asia Pacific
-
4. Middle East and Africa
- 4.1. GCC
- 4.2. South Africa
- 4.3. Rest of Middle East and Africa
-
5. South America
- 5.1. Brazil
- 5.2. Argentina
- 5.3. Rest of South America
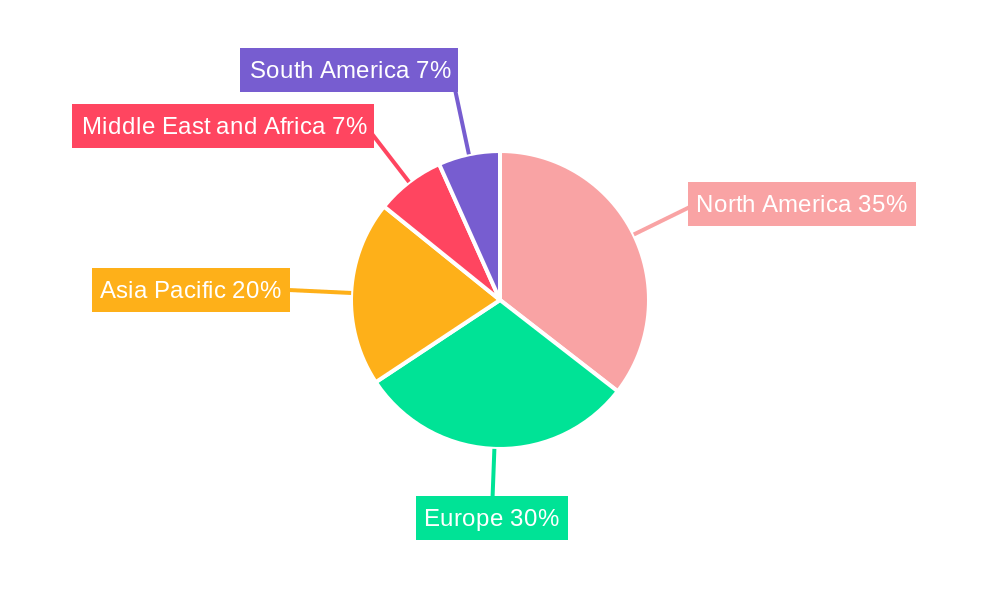
Cell Line Development Industry Regional Market Share
Geographic Coverage of Cell Line Development Industry
Cell Line Development Industry REPORT HIGHLIGHTS
| Aspects | Details |
|---|---|
| Study Period | 2020-2034 |
| Base Year | 2025 |
| Estimated Year | 2026 |
| Forecast Period | 2026-2034 |
| Historical Period | 2020-2025 |
| Growth Rate | CAGR of 6.4% from 2020-2034 |
| Segmentation |
|
Table of Contents
- 1. Introduction
- 1.1. Research Scope
- 1.2. Market Segmentation
- 1.3. Research Objective
- 1.4. Definitions and Assumptions
- 2. Executive Summary
- 2.1. Market Snapshot
- 3. Market Dynamics
- 3.1. Market Drivers
- 3.2. Market Restrains
- 3.3. Market Trends
- 3.4. Market Opportunities
- 4. Market Factor Analysis
- 4.1. Porters Five Forces
- 4.1.1. Bargaining Power of Suppliers
- 4.1.2. Bargaining Power of Buyers
- 4.1.3. Threat of New Entrants
- 4.1.4. Threat of Substitutes
- 4.1.5. Competitive Rivalry
- 4.2. PESTEL analysis
- 4.3. BCG Analysis
- 4.3.1. Stars (High Growth, High Market Share)
- 4.3.2. Cash Cows (Low Growth, High Market Share)
- 4.3.3. Question Mark (High Growth, Low Market Share)
- 4.3.4. Dogs (Low Growth, Low Market Share)
- 4.4. Ansoff Matrix Analysis
- 4.5. Supply Chain Analysis
- 4.6. Regulatory Landscape
- 4.7. Current Market Potential and Opportunity Assessment (TAM–SAM–SOM Framework)
- 4.8. PRI Analyst Note
- 4.1. Porters Five Forces
- 5. Market Analysis, Insights and Forecast 2021-2033
- 5.1. Market Analysis, Insights and Forecast - by Product
- 5.1.1. Reagent and Media
- 5.1.2. Equipment
- 5.1.3. Finished Cells
- 5.1.4. Other Products
- 5.2. Market Analysis, Insights and Forecast - by Source
- 5.2.1. Mammalian Cell Line
- 5.2.2. Non-mammalian Cell Line
- 5.3. Market Analysis, Insights and Forecast - by Application
- 5.3.1. Recombinant Protein Expression
- 5.3.2. Hybridomas Technology
- 5.3.3. Vaccine Production
- 5.3.4. Drug Discovery
- 5.3.5. Other Applications
- 5.4. Market Analysis, Insights and Forecast - by End User
- 5.4.1. Biotech and Pharmaceutical Companies
- 5.4.2. Academics and Research Institutes
- 5.4.3. Other End Users
- 5.5. Market Analysis, Insights and Forecast - by Region
- 5.5.1. North America
- 5.5.2. Europe
- 5.5.3. Asia Pacific
- 5.5.4. Middle East and Africa
- 5.5.5. South America
- 5.1. Market Analysis, Insights and Forecast - by Product
- 6. Global Cell Line Development Industry Analysis, Insights and Forecast, 2021-2033
- 6.1. Market Analysis, Insights and Forecast - by Product
- 6.1.1. Reagent and Media
- 6.1.2. Equipment
- 6.1.3. Finished Cells
- 6.1.4. Other Products
- 6.2. Market Analysis, Insights and Forecast - by Source
- 6.2.1. Mammalian Cell Line
- 6.2.2. Non-mammalian Cell Line
- 6.3. Market Analysis, Insights and Forecast - by Application
- 6.3.1. Recombinant Protein Expression
- 6.3.2. Hybridomas Technology
- 6.3.3. Vaccine Production
- 6.3.4. Drug Discovery
- 6.3.5. Other Applications
- 6.4. Market Analysis, Insights and Forecast - by End User
- 6.4.1. Biotech and Pharmaceutical Companies
- 6.4.2. Academics and Research Institutes
- 6.4.3. Other End Users
- 6.1. Market Analysis, Insights and Forecast - by Product
- 7. North America Cell Line Development Industry Analysis, Insights and Forecast, 2020-2032
- 7.1. Market Analysis, Insights and Forecast - by Product
- 7.1.1. Reagent and Media
- 7.1.2. Equipment
- 7.1.3. Finished Cells
- 7.1.4. Other Products
- 7.2. Market Analysis, Insights and Forecast - by Source
- 7.2.1. Mammalian Cell Line
- 7.2.2. Non-mammalian Cell Line
- 7.3. Market Analysis, Insights and Forecast - by Application
- 7.3.1. Recombinant Protein Expression
- 7.3.2. Hybridomas Technology
- 7.3.3. Vaccine Production
- 7.3.4. Drug Discovery
- 7.3.5. Other Applications
- 7.4. Market Analysis, Insights and Forecast - by End User
- 7.4.1. Biotech and Pharmaceutical Companies
- 7.4.2. Academics and Research Institutes
- 7.4.3. Other End Users
- 7.1. Market Analysis, Insights and Forecast - by Product
- 8. Europe Cell Line Development Industry Analysis, Insights and Forecast, 2020-2032
- 8.1. Market Analysis, Insights and Forecast - by Product
- 8.1.1. Reagent and Media
- 8.1.2. Equipment
- 8.1.3. Finished Cells
- 8.1.4. Other Products
- 8.2. Market Analysis, Insights and Forecast - by Source
- 8.2.1. Mammalian Cell Line
- 8.2.2. Non-mammalian Cell Line
- 8.3. Market Analysis, Insights and Forecast - by Application
- 8.3.1. Recombinant Protein Expression
- 8.3.2. Hybridomas Technology
- 8.3.3. Vaccine Production
- 8.3.4. Drug Discovery
- 8.3.5. Other Applications
- 8.4. Market Analysis, Insights and Forecast - by End User
- 8.4.1. Biotech and Pharmaceutical Companies
- 8.4.2. Academics and Research Institutes
- 8.4.3. Other End Users
- 8.1. Market Analysis, Insights and Forecast - by Product
- 9. Asia Pacific Cell Line Development Industry Analysis, Insights and Forecast, 2020-2032
- 9.1. Market Analysis, Insights and Forecast - by Product
- 9.1.1. Reagent and Media
- 9.1.2. Equipment
- 9.1.3. Finished Cells
- 9.1.4. Other Products
- 9.2. Market Analysis, Insights and Forecast - by Source
- 9.2.1. Mammalian Cell Line
- 9.2.2. Non-mammalian Cell Line
- 9.3. Market Analysis, Insights and Forecast - by Application
- 9.3.1. Recombinant Protein Expression
- 9.3.2. Hybridomas Technology
- 9.3.3. Vaccine Production
- 9.3.4. Drug Discovery
- 9.3.5. Other Applications
- 9.4. Market Analysis, Insights and Forecast - by End User
- 9.4.1. Biotech and Pharmaceutical Companies
- 9.4.2. Academics and Research Institutes
- 9.4.3. Other End Users
- 9.1. Market Analysis, Insights and Forecast - by Product
- 10. Middle East and Africa Cell Line Development Industry Analysis, Insights and Forecast, 2020-2032
- 10.1. Market Analysis, Insights and Forecast - by Product
- 10.1.1. Reagent and Media
- 10.1.2. Equipment
- 10.1.3. Finished Cells
- 10.1.4. Other Products
- 10.2. Market Analysis, Insights and Forecast - by Source
- 10.2.1. Mammalian Cell Line
- 10.2.2. Non-mammalian Cell Line
- 10.3. Market Analysis, Insights and Forecast - by Application
- 10.3.1. Recombinant Protein Expression
- 10.3.2. Hybridomas Technology
- 10.3.3. Vaccine Production
- 10.3.4. Drug Discovery
- 10.3.5. Other Applications
- 10.4. Market Analysis, Insights and Forecast - by End User
- 10.4.1. Biotech and Pharmaceutical Companies
- 10.4.2. Academics and Research Institutes
- 10.4.3. Other End Users
- 10.1. Market Analysis, Insights and Forecast - by Product
- 11. South America Cell Line Development Industry Analysis, Insights and Forecast, 2020-2032
- 11.1. Market Analysis, Insights and Forecast - by Product
- 11.1.1. Reagent and Media
- 11.1.2. Equipment
- 11.1.3. Finished Cells
- 11.1.4. Other Products
- 11.2. Market Analysis, Insights and Forecast - by Source
- 11.2.1. Mammalian Cell Line
- 11.2.2. Non-mammalian Cell Line
- 11.3. Market Analysis, Insights and Forecast - by Application
- 11.3.1. Recombinant Protein Expression
- 11.3.2. Hybridomas Technology
- 11.3.3. Vaccine Production
- 11.3.4. Drug Discovery
- 11.3.5. Other Applications
- 11.4. Market Analysis, Insights and Forecast - by End User
- 11.4.1. Biotech and Pharmaceutical Companies
- 11.4.2. Academics and Research Institutes
- 11.4.3. Other End Users
- 11.1. Market Analysis, Insights and Forecast - by Product
- 12. Competitive Analysis
- 12.1. Company Profiles
- 12.1.1 Promega Corporation
- 12.1.1.1. Company Overview
- 12.1.1.2. Products
- 12.1.1.3. Company Financials
- 12.1.1.4. SWOT Analysis
- 12.1.2 Merck KGaA
- 12.1.2.1. Company Overview
- 12.1.2.2. Products
- 12.1.2.3. Company Financials
- 12.1.2.4. SWOT Analysis
- 12.1.3 Sartorius AG
- 12.1.3.1. Company Overview
- 12.1.3.2. Products
- 12.1.3.3. Company Financials
- 12.1.3.4. SWOT Analysis
- 12.1.4 Danaher Corporation
- 12.1.4.1. Company Overview
- 12.1.4.2. Products
- 12.1.4.3. Company Financials
- 12.1.4.4. SWOT Analysis
- 12.1.5 Selexis SA
- 12.1.5.1. Company Overview
- 12.1.5.2. Products
- 12.1.5.3. Company Financials
- 12.1.5.4. SWOT Analysis
- 12.1.6 Fujifilm Corporation (Fujifilm Diosynth Biotechnologies)
- 12.1.6.1. Company Overview
- 12.1.6.2. Products
- 12.1.6.3. Company Financials
- 12.1.6.4. SWOT Analysis
- 12.1.7 American Type Culture Collection (ATCC)
- 12.1.7.1. Company Overview
- 12.1.7.2. Products
- 12.1.7.3. Company Financials
- 12.1.7.4. SWOT Analysis
- 12.1.8 WuXi Biologics
- 12.1.8.1. Company Overview
- 12.1.8.2. Products
- 12.1.8.3. Company Financials
- 12.1.8.4. SWOT Analysis
- 12.1.9 Thermo Fisher Scientific
- 12.1.9.1. Company Overview
- 12.1.9.2. Products
- 12.1.9.3. Company Financials
- 12.1.9.4. SWOT Analysis
- 12.1.10 Corning Incorporated
- 12.1.10.1. Company Overview
- 12.1.10.2. Products
- 12.1.10.3. Company Financials
- 12.1.10.4. SWOT Analysis
- 12.1.1 Promega Corporation
- 12.2. Market Entropy
- 12.2.1 Company's Key Areas Served
- 12.2.2 Recent Developments
- 12.3. Company Market Share Analysis 2025
- 12.3.1 Top 5 Companies Market Share Analysis
- 12.3.2 Top 3 Companies Market Share Analysis
- 12.4. List of Potential Customers
- 13. Research Methodology
List of Figures
- Figure 1: Global Cell Line Development Industry Revenue Breakdown (billion, %) by Region 2025 & 2033
- Figure 2: Global Cell Line Development Industry Volume Breakdown (K Unit, %) by Region 2025 & 2033
- Figure 3: North America Cell Line Development Industry Revenue (billion), by Product 2025 & 2033
- Figure 4: North America Cell Line Development Industry Volume (K Unit), by Product 2025 & 2033
- Figure 5: North America Cell Line Development Industry Revenue Share (%), by Product 2025 & 2033
- Figure 6: North America Cell Line Development Industry Volume Share (%), by Product 2025 & 2033
- Figure 7: North America Cell Line Development Industry Revenue (billion), by Source 2025 & 2033
- Figure 8: North America Cell Line Development Industry Volume (K Unit), by Source 2025 & 2033
- Figure 9: North America Cell Line Development Industry Revenue Share (%), by Source 2025 & 2033
- Figure 10: North America Cell Line Development Industry Volume Share (%), by Source 2025 & 2033
- Figure 11: North America Cell Line Development Industry Revenue (billion), by Application 2025 & 2033
- Figure 12: North America Cell Line Development Industry Volume (K Unit), by Application 2025 & 2033
- Figure 13: North America Cell Line Development Industry Revenue Share (%), by Application 2025 & 2033
- Figure 14: North America Cell Line Development Industry Volume Share (%), by Application 2025 & 2033
- Figure 15: North America Cell Line Development Industry Revenue (billion), by End User 2025 & 2033
- Figure 16: North America Cell Line Development Industry Volume (K Unit), by End User 2025 & 2033
- Figure 17: North America Cell Line Development Industry Revenue Share (%), by End User 2025 & 2033
- Figure 18: North America Cell Line Development Industry Volume Share (%), by End User 2025 & 2033
- Figure 19: North America Cell Line Development Industry Revenue (billion), by Country 2025 & 2033
- Figure 20: North America Cell Line Development Industry Volume (K Unit), by Country 2025 & 2033
- Figure 21: North America Cell Line Development Industry Revenue Share (%), by Country 2025 & 2033
- Figure 22: North America Cell Line Development Industry Volume Share (%), by Country 2025 & 2033
- Figure 23: Europe Cell Line Development Industry Revenue (billion), by Product 2025 & 2033
- Figure 24: Europe Cell Line Development Industry Volume (K Unit), by Product 2025 & 2033
- Figure 25: Europe Cell Line Development Industry Revenue Share (%), by Product 2025 & 2033
- Figure 26: Europe Cell Line Development Industry Volume Share (%), by Product 2025 & 2033
- Figure 27: Europe Cell Line Development Industry Revenue (billion), by Source 2025 & 2033
- Figure 28: Europe Cell Line Development Industry Volume (K Unit), by Source 2025 & 2033
- Figure 29: Europe Cell Line Development Industry Revenue Share (%), by Source 2025 & 2033
- Figure 30: Europe Cell Line Development Industry Volume Share (%), by Source 2025 & 2033
- Figure 31: Europe Cell Line Development Industry Revenue (billion), by Application 2025 & 2033
- Figure 32: Europe Cell Line Development Industry Volume (K Unit), by Application 2025 & 2033
- Figure 33: Europe Cell Line Development Industry Revenue Share (%), by Application 2025 & 2033
- Figure 34: Europe Cell Line Development Industry Volume Share (%), by Application 2025 & 2033
- Figure 35: Europe Cell Line Development Industry Revenue (billion), by End User 2025 & 2033
- Figure 36: Europe Cell Line Development Industry Volume (K Unit), by End User 2025 & 2033
- Figure 37: Europe Cell Line Development Industry Revenue Share (%), by End User 2025 & 2033
- Figure 38: Europe Cell Line Development Industry Volume Share (%), by End User 2025 & 2033
- Figure 39: Europe Cell Line Development Industry Revenue (billion), by Country 2025 & 2033
- Figure 40: Europe Cell Line Development Industry Volume (K Unit), by Country 2025 & 2033
- Figure 41: Europe Cell Line Development Industry Revenue Share (%), by Country 2025 & 2033
- Figure 42: Europe Cell Line Development Industry Volume Share (%), by Country 2025 & 2033
- Figure 43: Asia Pacific Cell Line Development Industry Revenue (billion), by Product 2025 & 2033
- Figure 44: Asia Pacific Cell Line Development Industry Volume (K Unit), by Product 2025 & 2033
- Figure 45: Asia Pacific Cell Line Development Industry Revenue Share (%), by Product 2025 & 2033
- Figure 46: Asia Pacific Cell Line Development Industry Volume Share (%), by Product 2025 & 2033
- Figure 47: Asia Pacific Cell Line Development Industry Revenue (billion), by Source 2025 & 2033
- Figure 48: Asia Pacific Cell Line Development Industry Volume (K Unit), by Source 2025 & 2033
- Figure 49: Asia Pacific Cell Line Development Industry Revenue Share (%), by Source 2025 & 2033
- Figure 50: Asia Pacific Cell Line Development Industry Volume Share (%), by Source 2025 & 2033
- Figure 51: Asia Pacific Cell Line Development Industry Revenue (billion), by Application 2025 & 2033
- Figure 52: Asia Pacific Cell Line Development Industry Volume (K Unit), by Application 2025 & 2033
- Figure 53: Asia Pacific Cell Line Development Industry Revenue Share (%), by Application 2025 & 2033
- Figure 54: Asia Pacific Cell Line Development Industry Volume Share (%), by Application 2025 & 2033
- Figure 55: Asia Pacific Cell Line Development Industry Revenue (billion), by End User 2025 & 2033
- Figure 56: Asia Pacific Cell Line Development Industry Volume (K Unit), by End User 2025 & 2033
- Figure 57: Asia Pacific Cell Line Development Industry Revenue Share (%), by End User 2025 & 2033
- Figure 58: Asia Pacific Cell Line Development Industry Volume Share (%), by End User 2025 & 2033
- Figure 59: Asia Pacific Cell Line Development Industry Revenue (billion), by Country 2025 & 2033
- Figure 60: Asia Pacific Cell Line Development Industry Volume (K Unit), by Country 2025 & 2033
- Figure 61: Asia Pacific Cell Line Development Industry Revenue Share (%), by Country 2025 & 2033
- Figure 62: Asia Pacific Cell Line Development Industry Volume Share (%), by Country 2025 & 2033
- Figure 63: Middle East and Africa Cell Line Development Industry Revenue (billion), by Product 2025 & 2033
- Figure 64: Middle East and Africa Cell Line Development Industry Volume (K Unit), by Product 2025 & 2033
- Figure 65: Middle East and Africa Cell Line Development Industry Revenue Share (%), by Product 2025 & 2033
- Figure 66: Middle East and Africa Cell Line Development Industry Volume Share (%), by Product 2025 & 2033
- Figure 67: Middle East and Africa Cell Line Development Industry Revenue (billion), by Source 2025 & 2033
- Figure 68: Middle East and Africa Cell Line Development Industry Volume (K Unit), by Source 2025 & 2033
- Figure 69: Middle East and Africa Cell Line Development Industry Revenue Share (%), by Source 2025 & 2033
- Figure 70: Middle East and Africa Cell Line Development Industry Volume Share (%), by Source 2025 & 2033
- Figure 71: Middle East and Africa Cell Line Development Industry Revenue (billion), by Application 2025 & 2033
- Figure 72: Middle East and Africa Cell Line Development Industry Volume (K Unit), by Application 2025 & 2033
- Figure 73: Middle East and Africa Cell Line Development Industry Revenue Share (%), by Application 2025 & 2033
- Figure 74: Middle East and Africa Cell Line Development Industry Volume Share (%), by Application 2025 & 2033
- Figure 75: Middle East and Africa Cell Line Development Industry Revenue (billion), by End User 2025 & 2033
- Figure 76: Middle East and Africa Cell Line Development Industry Volume (K Unit), by End User 2025 & 2033
- Figure 77: Middle East and Africa Cell Line Development Industry Revenue Share (%), by End User 2025 & 2033
- Figure 78: Middle East and Africa Cell Line Development Industry Volume Share (%), by End User 2025 & 2033
- Figure 79: Middle East and Africa Cell Line Development Industry Revenue (billion), by Country 2025 & 2033
- Figure 80: Middle East and Africa Cell Line Development Industry Volume (K Unit), by Country 2025 & 2033
- Figure 81: Middle East and Africa Cell Line Development Industry Revenue Share (%), by Country 2025 & 2033
- Figure 82: Middle East and Africa Cell Line Development Industry Volume Share (%), by Country 2025 & 2033
- Figure 83: South America Cell Line Development Industry Revenue (billion), by Product 2025 & 2033
- Figure 84: South America Cell Line Development Industry Volume (K Unit), by Product 2025 & 2033
- Figure 85: South America Cell Line Development Industry Revenue Share (%), by Product 2025 & 2033
- Figure 86: South America Cell Line Development Industry Volume Share (%), by Product 2025 & 2033
- Figure 87: South America Cell Line Development Industry Revenue (billion), by Source 2025 & 2033
- Figure 88: South America Cell Line Development Industry Volume (K Unit), by Source 2025 & 2033
- Figure 89: South America Cell Line Development Industry Revenue Share (%), by Source 2025 & 2033
- Figure 90: South America Cell Line Development Industry Volume Share (%), by Source 2025 & 2033
- Figure 91: South America Cell Line Development Industry Revenue (billion), by Application 2025 & 2033
- Figure 92: South America Cell Line Development Industry Volume (K Unit), by Application 2025 & 2033
- Figure 93: South America Cell Line Development Industry Revenue Share (%), by Application 2025 & 2033
- Figure 94: South America Cell Line Development Industry Volume Share (%), by Application 2025 & 2033
- Figure 95: South America Cell Line Development Industry Revenue (billion), by End User 2025 & 2033
- Figure 96: South America Cell Line Development Industry Volume (K Unit), by End User 2025 & 2033
- Figure 97: South America Cell Line Development Industry Revenue Share (%), by End User 2025 & 2033
- Figure 98: South America Cell Line Development Industry Volume Share (%), by End User 2025 & 2033
- Figure 99: South America Cell Line Development Industry Revenue (billion), by Country 2025 & 2033
- Figure 100: South America Cell Line Development Industry Volume (K Unit), by Country 2025 & 2033
- Figure 101: South America Cell Line Development Industry Revenue Share (%), by Country 2025 & 2033
- Figure 102: South America Cell Line Development Industry Volume Share (%), by Country 2025 & 2033
List of Tables
- Table 1: Global Cell Line Development Industry Revenue billion Forecast, by Product 2020 & 2033
- Table 2: Global Cell Line Development Industry Volume K Unit Forecast, by Product 2020 & 2033
- Table 3: Global Cell Line Development Industry Revenue billion Forecast, by Source 2020 & 2033
- Table 4: Global Cell Line Development Industry Volume K Unit Forecast, by Source 2020 & 2033
- Table 5: Global Cell Line Development Industry Revenue billion Forecast, by Application 2020 & 2033
- Table 6: Global Cell Line Development Industry Volume K Unit Forecast, by Application 2020 & 2033
- Table 7: Global Cell Line Development Industry Revenue billion Forecast, by End User 2020 & 2033
- Table 8: Global Cell Line Development Industry Volume K Unit Forecast, by End User 2020 & 2033
- Table 9: Global Cell Line Development Industry Revenue billion Forecast, by Region 2020 & 2033
- Table 10: Global Cell Line Development Industry Volume K Unit Forecast, by Region 2020 & 2033
- Table 11: Global Cell Line Development Industry Revenue billion Forecast, by Product 2020 & 2033
- Table 12: Global Cell Line Development Industry Volume K Unit Forecast, by Product 2020 & 2033
- Table 13: Global Cell Line Development Industry Revenue billion Forecast, by Source 2020 & 2033
- Table 14: Global Cell Line Development Industry Volume K Unit Forecast, by Source 2020 & 2033
- Table 15: Global Cell Line Development Industry Revenue billion Forecast, by Application 2020 & 2033
- Table 16: Global Cell Line Development Industry Volume K Unit Forecast, by Application 2020 & 2033
- Table 17: Global Cell Line Development Industry Revenue billion Forecast, by End User 2020 & 2033
- Table 18: Global Cell Line Development Industry Volume K Unit Forecast, by End User 2020 & 2033
- Table 19: Global Cell Line Development Industry Revenue billion Forecast, by Country 2020 & 2033
- Table 20: Global Cell Line Development Industry Volume K Unit Forecast, by Country 2020 & 2033
- Table 21: United States Cell Line Development Industry Revenue (billion) Forecast, by Application 2020 & 2033
- Table 22: United States Cell Line Development Industry Volume (K Unit) Forecast, by Application 2020 & 2033
- Table 23: Canada Cell Line Development Industry Revenue (billion) Forecast, by Application 2020 & 2033
- Table 24: Canada Cell Line Development Industry Volume (K Unit) Forecast, by Application 2020 & 2033
- Table 25: Mexico Cell Line Development Industry Revenue (billion) Forecast, by Application 2020 & 2033
- Table 26: Mexico Cell Line Development Industry Volume (K Unit) Forecast, by Application 2020 & 2033
- Table 27: Global Cell Line Development Industry Revenue billion Forecast, by Product 2020 & 2033
- Table 28: Global Cell Line Development Industry Volume K Unit Forecast, by Product 2020 & 2033
- Table 29: Global Cell Line Development Industry Revenue billion Forecast, by Source 2020 & 2033
- Table 30: Global Cell Line Development Industry Volume K Unit Forecast, by Source 2020 & 2033
- Table 31: Global Cell Line Development Industry Revenue billion Forecast, by Application 2020 & 2033
- Table 32: Global Cell Line Development Industry Volume K Unit Forecast, by Application 2020 & 2033
- Table 33: Global Cell Line Development Industry Revenue billion Forecast, by End User 2020 & 2033
- Table 34: Global Cell Line Development Industry Volume K Unit Forecast, by End User 2020 & 2033
- Table 35: Global Cell Line Development Industry Revenue billion Forecast, by Country 2020 & 2033
- Table 36: Global Cell Line Development Industry Volume K Unit Forecast, by Country 2020 & 2033
- Table 37: Germany Cell Line Development Industry Revenue (billion) Forecast, by Application 2020 & 2033
- Table 38: Germany Cell Line Development Industry Volume (K Unit) Forecast, by Application 2020 & 2033
- Table 39: United Kingdom Cell Line Development Industry Revenue (billion) Forecast, by Application 2020 & 2033
- Table 40: United Kingdom Cell Line Development Industry Volume (K Unit) Forecast, by Application 2020 & 2033
- Table 41: France Cell Line Development Industry Revenue (billion) Forecast, by Application 2020 & 2033
- Table 42: France Cell Line Development Industry Volume (K Unit) Forecast, by Application 2020 & 2033
- Table 43: Italy Cell Line Development Industry Revenue (billion) Forecast, by Application 2020 & 2033
- Table 44: Italy Cell Line Development Industry Volume (K Unit) Forecast, by Application 2020 & 2033
- Table 45: Spain Cell Line Development Industry Revenue (billion) Forecast, by Application 2020 & 2033
- Table 46: Spain Cell Line Development Industry Volume (K Unit) Forecast, by Application 2020 & 2033
- Table 47: Rest of Europe Cell Line Development Industry Revenue (billion) Forecast, by Application 2020 & 2033
- Table 48: Rest of Europe Cell Line Development Industry Volume (K Unit) Forecast, by Application 2020 & 2033
- Table 49: Global Cell Line Development Industry Revenue billion Forecast, by Product 2020 & 2033
- Table 50: Global Cell Line Development Industry Volume K Unit Forecast, by Product 2020 & 2033
- Table 51: Global Cell Line Development Industry Revenue billion Forecast, by Source 2020 & 2033
- Table 52: Global Cell Line Development Industry Volume K Unit Forecast, by Source 2020 & 2033
- Table 53: Global Cell Line Development Industry Revenue billion Forecast, by Application 2020 & 2033
- Table 54: Global Cell Line Development Industry Volume K Unit Forecast, by Application 2020 & 2033
- Table 55: Global Cell Line Development Industry Revenue billion Forecast, by End User 2020 & 2033
- Table 56: Global Cell Line Development Industry Volume K Unit Forecast, by End User 2020 & 2033
- Table 57: Global Cell Line Development Industry Revenue billion Forecast, by Country 2020 & 2033
- Table 58: Global Cell Line Development Industry Volume K Unit Forecast, by Country 2020 & 2033
- Table 59: China Cell Line Development Industry Revenue (billion) Forecast, by Application 2020 & 2033
- Table 60: China Cell Line Development Industry Volume (K Unit) Forecast, by Application 2020 & 2033
- Table 61: Japan Cell Line Development Industry Revenue (billion) Forecast, by Application 2020 & 2033
- Table 62: Japan Cell Line Development Industry Volume (K Unit) Forecast, by Application 2020 & 2033
- Table 63: India Cell Line Development Industry Revenue (billion) Forecast, by Application 2020 & 2033
- Table 64: India Cell Line Development Industry Volume (K Unit) Forecast, by Application 2020 & 2033
- Table 65: Australia Cell Line Development Industry Revenue (billion) Forecast, by Application 2020 & 2033
- Table 66: Australia Cell Line Development Industry Volume (K Unit) Forecast, by Application 2020 & 2033
- Table 67: South Korea Cell Line Development Industry Revenue (billion) Forecast, by Application 2020 & 2033
- Table 68: South Korea Cell Line Development Industry Volume (K Unit) Forecast, by Application 2020 & 2033
- Table 69: Rest of Asia Pacific Cell Line Development Industry Revenue (billion) Forecast, by Application 2020 & 2033
- Table 70: Rest of Asia Pacific Cell Line Development Industry Volume (K Unit) Forecast, by Application 2020 & 2033
- Table 71: Global Cell Line Development Industry Revenue billion Forecast, by Product 2020 & 2033
- Table 72: Global Cell Line Development Industry Volume K Unit Forecast, by Product 2020 & 2033
- Table 73: Global Cell Line Development Industry Revenue billion Forecast, by Source 2020 & 2033
- Table 74: Global Cell Line Development Industry Volume K Unit Forecast, by Source 2020 & 2033
- Table 75: Global Cell Line Development Industry Revenue billion Forecast, by Application 2020 & 2033
- Table 76: Global Cell Line Development Industry Volume K Unit Forecast, by Application 2020 & 2033
- Table 77: Global Cell Line Development Industry Revenue billion Forecast, by End User 2020 & 2033
- Table 78: Global Cell Line Development Industry Volume K Unit Forecast, by End User 2020 & 2033
- Table 79: Global Cell Line Development Industry Revenue billion Forecast, by Country 2020 & 2033
- Table 80: Global Cell Line Development Industry Volume K Unit Forecast, by Country 2020 & 2033
- Table 81: GCC Cell Line Development Industry Revenue (billion) Forecast, by Application 2020 & 2033
- Table 82: GCC Cell Line Development Industry Volume (K Unit) Forecast, by Application 2020 & 2033
- Table 83: South Africa Cell Line Development Industry Revenue (billion) Forecast, by Application 2020 & 2033
- Table 84: South Africa Cell Line Development Industry Volume (K Unit) Forecast, by Application 2020 & 2033
- Table 85: Rest of Middle East and Africa Cell Line Development Industry Revenue (billion) Forecast, by Application 2020 & 2033
- Table 86: Rest of Middle East and Africa Cell Line Development Industry Volume (K Unit) Forecast, by Application 2020 & 2033
- Table 87: Global Cell Line Development Industry Revenue billion Forecast, by Product 2020 & 2033
- Table 88: Global Cell Line Development Industry Volume K Unit Forecast, by Product 2020 & 2033
- Table 89: Global Cell Line Development Industry Revenue billion Forecast, by Source 2020 & 2033
- Table 90: Global Cell Line Development Industry Volume K Unit Forecast, by Source 2020 & 2033
- Table 91: Global Cell Line Development Industry Revenue billion Forecast, by Application 2020 & 2033
- Table 92: Global Cell Line Development Industry Volume K Unit Forecast, by Application 2020 & 2033
- Table 93: Global Cell Line Development Industry Revenue billion Forecast, by End User 2020 & 2033
- Table 94: Global Cell Line Development Industry Volume K Unit Forecast, by End User 2020 & 2033
- Table 95: Global Cell Line Development Industry Revenue billion Forecast, by Country 2020 & 2033
- Table 96: Global Cell Line Development Industry Volume K Unit Forecast, by Country 2020 & 2033
- Table 97: Brazil Cell Line Development Industry Revenue (billion) Forecast, by Application 2020 & 2033
- Table 98: Brazil Cell Line Development Industry Volume (K Unit) Forecast, by Application 2020 & 2033
- Table 99: Argentina Cell Line Development Industry Revenue (billion) Forecast, by Application 2020 & 2033
- Table 100: Argentina Cell Line Development Industry Volume (K Unit) Forecast, by Application 2020 & 2033
- Table 101: Rest of South America Cell Line Development Industry Revenue (billion) Forecast, by Application 2020 & 2033
- Table 102: Rest of South America Cell Line Development Industry Volume (K Unit) Forecast, by Application 2020 & 2033
Frequently Asked Questions
1. What is the projected Compound Annual Growth Rate (CAGR) of the Cell Line Development Industry?
The projected CAGR is approximately 6.4%.
2. Which companies are prominent players in the Cell Line Development Industry?
Key companies in the market include Promega Corporation, Merck KGaA, Sartorius AG, Danaher Corporation, Selexis SA, Fujifilm Corporation (Fujifilm Diosynth Biotechnologies), American Type Culture Collection (ATCC), WuXi Biologics, Thermo Fisher Scientific, Corning Incorporated.
3. What are the main segments of the Cell Line Development Industry?
The market segments include Product, Source, Application, End User.
4. Can you provide details about the market size?
The market size is estimated to be USD 4.2 billion as of 2022.
5. What are some drivers contributing to market growth?
Growing Biopharmaceutical Industry; Rising Demand for Monoclonal Antibodies and Cancer Therapeutics; Growing Production of Biosimilars Due to the Patent Expiry of Branded Therapeutics.
6. What are the notable trends driving market growth?
Mammalian Cell Line Development is Expected to Register Rapid Growth Over the Forecast Period.
7. Are there any restraints impacting market growth?
Strict Regulations; Time Taking Process.
8. Can you provide examples of recent developments in the market?
In July 2022, ProBioGen and Granite Bio Collaborate to Provide GMP Manufacturing and Cell Line Development Services. A novel monoclonal antibody developed by Granite Bio is the company's top contender for the treatment of autoimmune and specific cancer indications. By using the DirectedLuck transposase.
9. What pricing options are available for accessing the report?
Pricing options include single-user, multi-user, and enterprise licenses priced at USD 4750, USD 5250, and USD 8750 respectively.
10. Is the market size provided in terms of value or volume?
The market size is provided in terms of value, measured in billion and volume, measured in K Unit.
11. Are there any specific market keywords associated with the report?
Yes, the market keyword associated with the report is "Cell Line Development Industry," which aids in identifying and referencing the specific market segment covered.
12. How do I determine which pricing option suits my needs best?
The pricing options vary based on user requirements and access needs. Individual users may opt for single-user licenses, while businesses requiring broader access may choose multi-user or enterprise licenses for cost-effective access to the report.
13. Are there any additional resources or data provided in the Cell Line Development Industry report?
While the report offers comprehensive insights, it's advisable to review the specific contents or supplementary materials provided to ascertain if additional resources or data are available.
14. How can I stay updated on further developments or reports in the Cell Line Development Industry?
To stay informed about further developments, trends, and reports in the Cell Line Development Industry, consider subscribing to industry newsletters, following relevant companies and organizations, or regularly checking reputable industry news sources and publications.
Methodology
Step 1 - Identification of Relevant Samples Size from Population Database


Step 2 - Approaches for Defining Global Market Size (Value, Volume* & Price*)

Note*: In applicable scenarios
Step 3 - Data Sources
Primary Research
- Web Analytics
- Survey Reports
- Research Institute
- Latest Research Reports
- Opinion Leaders
Secondary Research
- Annual Reports
- White Paper
- Latest Press Release
- Industry Association
- Paid Database
- Investor Presentations

Step 4 - Data Triangulation
Involves using different sources of information in order to increase the validity of a study
These sources are likely to be stakeholders in a program - participants, other researchers, program staff, other community members, and so on.
Then we put all data in single framework & apply various statistical tools to find out the dynamic on the market.
During the analysis stage, feedback from the stakeholder groups would be compared to determine areas of agreement as well as areas of divergence