
Key Insights
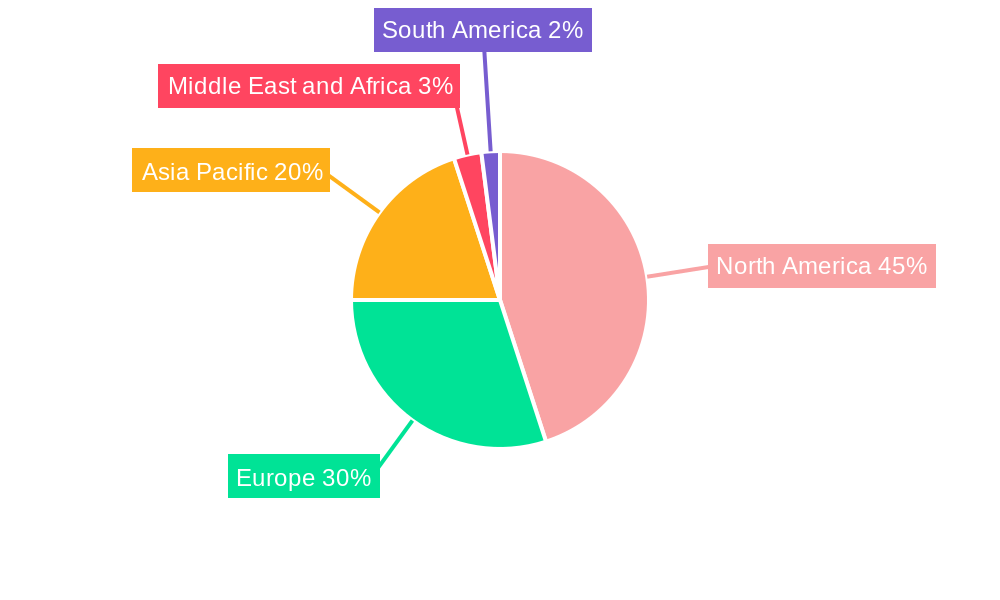
The global cell viability assays market, valued at $1.74 billion in 2025, is projected to experience robust growth, driven by the escalating demand for advanced drug discovery and development tools. The market's Compound Annual Growth Rate (CAGR) of 7.70% from 2025 to 2033 indicates a significant expansion, fueled by increasing investments in research and development across various sectors like pharmaceuticals, biotechnology, and academia. Key growth drivers include the rising prevalence of chronic diseases necessitating extensive drug screening, the burgeoning field of personalized medicine demanding precise cellular analysis, and the increasing adoption of high-throughput screening technologies for faster and more efficient drug discovery processes. Furthermore, technological advancements in assay methodologies, resulting in enhanced sensitivity and specificity, are contributing to market expansion. The market is segmented by product type (consumables and instruments) and application (drug discovery and development, stem cell research, clinical and diagnostic applications, and others). The consumables segment is expected to dominate, reflecting the high consumption rate of reagents and kits in various assays. Geographically, North America currently holds a substantial market share due to the presence of leading pharmaceutical companies and advanced research infrastructure; however, the Asia-Pacific region is anticipated to witness the fastest growth rate during the forecast period, driven by rising healthcare expenditure and growing investments in research and development in emerging economies like China and India. Competitive forces within the market include both large multinational corporations and specialized biotechnology firms, each contributing to innovation and market dynamism.
While North America currently leads, the Asia-Pacific region is poised for significant growth. This is fueled by increasing healthcare spending and a burgeoning life sciences research sector in countries like China and India. The market's expansion is not without its challenges. Regulatory hurdles associated with new assay technologies and the high cost of advanced instrumentation can potentially hinder market growth. However, the overall outlook remains positive, driven by the continuous need for improved and efficient cell viability assessment techniques in various research and clinical settings. The market’s fragmentation, with the presence of both large multinational players and specialized smaller companies, fosters innovation and competition, leading to further advancements in the technology.

Cell Viability Assays Industry Report: 2019-2033
This comprehensive report provides an in-depth analysis of the Cell Viability Assays industry, offering valuable insights for industry professionals, investors, and researchers. Covering the period from 2019 to 2033, with a focus on 2025, this report unveils market dynamics, key players, and future growth opportunities. The global market size in 2025 is estimated at $XX Million.
Cell Viability Assays Industry Market Structure & Innovation Trends
The Cell Viability Assays market is moderately concentrated, with several major players holding significant market share. Promega Corporation, Merck KGaA, Thermo Fischer Scientific Inc, Bio-Rad Laboratories, and Becton Dickinson & Company are among the leading companies, collectively accounting for approximately xx% of the global market in 2025. Market share data for other players like Canvax Biotech, Creative Bioarray, GE Healthcare, Abcam PLC, Biotek Instruments, and Perkin Elmer are included in the full report.
Innovation is driven by the increasing demand for high-throughput screening assays, automation, and improved sensitivity in drug discovery and development. Regulatory frameworks, particularly those related to drug approvals and clinical trials, heavily influence market growth. Substitutes for cell viability assays exist but are often less specific or sensitive. The end-user demographics are diverse, including pharmaceutical companies, biotechnology firms, academic research institutions, and diagnostic laboratories. M&A activities in the industry have been relatively moderate in recent years, with deal values averaging $XX Million per transaction (based on xx deals analyzed in the historical period). The majority of M&A deals focused on expanding product portfolios and geographical reach.
- Market Concentration: Moderately concentrated, with top 5 players controlling xx% of the market (2025).
- Innovation Drivers: High-throughput screening, automation, improved sensitivity.
- Regulatory Landscape: Stringent regulations impacting drug discovery and development.
- M&A Activity: Moderate activity with average deal values of $XX Million.

Cell Viability Assays Industry Market Dynamics & Trends
The Cell Viability Assays market is experiencing robust growth, driven by factors such as the rising prevalence of chronic diseases, increasing investments in drug discovery and development, and the growing adoption of advanced cell-based assays. The market is projected to witness a CAGR of xx% during the forecast period (2025-2033). Technological disruptions, such as the development of novel assay platforms and improved imaging techniques, are enhancing the accuracy and efficiency of cell viability assessments. Consumer preferences are shifting towards automated, high-throughput assays with improved data analysis capabilities. Competitive dynamics are shaping the market landscape, with companies focusing on product differentiation, strategic partnerships, and technological advancements to gain market share. Market penetration in key regions like North America and Europe remains high, but growth is expected in emerging economies due to increased healthcare spending and research activities.
Dominant Regions & Segments in Cell Viability Assays Industry
North America currently holds the largest market share in the Cell Viability Assays industry, driven by robust R&D investments, a well-established healthcare infrastructure, and the presence of key market players. Europe follows as the second largest market, with strong pharmaceutical and biotechnology sectors.
Key Drivers by Region:
- North America: High R&D spending, advanced healthcare infrastructure, strong presence of major players.
- Europe: Developed pharmaceutical and biotechnology sector, supportive regulatory environment.
- Asia Pacific: Rapidly growing healthcare sector, increasing R&D investments, expanding clinical trials infrastructure.
Dominant Segments:
- By Product: Consumables (reagents, kits) dominate the market due to higher demand and recurring revenue streams. The instruments segment is expected to showcase significant growth, due to technological advancements and the preference for automation.
- By Application: Drug discovery and development is the leading application segment, driven by the high demand for cell viability assays in preclinical and clinical studies. Stem cell research is a rapidly growing segment, driven by increasing application in regenerative medicine and personalized medicine. Clinical and diagnostic applications are expected to showcase growth due to technological advancements and expansion of the clinical diagnostics market.
Cell Viability Assays Industry Product Innovations
Recent innovations focus on improving assay sensitivity, throughput, and automation. Miniaturization of assays, integration with advanced imaging technologies, and development of multiplex assays allowing simultaneous measurement of multiple cellular parameters are key technological trends. These innovations are enhancing the efficiency and cost-effectiveness of cell viability assessments, leading to wider market adoption across research and clinical settings. The focus is on creating user-friendly platforms and providing robust data analysis tools to cater to diverse end-user needs.
Report Scope & Segmentation Analysis
This report provides a comprehensive segmentation analysis of the Cell Viability Assays market.
By Product:
Consumables: This segment includes reagents, kits, and other consumables used in cell viability assays. It holds a significant market share due to high demand and recurring revenue. The segment is expected to experience xx% growth during the forecast period, driven by increasing applications in drug discovery and other related fields.
Instruments: This segment comprises the instruments used for conducting cell viability assays, including plate readers, flow cytometers, and microscopes. Growth in this segment will be driven by the demand for automation and high-throughput screening. It is projected to grow at a CAGR of xx% during the forecast period.
By Application:
- Drug Discovery and Development: This is the largest segment due to the extensive use of cell viability assays in preclinical and clinical drug development. This segment is projected to maintain its dominant position, with a growth rate of xx% during the forecast period.
- Stem Cell Research: This is a rapidly growing segment, driven by increasing applications of stem cells in regenerative medicine and personalized medicine. This segment is anticipated to grow at a CAGR of xx% in the forecast period.
- Clinical and Diagnostic Applications: This segment is expected to see significant growth, driven by technological advancements and expansion in the clinical diagnostics market. The segment will grow at a CAGR of xx% over the forecast period.
- Other Applications: This segment covers other uses of cell viability assays, such as environmental testing and toxicology studies. This segment is expected to witness moderate growth.
Key Drivers of Cell Viability Assays Industry Growth
Several key factors are fueling the growth of the Cell Viability Assays industry. The rising prevalence of chronic diseases globally necessitates increased research and development of new therapies, creating a significant demand for cell viability assays. Technological advancements, such as the development of more sensitive and automated assays, are improving the efficiency and accuracy of these tests. Increased funding for research in areas such as drug discovery and stem cell research also boosts market demand. Favorable regulatory policies supporting the development and use of cell-based assays further contribute to market growth.
Challenges in the Cell Viability Assays Industry Sector
The Cell Viability Assays industry faces several challenges, including the high cost of assays, especially advanced and automated systems. Supply chain disruptions can affect the availability of reagents and instruments. Intense competition among established players and emerging companies creates pressure on pricing and profitability. Stringent regulatory approvals for new assays can delay product launches and increase development costs. The development of sophisticated new assays, therefore, needs to address affordability to reach a wider market.
Emerging Opportunities in Cell Viability Assays Industry
Emerging opportunities exist in the development of novel assay platforms based on advanced technologies like microfluidics and lab-on-a-chip devices. The growing adoption of personalized medicine necessitates the development of more specialized and customized cell viability assays. Expansion into emerging markets with growing healthcare expenditure presents significant opportunities. Furthermore, the integration of artificial intelligence and machine learning in data analysis offers potential for improved accuracy and efficiency.
Leading Players in the Cell Viability Assays Industry Market
- Canvax Biotech
- Promega Corporation
- Merck KGaA
- Creative Bioarray
- Creative Bioarray
- Becton Dickinson & Company
- GE Healthcare
- Abcam PLC
- Thermo Fischer Scientific Inc
- Bio-Rad Laboratories
- Biotek Instruments
- Perkin Elmer
Key Developments in Cell Viability Assays Industry
September 2022: Nanolive launched the LIVE Cell Death Assay, an automated solution for profiling cell health, death, apoptosis, and necrosis. This launch signifies a move toward more comprehensive and automated cell analysis, potentially disrupting the market with a more efficient and informative assay.
March 2022: Biovica decided to establish a CLIA lab in San Diego, California. This expansion signifies increased access to Biovica's DiviTumTKa-analysis, driving growth in the clinical diagnostics segment of the market in the US.
Future Outlook for Cell Viability Assays Industry Market
The future of the Cell Viability Assays market looks promising, driven by continued technological innovation, expansion into new applications, and increasing demand from the pharmaceutical and biotechnology industries. The market is poised for significant growth, driven by increasing demand for high-throughput screening, personalized medicine, and advanced diagnostic tools. Strategic collaborations and partnerships will play a crucial role in shaping the competitive landscape. The focus on developing more sensitive, cost-effective, and user-friendly assays will drive market expansion across various research and clinical applications.
Cell Viability Assays Industry Segmentation
-
1. Product
-
1.1. Consumables
- 1.1.1. Reagents
- 1.1.2. Assay Kits
- 1.1.3. Other Consumables
-
1.2. By Instruments
- 1.2.1. Automated Cell Counters
- 1.2.2. Flow Cytometers
- 1.2.3. Spectrophotometers
- 1.2.4. Other Instruments
-
1.1. Consumables
-
2. Application
- 2.1. Drug Discovery and Development
- 2.2. Stem Cell Research
- 2.3. Clinical and Diagnostic Applications
- 2.4. Other Applications
Cell Viability Assays Industry Segmentation By Geography
-
1. North America
- 1.1. United States
- 1.2. Canada
- 1.3. Mexico
-
2. Europe
- 2.1. Germany
- 2.2. United Kingdom
- 2.3. France
- 2.4. Italy
- 2.5. Spain
- 2.6. Rest of Europe
-
3. Asia Pacific
- 3.1. China
- 3.2. Japan
- 3.3. India
- 3.4. Australia
- 3.5. South Korea
- 3.6. Rest of Asia Pacific
-
4. Middle East and Africa
- 4.1. GCC
- 4.2. South Africa
- 4.3. Rest of Middle East and Africa
-
5. South America
- 5.1. Brazil
- 5.2. Argentina
- 5.3. Rest of South America
Cell Viability Assays Industry REPORT HIGHLIGHTS
| Aspects | Details |
|---|---|
| Study Period | 2019-2033 |
| Base Year | 2024 |
| Estimated Year | 2025 |
| Forecast Period | 2025-2033 |
| Historical Period | 2019-2024 |
| Growth Rate | CAGR of 7.70% from 2019-2033 |
| Segmentation |
|
Table of Contents
- 1. Introduction
- 1.1. Research Scope
- 1.2. Market Segmentation
- 1.3. Research Methodology
- 1.4. Definitions and Assumptions
- 2. Executive Summary
- 2.1. Introduction
- 3. Market Dynamics
- 3.1. Introduction
- 3.2. Market Drivers
- 3.2.1. Growing Burden of Chronic and Infectious Diseases; Rising Demand for Cell-based Assays in Research; Increasing Focus on the Development of Cell-based Therapeutics
- 3.3. Market Restrains
- 3.3.1. Limitations of the Assays
- 3.4. Market Trends
- 3.4.1. Stem Cell Research Segment is Estimated to Register A Significant Growth Over the Forecast Period
- 4. Market Factor Analysis
- 4.1. Porters Five Forces
- 4.2. Supply/Value Chain
- 4.3. PESTEL analysis
- 4.4. Market Entropy
- 4.5. Patent/Trademark Analysis
- 5. Global Cell Viability Assays Industry Analysis, Insights and Forecast, 2019-2031
- 5.1. Market Analysis, Insights and Forecast - by Product
- 5.1.1. Consumables
- 5.1.1.1. Reagents
- 5.1.1.2. Assay Kits
- 5.1.1.3. Other Consumables
- 5.1.2. By Instruments
- 5.1.2.1. Automated Cell Counters
- 5.1.2.2. Flow Cytometers
- 5.1.2.3. Spectrophotometers
- 5.1.2.4. Other Instruments
- 5.1.1. Consumables
- 5.2. Market Analysis, Insights and Forecast - by Application
- 5.2.1. Drug Discovery and Development
- 5.2.2. Stem Cell Research
- 5.2.3. Clinical and Diagnostic Applications
- 5.2.4. Other Applications
- 5.3. Market Analysis, Insights and Forecast - by Region
- 5.3.1. North America
- 5.3.2. Europe
- 5.3.3. Asia Pacific
- 5.3.4. Middle East and Africa
- 5.3.5. South America
- 5.1. Market Analysis, Insights and Forecast - by Product
- 6. North America Cell Viability Assays Industry Analysis, Insights and Forecast, 2019-2031
- 6.1. Market Analysis, Insights and Forecast - by Product
- 6.1.1. Consumables
- 6.1.1.1. Reagents
- 6.1.1.2. Assay Kits
- 6.1.1.3. Other Consumables
- 6.1.2. By Instruments
- 6.1.2.1. Automated Cell Counters
- 6.1.2.2. Flow Cytometers
- 6.1.2.3. Spectrophotometers
- 6.1.2.4. Other Instruments
- 6.1.1. Consumables
- 6.2. Market Analysis, Insights and Forecast - by Application
- 6.2.1. Drug Discovery and Development
- 6.2.2. Stem Cell Research
- 6.2.3. Clinical and Diagnostic Applications
- 6.2.4. Other Applications
- 6.1. Market Analysis, Insights and Forecast - by Product
- 7. Europe Cell Viability Assays Industry Analysis, Insights and Forecast, 2019-2031
- 7.1. Market Analysis, Insights and Forecast - by Product
- 7.1.1. Consumables
- 7.1.1.1. Reagents
- 7.1.1.2. Assay Kits
- 7.1.1.3. Other Consumables
- 7.1.2. By Instruments
- 7.1.2.1. Automated Cell Counters
- 7.1.2.2. Flow Cytometers
- 7.1.2.3. Spectrophotometers
- 7.1.2.4. Other Instruments
- 7.1.1. Consumables
- 7.2. Market Analysis, Insights and Forecast - by Application
- 7.2.1. Drug Discovery and Development
- 7.2.2. Stem Cell Research
- 7.2.3. Clinical and Diagnostic Applications
- 7.2.4. Other Applications
- 7.1. Market Analysis, Insights and Forecast - by Product
- 8. Asia Pacific Cell Viability Assays Industry Analysis, Insights and Forecast, 2019-2031
- 8.1. Market Analysis, Insights and Forecast - by Product
- 8.1.1. Consumables
- 8.1.1.1. Reagents
- 8.1.1.2. Assay Kits
- 8.1.1.3. Other Consumables
- 8.1.2. By Instruments
- 8.1.2.1. Automated Cell Counters
- 8.1.2.2. Flow Cytometers
- 8.1.2.3. Spectrophotometers
- 8.1.2.4. Other Instruments
- 8.1.1. Consumables
- 8.2. Market Analysis, Insights and Forecast - by Application
- 8.2.1. Drug Discovery and Development
- 8.2.2. Stem Cell Research
- 8.2.3. Clinical and Diagnostic Applications
- 8.2.4. Other Applications
- 8.1. Market Analysis, Insights and Forecast - by Product
- 9. Middle East and Africa Cell Viability Assays Industry Analysis, Insights and Forecast, 2019-2031
- 9.1. Market Analysis, Insights and Forecast - by Product
- 9.1.1. Consumables
- 9.1.1.1. Reagents
- 9.1.1.2. Assay Kits
- 9.1.1.3. Other Consumables
- 9.1.2. By Instruments
- 9.1.2.1. Automated Cell Counters
- 9.1.2.2. Flow Cytometers
- 9.1.2.3. Spectrophotometers
- 9.1.2.4. Other Instruments
- 9.1.1. Consumables
- 9.2. Market Analysis, Insights and Forecast - by Application
- 9.2.1. Drug Discovery and Development
- 9.2.2. Stem Cell Research
- 9.2.3. Clinical and Diagnostic Applications
- 9.2.4. Other Applications
- 9.1. Market Analysis, Insights and Forecast - by Product
- 10. South America Cell Viability Assays Industry Analysis, Insights and Forecast, 2019-2031
- 10.1. Market Analysis, Insights and Forecast - by Product
- 10.1.1. Consumables
- 10.1.1.1. Reagents
- 10.1.1.2. Assay Kits
- 10.1.1.3. Other Consumables
- 10.1.2. By Instruments
- 10.1.2.1. Automated Cell Counters
- 10.1.2.2. Flow Cytometers
- 10.1.2.3. Spectrophotometers
- 10.1.2.4. Other Instruments
- 10.1.1. Consumables
- 10.2. Market Analysis, Insights and Forecast - by Application
- 10.2.1. Drug Discovery and Development
- 10.2.2. Stem Cell Research
- 10.2.3. Clinical and Diagnostic Applications
- 10.2.4. Other Applications
- 10.1. Market Analysis, Insights and Forecast - by Product
- 11. North America Cell Viability Assays Industry Analysis, Insights and Forecast, 2019-2031
- 11.1. Market Analysis, Insights and Forecast - By Country/Sub-region
- 11.1.1 United States
- 11.1.2 Canada
- 11.1.3 Mexico
- 12. Europe Cell Viability Assays Industry Analysis, Insights and Forecast, 2019-2031
- 12.1. Market Analysis, Insights and Forecast - By Country/Sub-region
- 12.1.1 Germany
- 12.1.2 United Kingdom
- 12.1.3 France
- 12.1.4 Italy
- 12.1.5 Spain
- 12.1.6 Rest of Europe
- 13. Asia Pacific Cell Viability Assays Industry Analysis, Insights and Forecast, 2019-2031
- 13.1. Market Analysis, Insights and Forecast - By Country/Sub-region
- 13.1.1 China
- 13.1.2 Japan
- 13.1.3 India
- 13.1.4 Australia
- 13.1.5 South Korea
- 13.1.6 Rest of Asia Pacific
- 14. Middle East and Africa Cell Viability Assays Industry Analysis, Insights and Forecast, 2019-2031
- 14.1. Market Analysis, Insights and Forecast - By Country/Sub-region
- 14.1.1 GCC
- 14.1.2 South Africa
- 14.1.3 Rest of Middle East and Africa
- 15. South America Cell Viability Assays Industry Analysis, Insights and Forecast, 2019-2031
- 15.1. Market Analysis, Insights and Forecast - By Country/Sub-region
- 15.1.1 Brazil
- 15.1.2 Argentina
- 15.1.3 Rest of South America
- 16. Competitive Analysis
- 16.1. Global Market Share Analysis 2024
- 16.2. Company Profiles
- 16.2.1 Canvax Biotech
- 16.2.1.1. Overview
- 16.2.1.2. Products
- 16.2.1.3. SWOT Analysis
- 16.2.1.4. Recent Developments
- 16.2.1.5. Financials (Based on Availability)
- 16.2.2 Promega Corporation
- 16.2.2.1. Overview
- 16.2.2.2. Products
- 16.2.2.3. SWOT Analysis
- 16.2.2.4. Recent Developments
- 16.2.2.5. Financials (Based on Availability)
- 16.2.3 Merck KGaA
- 16.2.3.1. Overview
- 16.2.3.2. Products
- 16.2.3.3. SWOT Analysis
- 16.2.3.4. Recent Developments
- 16.2.3.5. Financials (Based on Availability)
- 16.2.4 Creative Bioarray
- 16.2.4.1. Overview
- 16.2.4.2. Products
- 16.2.4.3. SWOT Analysis
- 16.2.4.4. Recent Developments
- 16.2.4.5. Financials (Based on Availability)
- 16.2.5 Creative Bioarray
- 16.2.5.1. Overview
- 16.2.5.2. Products
- 16.2.5.3. SWOT Analysis
- 16.2.5.4. Recent Developments
- 16.2.5.5. Financials (Based on Availability)
- 16.2.6 Becton Dickinson & Company
- 16.2.6.1. Overview
- 16.2.6.2. Products
- 16.2.6.3. SWOT Analysis
- 16.2.6.4. Recent Developments
- 16.2.6.5. Financials (Based on Availability)
- 16.2.7 GE Healthcare
- 16.2.7.1. Overview
- 16.2.7.2. Products
- 16.2.7.3. SWOT Analysis
- 16.2.7.4. Recent Developments
- 16.2.7.5. Financials (Based on Availability)
- 16.2.8 Abcam PLC
- 16.2.8.1. Overview
- 16.2.8.2. Products
- 16.2.8.3. SWOT Analysis
- 16.2.8.4. Recent Developments
- 16.2.8.5. Financials (Based on Availability)
- 16.2.9 Thermo Fischer Scientific Inc
- 16.2.9.1. Overview
- 16.2.9.2. Products
- 16.2.9.3. SWOT Analysis
- 16.2.9.4. Recent Developments
- 16.2.9.5. Financials (Based on Availability)
- 16.2.10 Bio-Rad Laboratories
- 16.2.10.1. Overview
- 16.2.10.2. Products
- 16.2.10.3. SWOT Analysis
- 16.2.10.4. Recent Developments
- 16.2.10.5. Financials (Based on Availability)
- 16.2.11 Biotek Instruments
- 16.2.11.1. Overview
- 16.2.11.2. Products
- 16.2.11.3. SWOT Analysis
- 16.2.11.4. Recent Developments
- 16.2.11.5. Financials (Based on Availability)
- 16.2.12 Perkin Elmer
- 16.2.12.1. Overview
- 16.2.12.2. Products
- 16.2.12.3. SWOT Analysis
- 16.2.12.4. Recent Developments
- 16.2.12.5. Financials (Based on Availability)
- 16.2.1 Canvax Biotech
List of Figures
- Figure 1: Global Cell Viability Assays Industry Revenue Breakdown (Million, %) by Region 2024 & 2032
- Figure 2: North America Cell Viability Assays Industry Revenue (Million), by Country 2024 & 2032
- Figure 3: North America Cell Viability Assays Industry Revenue Share (%), by Country 2024 & 2032
- Figure 4: Europe Cell Viability Assays Industry Revenue (Million), by Country 2024 & 2032
- Figure 5: Europe Cell Viability Assays Industry Revenue Share (%), by Country 2024 & 2032
- Figure 6: Asia Pacific Cell Viability Assays Industry Revenue (Million), by Country 2024 & 2032
- Figure 7: Asia Pacific Cell Viability Assays Industry Revenue Share (%), by Country 2024 & 2032
- Figure 8: Middle East and Africa Cell Viability Assays Industry Revenue (Million), by Country 2024 & 2032
- Figure 9: Middle East and Africa Cell Viability Assays Industry Revenue Share (%), by Country 2024 & 2032
- Figure 10: South America Cell Viability Assays Industry Revenue (Million), by Country 2024 & 2032
- Figure 11: South America Cell Viability Assays Industry Revenue Share (%), by Country 2024 & 2032
- Figure 12: North America Cell Viability Assays Industry Revenue (Million), by Product 2024 & 2032
- Figure 13: North America Cell Viability Assays Industry Revenue Share (%), by Product 2024 & 2032
- Figure 14: North America Cell Viability Assays Industry Revenue (Million), by Application 2024 & 2032
- Figure 15: North America Cell Viability Assays Industry Revenue Share (%), by Application 2024 & 2032
- Figure 16: North America Cell Viability Assays Industry Revenue (Million), by Country 2024 & 2032
- Figure 17: North America Cell Viability Assays Industry Revenue Share (%), by Country 2024 & 2032
- Figure 18: Europe Cell Viability Assays Industry Revenue (Million), by Product 2024 & 2032
- Figure 19: Europe Cell Viability Assays Industry Revenue Share (%), by Product 2024 & 2032
- Figure 20: Europe Cell Viability Assays Industry Revenue (Million), by Application 2024 & 2032
- Figure 21: Europe Cell Viability Assays Industry Revenue Share (%), by Application 2024 & 2032
- Figure 22: Europe Cell Viability Assays Industry Revenue (Million), by Country 2024 & 2032
- Figure 23: Europe Cell Viability Assays Industry Revenue Share (%), by Country 2024 & 2032
- Figure 24: Asia Pacific Cell Viability Assays Industry Revenue (Million), by Product 2024 & 2032
- Figure 25: Asia Pacific Cell Viability Assays Industry Revenue Share (%), by Product 2024 & 2032
- Figure 26: Asia Pacific Cell Viability Assays Industry Revenue (Million), by Application 2024 & 2032
- Figure 27: Asia Pacific Cell Viability Assays Industry Revenue Share (%), by Application 2024 & 2032
- Figure 28: Asia Pacific Cell Viability Assays Industry Revenue (Million), by Country 2024 & 2032
- Figure 29: Asia Pacific Cell Viability Assays Industry Revenue Share (%), by Country 2024 & 2032
- Figure 30: Middle East and Africa Cell Viability Assays Industry Revenue (Million), by Product 2024 & 2032
- Figure 31: Middle East and Africa Cell Viability Assays Industry Revenue Share (%), by Product 2024 & 2032
- Figure 32: Middle East and Africa Cell Viability Assays Industry Revenue (Million), by Application 2024 & 2032
- Figure 33: Middle East and Africa Cell Viability Assays Industry Revenue Share (%), by Application 2024 & 2032
- Figure 34: Middle East and Africa Cell Viability Assays Industry Revenue (Million), by Country 2024 & 2032
- Figure 35: Middle East and Africa Cell Viability Assays Industry Revenue Share (%), by Country 2024 & 2032
- Figure 36: South America Cell Viability Assays Industry Revenue (Million), by Product 2024 & 2032
- Figure 37: South America Cell Viability Assays Industry Revenue Share (%), by Product 2024 & 2032
- Figure 38: South America Cell Viability Assays Industry Revenue (Million), by Application 2024 & 2032
- Figure 39: South America Cell Viability Assays Industry Revenue Share (%), by Application 2024 & 2032
- Figure 40: South America Cell Viability Assays Industry Revenue (Million), by Country 2024 & 2032
- Figure 41: South America Cell Viability Assays Industry Revenue Share (%), by Country 2024 & 2032
List of Tables
- Table 1: Global Cell Viability Assays Industry Revenue Million Forecast, by Region 2019 & 2032
- Table 2: Global Cell Viability Assays Industry Revenue Million Forecast, by Product 2019 & 2032
- Table 3: Global Cell Viability Assays Industry Revenue Million Forecast, by Application 2019 & 2032
- Table 4: Global Cell Viability Assays Industry Revenue Million Forecast, by Region 2019 & 2032
- Table 5: Global Cell Viability Assays Industry Revenue Million Forecast, by Country 2019 & 2032
- Table 6: United States Cell Viability Assays Industry Revenue (Million) Forecast, by Application 2019 & 2032
- Table 7: Canada Cell Viability Assays Industry Revenue (Million) Forecast, by Application 2019 & 2032
- Table 8: Mexico Cell Viability Assays Industry Revenue (Million) Forecast, by Application 2019 & 2032
- Table 9: Global Cell Viability Assays Industry Revenue Million Forecast, by Country 2019 & 2032
- Table 10: Germany Cell Viability Assays Industry Revenue (Million) Forecast, by Application 2019 & 2032
- Table 11: United Kingdom Cell Viability Assays Industry Revenue (Million) Forecast, by Application 2019 & 2032
- Table 12: France Cell Viability Assays Industry Revenue (Million) Forecast, by Application 2019 & 2032
- Table 13: Italy Cell Viability Assays Industry Revenue (Million) Forecast, by Application 2019 & 2032
- Table 14: Spain Cell Viability Assays Industry Revenue (Million) Forecast, by Application 2019 & 2032
- Table 15: Rest of Europe Cell Viability Assays Industry Revenue (Million) Forecast, by Application 2019 & 2032
- Table 16: Global Cell Viability Assays Industry Revenue Million Forecast, by Country 2019 & 2032
- Table 17: China Cell Viability Assays Industry Revenue (Million) Forecast, by Application 2019 & 2032
- Table 18: Japan Cell Viability Assays Industry Revenue (Million) Forecast, by Application 2019 & 2032
- Table 19: India Cell Viability Assays Industry Revenue (Million) Forecast, by Application 2019 & 2032
- Table 20: Australia Cell Viability Assays Industry Revenue (Million) Forecast, by Application 2019 & 2032
- Table 21: South Korea Cell Viability Assays Industry Revenue (Million) Forecast, by Application 2019 & 2032
- Table 22: Rest of Asia Pacific Cell Viability Assays Industry Revenue (Million) Forecast, by Application 2019 & 2032
- Table 23: Global Cell Viability Assays Industry Revenue Million Forecast, by Country 2019 & 2032
- Table 24: GCC Cell Viability Assays Industry Revenue (Million) Forecast, by Application 2019 & 2032
- Table 25: South Africa Cell Viability Assays Industry Revenue (Million) Forecast, by Application 2019 & 2032
- Table 26: Rest of Middle East and Africa Cell Viability Assays Industry Revenue (Million) Forecast, by Application 2019 & 2032
- Table 27: Global Cell Viability Assays Industry Revenue Million Forecast, by Country 2019 & 2032
- Table 28: Brazil Cell Viability Assays Industry Revenue (Million) Forecast, by Application 2019 & 2032
- Table 29: Argentina Cell Viability Assays Industry Revenue (Million) Forecast, by Application 2019 & 2032
- Table 30: Rest of South America Cell Viability Assays Industry Revenue (Million) Forecast, by Application 2019 & 2032
- Table 31: Global Cell Viability Assays Industry Revenue Million Forecast, by Product 2019 & 2032
- Table 32: Global Cell Viability Assays Industry Revenue Million Forecast, by Application 2019 & 2032
- Table 33: Global Cell Viability Assays Industry Revenue Million Forecast, by Country 2019 & 2032
- Table 34: United States Cell Viability Assays Industry Revenue (Million) Forecast, by Application 2019 & 2032
- Table 35: Canada Cell Viability Assays Industry Revenue (Million) Forecast, by Application 2019 & 2032
- Table 36: Mexico Cell Viability Assays Industry Revenue (Million) Forecast, by Application 2019 & 2032
- Table 37: Global Cell Viability Assays Industry Revenue Million Forecast, by Product 2019 & 2032
- Table 38: Global Cell Viability Assays Industry Revenue Million Forecast, by Application 2019 & 2032
- Table 39: Global Cell Viability Assays Industry Revenue Million Forecast, by Country 2019 & 2032
- Table 40: Germany Cell Viability Assays Industry Revenue (Million) Forecast, by Application 2019 & 2032
- Table 41: United Kingdom Cell Viability Assays Industry Revenue (Million) Forecast, by Application 2019 & 2032
- Table 42: France Cell Viability Assays Industry Revenue (Million) Forecast, by Application 2019 & 2032
- Table 43: Italy Cell Viability Assays Industry Revenue (Million) Forecast, by Application 2019 & 2032
- Table 44: Spain Cell Viability Assays Industry Revenue (Million) Forecast, by Application 2019 & 2032
- Table 45: Rest of Europe Cell Viability Assays Industry Revenue (Million) Forecast, by Application 2019 & 2032
- Table 46: Global Cell Viability Assays Industry Revenue Million Forecast, by Product 2019 & 2032
- Table 47: Global Cell Viability Assays Industry Revenue Million Forecast, by Application 2019 & 2032
- Table 48: Global Cell Viability Assays Industry Revenue Million Forecast, by Country 2019 & 2032
- Table 49: China Cell Viability Assays Industry Revenue (Million) Forecast, by Application 2019 & 2032
- Table 50: Japan Cell Viability Assays Industry Revenue (Million) Forecast, by Application 2019 & 2032
- Table 51: India Cell Viability Assays Industry Revenue (Million) Forecast, by Application 2019 & 2032
- Table 52: Australia Cell Viability Assays Industry Revenue (Million) Forecast, by Application 2019 & 2032
- Table 53: South Korea Cell Viability Assays Industry Revenue (Million) Forecast, by Application 2019 & 2032
- Table 54: Rest of Asia Pacific Cell Viability Assays Industry Revenue (Million) Forecast, by Application 2019 & 2032
- Table 55: Global Cell Viability Assays Industry Revenue Million Forecast, by Product 2019 & 2032
- Table 56: Global Cell Viability Assays Industry Revenue Million Forecast, by Application 2019 & 2032
- Table 57: Global Cell Viability Assays Industry Revenue Million Forecast, by Country 2019 & 2032
- Table 58: GCC Cell Viability Assays Industry Revenue (Million) Forecast, by Application 2019 & 2032
- Table 59: South Africa Cell Viability Assays Industry Revenue (Million) Forecast, by Application 2019 & 2032
- Table 60: Rest of Middle East and Africa Cell Viability Assays Industry Revenue (Million) Forecast, by Application 2019 & 2032
- Table 61: Global Cell Viability Assays Industry Revenue Million Forecast, by Product 2019 & 2032
- Table 62: Global Cell Viability Assays Industry Revenue Million Forecast, by Application 2019 & 2032
- Table 63: Global Cell Viability Assays Industry Revenue Million Forecast, by Country 2019 & 2032
- Table 64: Brazil Cell Viability Assays Industry Revenue (Million) Forecast, by Application 2019 & 2032
- Table 65: Argentina Cell Viability Assays Industry Revenue (Million) Forecast, by Application 2019 & 2032
- Table 66: Rest of South America Cell Viability Assays Industry Revenue (Million) Forecast, by Application 2019 & 2032
Frequently Asked Questions
1. What is the projected Compound Annual Growth Rate (CAGR) of the Cell Viability Assays Industry?
The projected CAGR is approximately 7.70%.
2. Which companies are prominent players in the Cell Viability Assays Industry?
Key companies in the market include Canvax Biotech, Promega Corporation, Merck KGaA, Creative Bioarray, Creative Bioarray, Becton Dickinson & Company, GE Healthcare, Abcam PLC, Thermo Fischer Scientific Inc, Bio-Rad Laboratories, Biotek Instruments, Perkin Elmer.
3. What are the main segments of the Cell Viability Assays Industry?
The market segments include Product, Application.
4. Can you provide details about the market size?
The market size is estimated to be USD 1.74 Million as of 2022.
5. What are some drivers contributing to market growth?
Growing Burden of Chronic and Infectious Diseases; Rising Demand for Cell-based Assays in Research; Increasing Focus on the Development of Cell-based Therapeutics.
6. What are the notable trends driving market growth?
Stem Cell Research Segment is Estimated to Register A Significant Growth Over the Forecast Period.
7. Are there any restraints impacting market growth?
Limitations of the Assays.
8. Can you provide examples of recent developments in the market?
September 2022: Nanolive launched the LIVE Cell Death Assay, an automated solution for profiling cell health, death, apoptosis, and necrosis.
9. What pricing options are available for accessing the report?
Pricing options include single-user, multi-user, and enterprise licenses priced at USD 4750, USD 5250, and USD 8750 respectively.
10. Is the market size provided in terms of value or volume?
The market size is provided in terms of value, measured in Million.
11. Are there any specific market keywords associated with the report?
Yes, the market keyword associated with the report is "Cell Viability Assays Industry," which aids in identifying and referencing the specific market segment covered.
12. How do I determine which pricing option suits my needs best?
The pricing options vary based on user requirements and access needs. Individual users may opt for single-user licenses, while businesses requiring broader access may choose multi-user or enterprise licenses for cost-effective access to the report.
13. Are there any additional resources or data provided in the Cell Viability Assays Industry report?
While the report offers comprehensive insights, it's advisable to review the specific contents or supplementary materials provided to ascertain if additional resources or data are available.
14. How can I stay updated on further developments or reports in the Cell Viability Assays Industry?
To stay informed about further developments, trends, and reports in the Cell Viability Assays Industry, consider subscribing to industry newsletters, following relevant companies and organizations, or regularly checking reputable industry news sources and publications.
Methodology
Step 1 - Identification of Relevant Samples Size from Population Database


Step 2 - Approaches for Defining Global Market Size (Value, Volume* & Price*)

Note*: In applicable scenarios
Step 3 - Data Sources
Primary Research
- Web Analytics
- Survey Reports
- Research Institute
- Latest Research Reports
- Opinion Leaders
Secondary Research
- Annual Reports
- White Paper
- Latest Press Release
- Industry Association
- Paid Database
- Investor Presentations

Step 4 - Data Triangulation
Involves using different sources of information in order to increase the validity of a study
These sources are likely to be stakeholders in a program - participants, other researchers, program staff, other community members, and so on.
Then we put all data in single framework & apply various statistical tools to find out the dynamic on the market.
During the analysis stage, feedback from the stakeholder groups would be compared to determine areas of agreement as well as areas of divergence


