

Key Insights
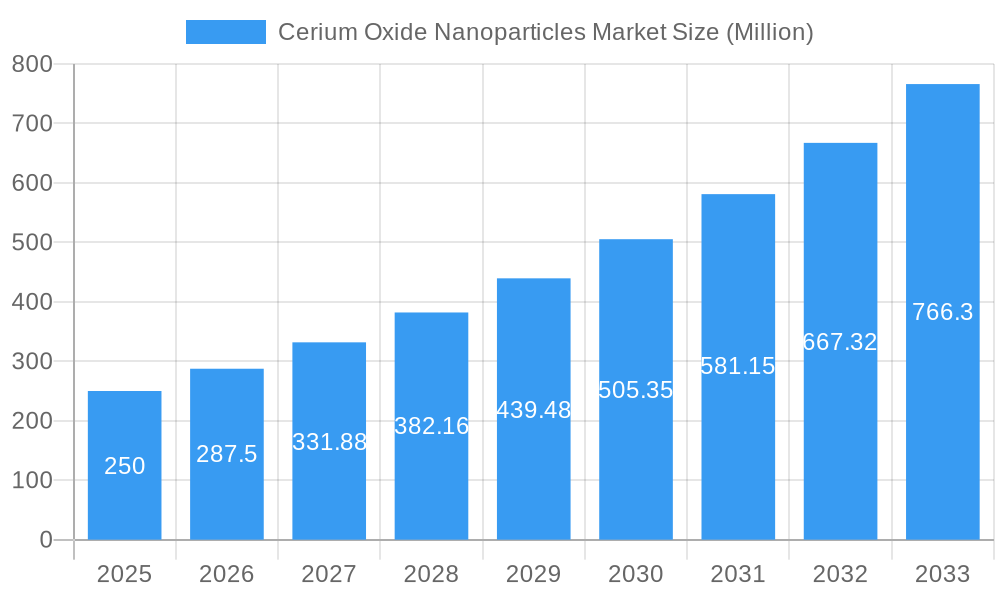
The Cerium Oxide Nanoparticles market is projected for substantial expansion, driven by escalating demand across various sectors. With a projected market size of $0.84 billion by 2025 and a Compound Annual Growth Rate (CAGR) of 14%, significant growth is anticipated throughout the forecast period. Key growth catalysts include the expanding electronics sector, particularly for Chemical Mechanical Planarization (CMP) and polishing applications, where the unique properties of cerium oxide nanoparticles are vital for achieving superior surface finishes in semiconductor manufacturing. The burgeoning biomedical field is also a significant contributor, with increasing adoption in drug delivery and bioimaging. Additionally, the energy storage sector is experiencing robust growth, utilizing cerium oxide nanoparticles' redox capabilities in advanced battery technologies. While regulatory hurdles and potential health concerns present challenges, technological advancements and a focus on sustainability are expected to mitigate these restraints. Market segmentation indicates that dispersions hold a dominant share due to their versatility and ease of integration. Geographically, North America leads in market development, supported by a mature semiconductor industry and strong R&D investment. Asia-Pacific, especially China and India, exhibits rapid growth driven by expanding manufacturing bases and increased investment in advanced materials.
Cerium Oxide Nanoparticles Market Market Size (In Million)
The competitive environment features established global players alongside dynamic regional entrants. Strategic collaborations and market consolidation are emerging trends aimed at enhancing technological capabilities and expanding market reach. Future market expansion will be further propelled by innovations in nanoparticle synthesis, focusing on improved quality, cost-effectiveness, and eco-friendly production methods. Ongoing research in catalysis and biomedical imaging applications will also fuel demand, reinforcing the upward trajectory of the cerium oxide nanoparticles market. Increased investment in renewable energy sectors is expected to contribute further to market growth.
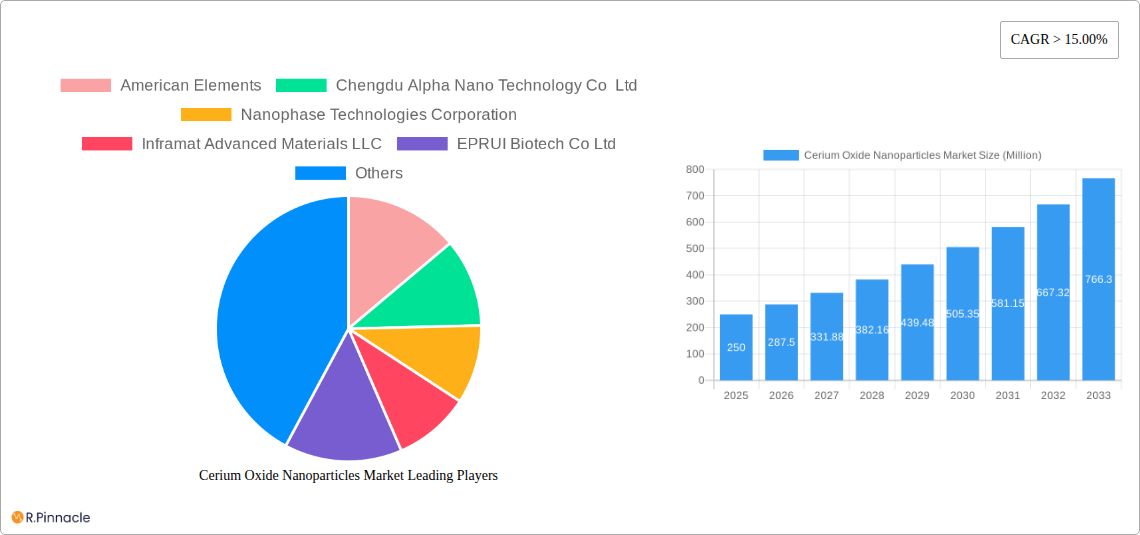
Cerium Oxide Nanoparticles Market Company Market Share
This comprehensive report offers an in-depth analysis of the Cerium Oxide Nanoparticles market, providing critical insights for industry stakeholders. The study covers the period from 2019 to 2033, with a base year of 2025 and a forecast period of 2025-2033. Market segmentation includes form (Dispersion, Powder) and application (Chemical Mechanical Planarization (CMP), Polishing Agent, Catalyst, Biomedical, Energy Storage, Others). Key market players, including American Elements, Chengdu Alpha Nano Technology Co Ltd, and Nanophase Technologies Corporation, are profiled, with their market share and strategies analyzed. The estimated market size in 2025 is $0.84 billion.
Cerium Oxide Nanoparticles Market Market Structure & Innovation Trends
The Cerium Oxide Nanoparticles market exhibits a moderately concentrated structure, with a few major players holding significant market share. American Elements and Nanophase Technologies Corporation, for instance, are estimated to collectively hold approximately xx% of the market in 2025. However, the presence of numerous smaller players, particularly in regional markets, indicates a competitive landscape. Innovation within the sector is driven primarily by advancements in nanoparticle synthesis techniques, leading to improved particle size control, enhanced purity, and tailored functional properties. Regulatory frameworks, particularly those concerning the safe handling and disposal of nanomaterials, significantly influence market growth. Substitutes for cerium oxide nanoparticles are limited, enhancing the market's stability. Recent M&A activities in the nanomaterials sector, while not directly concentrated within Cerium Oxide Nanoparticles, indicate a trend towards consolidation. The estimated total value of M&A deals related to nanomaterials in the last 5 years is approximately xx Million.
- Market Concentration: Moderately concentrated, with top players holding xx% market share in 2025.
- Innovation Drivers: Advanced synthesis techniques, improved purity & functionalization.
- Regulatory Landscape: Stringent regulations impacting handling and disposal.
- Product Substitutes: Limited viable substitutes.
- M&A Activity: Consolidation trend observed in the broader nanomaterials sector.
Cerium Oxide Nanoparticles Market Market Dynamics & Trends
The Cerium Oxide Nanoparticles market is projected to experience a CAGR of xx% during the forecast period (2025-2033). This growth is primarily driven by increasing demand from the chemical mechanical planarization (CMP) and polishing agent sectors within the semiconductor industry. The rising adoption of cerium oxide nanoparticles in biomedical applications, such as drug delivery and diagnostics, also contributes significantly. Technological disruptions, like the development of more efficient and cost-effective synthesis methods, are further fueling market expansion. Consumer preferences are shifting towards eco-friendly and sustainable materials, presenting an opportunity for manufacturers to highlight the environmental benefits of cerium oxide nanoparticles in specific applications. Competitive dynamics are characterized by both price competition and innovation-driven differentiation. Market penetration is highest in the CMP application, with an estimated xx% market share in 2025.
Dominant Regions & Segments in Cerium Oxide Nanoparticles Market
The Asia-Pacific region is projected to dominate the Cerium Oxide Nanoparticles market during the forecast period, driven by robust growth in the semiconductor and electronics industries in countries like China, South Korea, and Taiwan. The Chemical Mechanical Planarization (CMP) segment holds the largest market share, owing to its extensive use in polishing silicon wafers for semiconductor manufacturing. The Powder form dominates the market, accounting for xx% of the total market value in 2025.
Key Drivers in Asia-Pacific: Rapid industrialization, substantial investments in semiconductor manufacturing, supportive government policies.
CMP Segment Dominance: High demand from semiconductor industry.
Powder Form Predominance: Cost-effectiveness and ease of handling.
North America: Strong presence of key players and robust R&D activities.
Europe: Growing adoption in biomedical and catalytic applications.
Cerium Oxide Nanoparticles Market Product Innovations
Recent product innovations focus on improving the size uniformity and dispersibility of cerium oxide nanoparticles, enhancing their performance in various applications. New formulations with improved biocompatibility are being developed for biomedical applications, while modified surface coatings are being explored to enhance their catalytic activity. These innovations are aimed at addressing the specific needs of diverse end-users and enhancing the market competitiveness of various players.
Report Scope & Segmentation Analysis
This report segments the Cerium Oxide Nanoparticles market by form (Dispersion, Powder) and application (Chemical Mechanical Planarization (CMP), Polishing Agent, Catalyst, Biomedical, Energy Storage, Others). Each segment's growth is projected based on various factors, including application-specific demand and technological advancements. The competitive landscape within each segment is also analyzed, identifying key players and their respective market shares. Growth projections vary across segments, with the CMP segment expected to exhibit the highest growth rate due to robust semiconductor industry demand.
Key Drivers of Cerium Oxide Nanoparticles Market Growth
The market's growth is propelled by several factors:
- Rising demand from the semiconductor industry: The increasing production of electronic devices drives demand for CMP applications.
- Expanding biomedical applications: Use in drug delivery and diagnostics fuel market growth.
- Technological advancements: Improved synthesis methods reduce production costs.
- Growing environmental awareness: Cerium oxide nanoparticles offer advantages in pollution control applications.
Challenges in the Cerium Oxide Nanoparticles Market Sector
The Cerium Oxide Nanoparticles market faces several challenges:
- Stricter environmental regulations: The safe handling and disposal of nanomaterials pose a significant challenge.
- Supply chain disruptions: Dependence on raw materials and manufacturing capabilities can cause supply chain instability.
- Price competition: The presence of numerous players can lead to intense price competition.
- Toxicity concerns: Addressing potential health and environmental risks is critical.
Emerging Opportunities in Cerium Oxide Nanoparticles Market
Emerging opportunities include:
- Expanding applications in renewable energy: Use in fuel cells and solar cells.
- Developing new formulations for specific applications: Tailoring particle properties for niche markets.
- Exploring novel synthesis methods: Reducing production costs and improving sustainability.
Leading Players in the Cerium Oxide Nanoparticles Market Market
- American Elements
- Chengdu Alpha Nano Technology Co Ltd
- Nanophase Technologies Corporation
- Inframat Advanced Materials LLC
- EPRUI Biotech Co Ltd
- Nanostructured & Amorphous Materials Inc
- Advanced Nano Products Co Ltd
- Cerion LLC
- Meliorum Technologies Inc
- Strem Chemicals Inc
- NYACOL Nano Technologies Inc
- SkySpring Nanomaterials Inc
Key Developments in Cerium Oxide Nanoparticles Market Industry
- 2022-Q4: Nanophase Technologies Corporation launched a new line of high-purity cerium oxide nanoparticles.
- 2023-Q1: American Elements announced a strategic partnership to expand its distribution network.
- (Further developments to be added based on available data.)
Future Outlook for Cerium Oxide Nanoparticles Market Market
The future outlook for the Cerium Oxide Nanoparticles market remains positive, with continued growth driven by technological advancements and expanding applications. The market is expected to benefit from increased demand across various sectors, particularly in electronics, biomedical, and energy storage. Strategic collaborations and investments in R&D will play a crucial role in driving future growth and innovation. The market is poised for substantial expansion, offering significant opportunities for both established players and new entrants.
Cerium Oxide Nanoparticles Market Segmentation
-
1. Form
- 1.1. Dispersion
- 1.2. Powder
-
2. Application
- 2.1. Chemical Mechanical Planarization (CMP)
- 2.2. Polishing Agent
- 2.3. Catalyst
- 2.4. Biomedical
- 2.5. Energy Storage
- 2.6. Others
Cerium Oxide Nanoparticles Market Segmentation By Geography
-
1. Asia Pacific
- 1.1. China
- 1.2. India
- 1.3. Japan
- 1.4. South Korea
- 1.5. Rest of Asia Pacific
-
2. North America
- 2.1. United States
- 2.2. Canada
- 2.3. Mexico
-
3. Europe
- 3.1. Germany
- 3.2. United Kingdom
- 3.3. France
- 3.4. Italy
- 3.5. Rest of Europe
-
4. Rest of the World
- 4.1. South America
- 4.2. Middle East and Africa
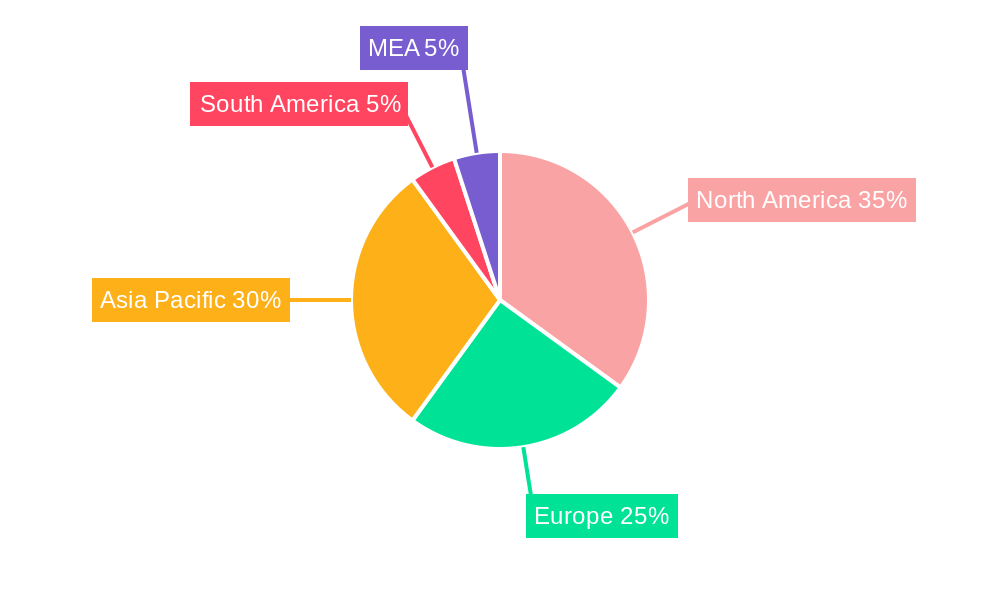
Cerium Oxide Nanoparticles Market Regional Market Share
Geographic Coverage of Cerium Oxide Nanoparticles Market
Cerium Oxide Nanoparticles Market REPORT HIGHLIGHTS
| Aspects | Details |
|---|---|
| Study Period | 2020-2034 |
| Base Year | 2025 |
| Estimated Year | 2026 |
| Forecast Period | 2026-2034 |
| Historical Period | 2020-2025 |
| Growth Rate | CAGR of 14% from 2020-2034 |
| Segmentation |
|
Table of Contents
- 1. Introduction
- 1.1. Research Scope
- 1.2. Market Segmentation
- 1.3. Research Objective
- 1.4. Definitions and Assumptions
- 2. Executive Summary
- 2.1. Market Snapshot
- 3. Market Dynamics
- 3.1. Market Drivers
- 3.2. Market Restrains
- 3.3. Market Trends
- 3.4. Market Opportunities
- 4. Market Factor Analysis
- 4.1. Porters Five Forces
- 4.1.1. Bargaining Power of Suppliers
- 4.1.2. Bargaining Power of Buyers
- 4.1.3. Threat of New Entrants
- 4.1.4. Threat of Substitutes
- 4.1.5. Competitive Rivalry
- 4.2. PESTEL analysis
- 4.3. BCG Analysis
- 4.3.1. Stars (High Growth, High Market Share)
- 4.3.2. Cash Cows (Low Growth, High Market Share)
- 4.3.3. Question Mark (High Growth, Low Market Share)
- 4.3.4. Dogs (Low Growth, Low Market Share)
- 4.4. Ansoff Matrix Analysis
- 4.5. Supply Chain Analysis
- 4.6. Regulatory Landscape
- 4.7. Current Market Potential and Opportunity Assessment (TAM–SAM–SOM Framework)
- 4.8. PRI Analyst Note
- 4.1. Porters Five Forces
- 5. Market Analysis, Insights and Forecast 2021-2033
- 5.1. Market Analysis, Insights and Forecast - by Form
- 5.1.1. Dispersion
- 5.1.2. Powder
- 5.2. Market Analysis, Insights and Forecast - by Application
- 5.2.1. Chemical Mechanical Planarization (CMP)
- 5.2.2. Polishing Agent
- 5.2.3. Catalyst
- 5.2.4. Biomedical
- 5.2.5. Energy Storage
- 5.2.6. Others
- 5.3. Market Analysis, Insights and Forecast - by Region
- 5.3.1. Asia Pacific
- 5.3.2. North America
- 5.3.3. Europe
- 5.3.4. Rest of the World
- 5.1. Market Analysis, Insights and Forecast - by Form
- 6. Global Cerium Oxide Nanoparticles Market Analysis, Insights and Forecast, 2021-2033
- 6.1. Market Analysis, Insights and Forecast - by Form
- 6.1.1. Dispersion
- 6.1.2. Powder
- 6.2. Market Analysis, Insights and Forecast - by Application
- 6.2.1. Chemical Mechanical Planarization (CMP)
- 6.2.2. Polishing Agent
- 6.2.3. Catalyst
- 6.2.4. Biomedical
- 6.2.5. Energy Storage
- 6.2.6. Others
- 6.1. Market Analysis, Insights and Forecast - by Form
- 7. Asia Pacific Cerium Oxide Nanoparticles Market Analysis, Insights and Forecast, 2020-2032
- 7.1. Market Analysis, Insights and Forecast - by Form
- 7.1.1. Dispersion
- 7.1.2. Powder
- 7.2. Market Analysis, Insights and Forecast - by Application
- 7.2.1. Chemical Mechanical Planarization (CMP)
- 7.2.2. Polishing Agent
- 7.2.3. Catalyst
- 7.2.4. Biomedical
- 7.2.5. Energy Storage
- 7.2.6. Others
- 7.1. Market Analysis, Insights and Forecast - by Form
- 8. North America Cerium Oxide Nanoparticles Market Analysis, Insights and Forecast, 2020-2032
- 8.1. Market Analysis, Insights and Forecast - by Form
- 8.1.1. Dispersion
- 8.1.2. Powder
- 8.2. Market Analysis, Insights and Forecast - by Application
- 8.2.1. Chemical Mechanical Planarization (CMP)
- 8.2.2. Polishing Agent
- 8.2.3. Catalyst
- 8.2.4. Biomedical
- 8.2.5. Energy Storage
- 8.2.6. Others
- 8.1. Market Analysis, Insights and Forecast - by Form
- 9. Europe Cerium Oxide Nanoparticles Market Analysis, Insights and Forecast, 2020-2032
- 9.1. Market Analysis, Insights and Forecast - by Form
- 9.1.1. Dispersion
- 9.1.2. Powder
- 9.2. Market Analysis, Insights and Forecast - by Application
- 9.2.1. Chemical Mechanical Planarization (CMP)
- 9.2.2. Polishing Agent
- 9.2.3. Catalyst
- 9.2.4. Biomedical
- 9.2.5. Energy Storage
- 9.2.6. Others
- 9.1. Market Analysis, Insights and Forecast - by Form
- 10. Rest of the World Cerium Oxide Nanoparticles Market Analysis, Insights and Forecast, 2020-2032
- 10.1. Market Analysis, Insights and Forecast - by Form
- 10.1.1. Dispersion
- 10.1.2. Powder
- 10.2. Market Analysis, Insights and Forecast - by Application
- 10.2.1. Chemical Mechanical Planarization (CMP)
- 10.2.2. Polishing Agent
- 10.2.3. Catalyst
- 10.2.4. Biomedical
- 10.2.5. Energy Storage
- 10.2.6. Others
- 10.1. Market Analysis, Insights and Forecast - by Form
- 11. Competitive Analysis
- 11.1. Company Profiles
- 11.1.1 American Elements
- 11.1.1.1. Company Overview
- 11.1.1.2. Products
- 11.1.1.3. Company Financials
- 11.1.1.4. SWOT Analysis
- 11.1.2 Chengdu Alpha Nano Technology Co Ltd
- 11.1.2.1. Company Overview
- 11.1.2.2. Products
- 11.1.2.3. Company Financials
- 11.1.2.4. SWOT Analysis
- 11.1.3 Nanophase Technologies Corporation
- 11.1.3.1. Company Overview
- 11.1.3.2. Products
- 11.1.3.3. Company Financials
- 11.1.3.4. SWOT Analysis
- 11.1.4 Inframat Advanced Materials LLC
- 11.1.4.1. Company Overview
- 11.1.4.2. Products
- 11.1.4.3. Company Financials
- 11.1.4.4. SWOT Analysis
- 11.1.5 EPRUI Biotech Co Ltd
- 11.1.5.1. Company Overview
- 11.1.5.2. Products
- 11.1.5.3. Company Financials
- 11.1.5.4. SWOT Analysis
- 11.1.6 Nanostructured & Amorphous Materials Inc
- 11.1.6.1. Company Overview
- 11.1.6.2. Products
- 11.1.6.3. Company Financials
- 11.1.6.4. SWOT Analysis
- 11.1.7 Advanced Nano Products Co Ltd
- 11.1.7.1. Company Overview
- 11.1.7.2. Products
- 11.1.7.3. Company Financials
- 11.1.7.4. SWOT Analysis
- 11.1.8 Cerion LLC
- 11.1.8.1. Company Overview
- 11.1.8.2. Products
- 11.1.8.3. Company Financials
- 11.1.8.4. SWOT Analysis
- 11.1.9 Meliorum Technologies Inc
- 11.1.9.1. Company Overview
- 11.1.9.2. Products
- 11.1.9.3. Company Financials
- 11.1.9.4. SWOT Analysis
- 11.1.10 Strem Chemicals Inc *List Not Exhaustive
- 11.1.10.1. Company Overview
- 11.1.10.2. Products
- 11.1.10.3. Company Financials
- 11.1.10.4. SWOT Analysis
- 11.1.11 NYACOL Nano Technologies Inc
- 11.1.11.1. Company Overview
- 11.1.11.2. Products
- 11.1.11.3. Company Financials
- 11.1.11.4. SWOT Analysis
- 11.1.12 SkySpring Nanomaterials Inc
- 11.1.12.1. Company Overview
- 11.1.12.2. Products
- 11.1.12.3. Company Financials
- 11.1.12.4. SWOT Analysis
- 11.1.1 American Elements
- 11.2. Market Entropy
- 11.2.1 Company's Key Areas Served
- 11.2.2 Recent Developments
- 11.3. Company Market Share Analysis 2025
- 11.3.1 Top 5 Companies Market Share Analysis
- 11.3.2 Top 3 Companies Market Share Analysis
- 11.4. List of Potential Customers
- 12. Research Methodology
List of Figures
- Figure 1: Global Cerium Oxide Nanoparticles Market Revenue Breakdown (billion, %) by Region 2025 & 2033
- Figure 2: Asia Pacific Cerium Oxide Nanoparticles Market Revenue (billion), by Form 2025 & 2033
- Figure 3: Asia Pacific Cerium Oxide Nanoparticles Market Revenue Share (%), by Form 2025 & 2033
- Figure 4: Asia Pacific Cerium Oxide Nanoparticles Market Revenue (billion), by Application 2025 & 2033
- Figure 5: Asia Pacific Cerium Oxide Nanoparticles Market Revenue Share (%), by Application 2025 & 2033
- Figure 6: Asia Pacific Cerium Oxide Nanoparticles Market Revenue (billion), by Country 2025 & 2033
- Figure 7: Asia Pacific Cerium Oxide Nanoparticles Market Revenue Share (%), by Country 2025 & 2033
- Figure 8: North America Cerium Oxide Nanoparticles Market Revenue (billion), by Form 2025 & 2033
- Figure 9: North America Cerium Oxide Nanoparticles Market Revenue Share (%), by Form 2025 & 2033
- Figure 10: North America Cerium Oxide Nanoparticles Market Revenue (billion), by Application 2025 & 2033
- Figure 11: North America Cerium Oxide Nanoparticles Market Revenue Share (%), by Application 2025 & 2033
- Figure 12: North America Cerium Oxide Nanoparticles Market Revenue (billion), by Country 2025 & 2033
- Figure 13: North America Cerium Oxide Nanoparticles Market Revenue Share (%), by Country 2025 & 2033
- Figure 14: Europe Cerium Oxide Nanoparticles Market Revenue (billion), by Form 2025 & 2033
- Figure 15: Europe Cerium Oxide Nanoparticles Market Revenue Share (%), by Form 2025 & 2033
- Figure 16: Europe Cerium Oxide Nanoparticles Market Revenue (billion), by Application 2025 & 2033
- Figure 17: Europe Cerium Oxide Nanoparticles Market Revenue Share (%), by Application 2025 & 2033
- Figure 18: Europe Cerium Oxide Nanoparticles Market Revenue (billion), by Country 2025 & 2033
- Figure 19: Europe Cerium Oxide Nanoparticles Market Revenue Share (%), by Country 2025 & 2033
- Figure 20: Rest of the World Cerium Oxide Nanoparticles Market Revenue (billion), by Form 2025 & 2033
- Figure 21: Rest of the World Cerium Oxide Nanoparticles Market Revenue Share (%), by Form 2025 & 2033
- Figure 22: Rest of the World Cerium Oxide Nanoparticles Market Revenue (billion), by Application 2025 & 2033
- Figure 23: Rest of the World Cerium Oxide Nanoparticles Market Revenue Share (%), by Application 2025 & 2033
- Figure 24: Rest of the World Cerium Oxide Nanoparticles Market Revenue (billion), by Country 2025 & 2033
- Figure 25: Rest of the World Cerium Oxide Nanoparticles Market Revenue Share (%), by Country 2025 & 2033
List of Tables
- Table 1: Global Cerium Oxide Nanoparticles Market Revenue billion Forecast, by Form 2020 & 2033
- Table 2: Global Cerium Oxide Nanoparticles Market Revenue billion Forecast, by Application 2020 & 2033
- Table 3: Global Cerium Oxide Nanoparticles Market Revenue billion Forecast, by Region 2020 & 2033
- Table 4: Global Cerium Oxide Nanoparticles Market Revenue billion Forecast, by Form 2020 & 2033
- Table 5: Global Cerium Oxide Nanoparticles Market Revenue billion Forecast, by Application 2020 & 2033
- Table 6: Global Cerium Oxide Nanoparticles Market Revenue billion Forecast, by Country 2020 & 2033
- Table 7: China Cerium Oxide Nanoparticles Market Revenue (billion) Forecast, by Application 2020 & 2033
- Table 8: India Cerium Oxide Nanoparticles Market Revenue (billion) Forecast, by Application 2020 & 2033
- Table 9: Japan Cerium Oxide Nanoparticles Market Revenue (billion) Forecast, by Application 2020 & 2033
- Table 10: South Korea Cerium Oxide Nanoparticles Market Revenue (billion) Forecast, by Application 2020 & 2033
- Table 11: Rest of Asia Pacific Cerium Oxide Nanoparticles Market Revenue (billion) Forecast, by Application 2020 & 2033
- Table 12: Global Cerium Oxide Nanoparticles Market Revenue billion Forecast, by Form 2020 & 2033
- Table 13: Global Cerium Oxide Nanoparticles Market Revenue billion Forecast, by Application 2020 & 2033
- Table 14: Global Cerium Oxide Nanoparticles Market Revenue billion Forecast, by Country 2020 & 2033
- Table 15: United States Cerium Oxide Nanoparticles Market Revenue (billion) Forecast, by Application 2020 & 2033
- Table 16: Canada Cerium Oxide Nanoparticles Market Revenue (billion) Forecast, by Application 2020 & 2033
- Table 17: Mexico Cerium Oxide Nanoparticles Market Revenue (billion) Forecast, by Application 2020 & 2033
- Table 18: Global Cerium Oxide Nanoparticles Market Revenue billion Forecast, by Form 2020 & 2033
- Table 19: Global Cerium Oxide Nanoparticles Market Revenue billion Forecast, by Application 2020 & 2033
- Table 20: Global Cerium Oxide Nanoparticles Market Revenue billion Forecast, by Country 2020 & 2033
- Table 21: Germany Cerium Oxide Nanoparticles Market Revenue (billion) Forecast, by Application 2020 & 2033
- Table 22: United Kingdom Cerium Oxide Nanoparticles Market Revenue (billion) Forecast, by Application 2020 & 2033
- Table 23: France Cerium Oxide Nanoparticles Market Revenue (billion) Forecast, by Application 2020 & 2033
- Table 24: Italy Cerium Oxide Nanoparticles Market Revenue (billion) Forecast, by Application 2020 & 2033
- Table 25: Rest of Europe Cerium Oxide Nanoparticles Market Revenue (billion) Forecast, by Application 2020 & 2033
- Table 26: Global Cerium Oxide Nanoparticles Market Revenue billion Forecast, by Form 2020 & 2033
- Table 27: Global Cerium Oxide Nanoparticles Market Revenue billion Forecast, by Application 2020 & 2033
- Table 28: Global Cerium Oxide Nanoparticles Market Revenue billion Forecast, by Country 2020 & 2033
- Table 29: South America Cerium Oxide Nanoparticles Market Revenue (billion) Forecast, by Application 2020 & 2033
- Table 30: Middle East and Africa Cerium Oxide Nanoparticles Market Revenue (billion) Forecast, by Application 2020 & 2033
Frequently Asked Questions
1. What is the projected Compound Annual Growth Rate (CAGR) of the Cerium Oxide Nanoparticles Market?
The projected CAGR is approximately 14%.
2. Which companies are prominent players in the Cerium Oxide Nanoparticles Market?
Key companies in the market include American Elements, Chengdu Alpha Nano Technology Co Ltd, Nanophase Technologies Corporation, Inframat Advanced Materials LLC, EPRUI Biotech Co Ltd, Nanostructured & Amorphous Materials Inc, Advanced Nano Products Co Ltd, Cerion LLC, Meliorum Technologies Inc, Strem Chemicals Inc *List Not Exhaustive, NYACOL Nano Technologies Inc, SkySpring Nanomaterials Inc.
3. What are the main segments of the Cerium Oxide Nanoparticles Market?
The market segments include Form, Application.
4. Can you provide details about the market size?
The market size is estimated to be USD 0.84 billion as of 2022.
5. What are some drivers contributing to market growth?
; Growing Demand from Semiconductor Industry; Rising Polishing Agent Utilization.
6. What are the notable trends driving market growth?
Chemical Mechanical Planarization (CMP) Segment to Dominate the Market.
7. Are there any restraints impacting market growth?
; Toxic Nature at High Concentration; Unfavorable Conditions Arising Due to COVID-19 Outbreak.
8. Can you provide examples of recent developments in the market?
N/A
9. What pricing options are available for accessing the report?
Pricing options include single-user, multi-user, and enterprise licenses priced at USD 4750, USD 5250, and USD 8750 respectively.
10. Is the market size provided in terms of value or volume?
The market size is provided in terms of value, measured in billion.
11. Are there any specific market keywords associated with the report?
Yes, the market keyword associated with the report is "Cerium Oxide Nanoparticles Market," which aids in identifying and referencing the specific market segment covered.
12. How do I determine which pricing option suits my needs best?
The pricing options vary based on user requirements and access needs. Individual users may opt for single-user licenses, while businesses requiring broader access may choose multi-user or enterprise licenses for cost-effective access to the report.
13. Are there any additional resources or data provided in the Cerium Oxide Nanoparticles Market report?
While the report offers comprehensive insights, it's advisable to review the specific contents or supplementary materials provided to ascertain if additional resources or data are available.
14. How can I stay updated on further developments or reports in the Cerium Oxide Nanoparticles Market?
To stay informed about further developments, trends, and reports in the Cerium Oxide Nanoparticles Market, consider subscribing to industry newsletters, following relevant companies and organizations, or regularly checking reputable industry news sources and publications.
Methodology
Step 1 - Identification of Relevant Samples Size from Population Database


Step 2 - Approaches for Defining Global Market Size (Value, Volume* & Price*)

Note*: In applicable scenarios
Step 3 - Data Sources
Primary Research
- Web Analytics
- Survey Reports
- Research Institute
- Latest Research Reports
- Opinion Leaders
Secondary Research
- Annual Reports
- White Paper
- Latest Press Release
- Industry Association
- Paid Database
- Investor Presentations

Step 4 - Data Triangulation
Involves using different sources of information in order to increase the validity of a study
These sources are likely to be stakeholders in a program - participants, other researchers, program staff, other community members, and so on.
Then we put all data in single framework & apply various statistical tools to find out the dynamic on the market.
During the analysis stage, feedback from the stakeholder groups would be compared to determine areas of agreement as well as areas of divergence