
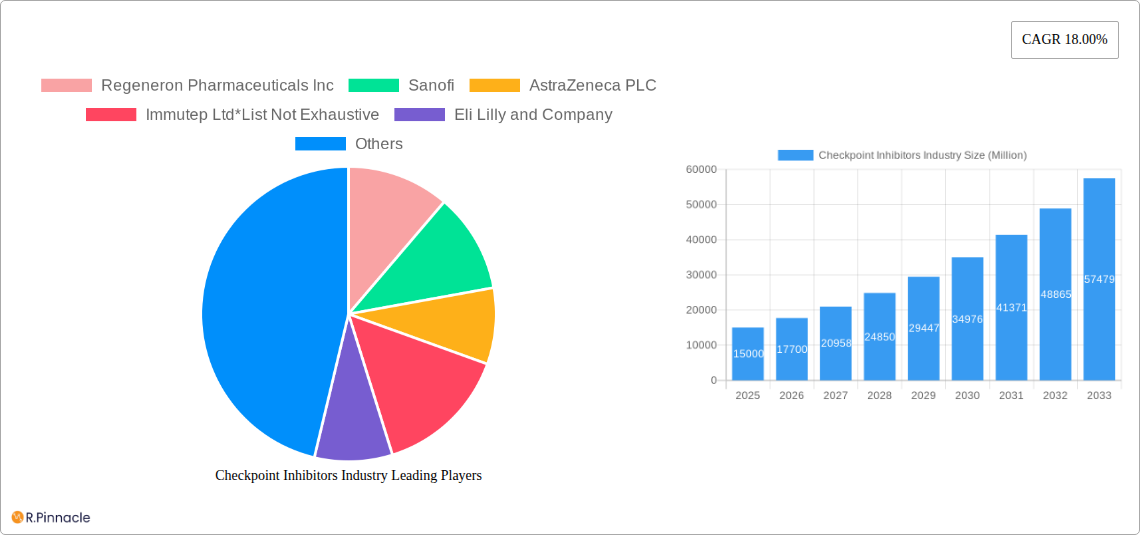
Key Insights
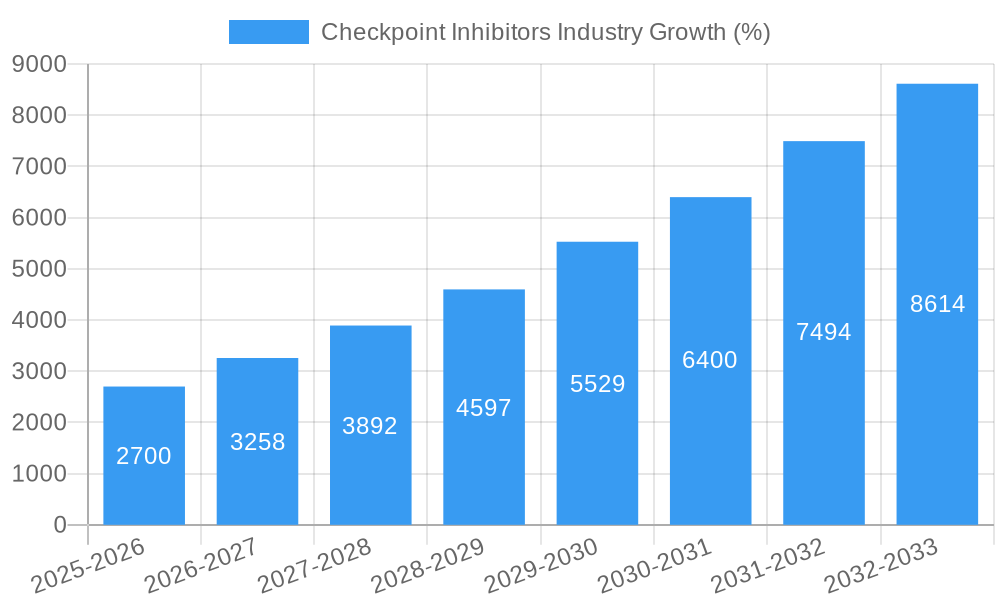
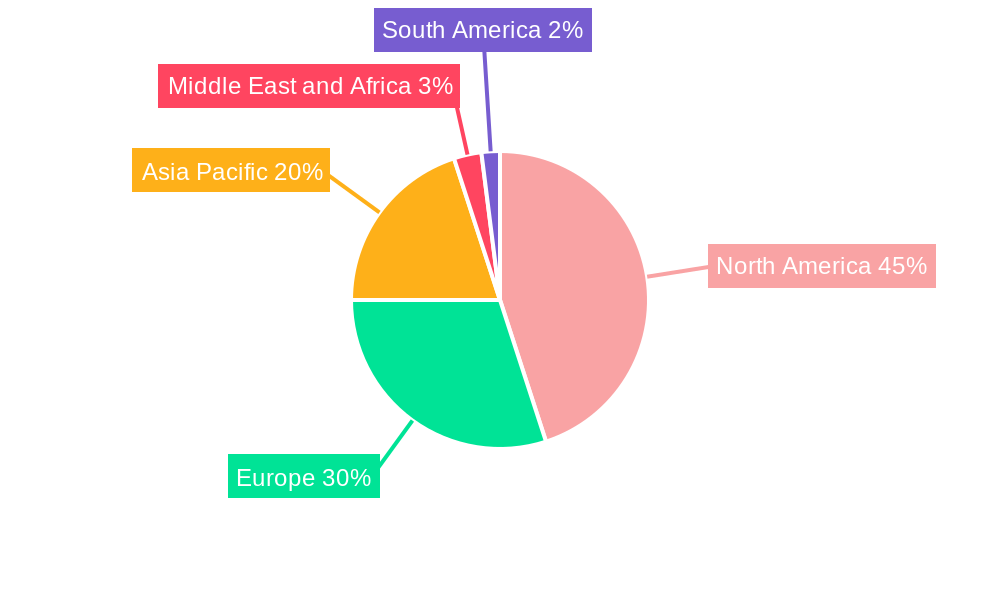
The Checkpoint Inhibitors market is experiencing robust growth, projected at a Compound Annual Growth Rate (CAGR) of 18% from 2025 to 2033. This expansion is driven by several key factors. Firstly, the increasing prevalence of cancers like melanoma, lung cancer, and kidney cancer fuels demand for effective treatment options. Secondly, advancements in immunotherapy and the development of novel checkpoint inhibitors with improved efficacy and safety profiles are significantly contributing to market growth. Thirdly, rising healthcare expenditure globally and increased awareness among patients and healthcare professionals about the benefits of checkpoint inhibitors are also major drivers. The market is segmented by inhibitor type (CTLA-4, PD-1, and others), application (various cancer types), and distribution channel (hospital, retail, and online pharmacies). Competition among leading pharmaceutical companies like Regeneron, Sanofi, AstraZeneca, Eli Lilly, Roche, and Bristol-Myers Squibb is intense, leading to continuous innovation and the introduction of new therapies. The North American market currently holds a significant share, driven by high healthcare spending and advanced healthcare infrastructure, followed by Europe and Asia Pacific. However, the Asia Pacific region is expected to witness substantial growth in the coming years due to rising cancer incidence and increasing adoption of advanced therapies.
The market's growth, however, is not without its restraints. High treatment costs, potential side effects of checkpoint inhibitors, and the development of resistance in some patients pose challenges. Moreover, the regulatory landscape and reimbursement policies in different regions also influence market access and adoption. Despite these challenges, the continued research and development efforts focused on improving the efficacy and safety profiles of checkpoint inhibitors, along with the expansion of their application across various cancer types, suggest a promising future for this market. Further diversification of the distribution channel, including a rise in online pharmacies, will also continue to shape market dynamics. The strategic partnerships and collaborations between pharmaceutical companies and research institutions are expected to contribute significantly to future innovations.
Checkpoint Inhibitors Industry Market Report: 2019-2033
This comprehensive report provides a detailed analysis of the Checkpoint Inhibitors industry, offering invaluable insights for industry professionals, investors, and strategic decision-makers. Covering the period from 2019 to 2033, with a focus on 2025, this report unveils market dynamics, competitive landscapes, and future growth potential. The study period (2019-2024) and forecast period (2025-2033) ensures a thorough understanding of historical trends and future projections.
Note: Market values are expressed in Millions USD throughout the report. Where exact figures were unavailable, estimated values are provided.
Checkpoint Inhibitors Industry Market Structure & Innovation Trends
This section analyzes the market concentration, highlighting key players and their market share. Innovation drivers, regulatory landscapes, and the impact of substitute products are examined. The analysis includes an overview of M&A activities within the industry, providing deal values where available. The end-user demographics are profiled, outlining the key patient populations and their treatment needs.
- Market Concentration: The market is moderately concentrated, with key players holding significant market share. Data on precise market share percentages will be detailed in the full report.
- Innovation Drivers: Ongoing research and development in immunotherapy, along with advancements in drug delivery systems, are driving innovation.
- Regulatory Frameworks: Stringent regulatory approvals and post-market surveillance significantly impact the market.
- Product Substitutes: While limited, alternative cancer therapies represent a degree of competitive pressure.
- M&A Activity: Significant M&A activity, with deal values reaching xx Million in recent years, reflects the strategic importance of this sector. Specific deals and values are detailed within the full report.
- End-User Demographics: Primarily focused on patients with various cancers, including but not limited to melanoma, lung cancer, and kidney cancer.
Checkpoint Inhibitors Industry Market Dynamics & Trends
This section delves into the driving forces behind market growth, exploring technological advancements, evolving consumer preferences, and the competitive landscape. Specific metrics, including CAGR and market penetration rates, will be presented.
This in-depth analysis explores the factors shaping market expansion, considering technological breakthroughs, shifts in consumer preferences, and competitive strategies. Detailed analysis of the CAGR and market penetration rates throughout the forecast period, accompanied by insights into the forces driving change, provide a clear understanding of market dynamics. xx% CAGR is projected for the forecast period. Market penetration is predicted to reach xx% by 2033.
Dominant Regions & Segments in Checkpoint Inhibitors Industry
This section identifies the leading regions, countries, and segments within the Checkpoint Inhibitors industry. Key drivers are examined using bullet points, followed by a detailed paragraph analysis of market dominance.
- By Type of Inhibitors:
- PD-1 Inhibitors: This segment holds the largest market share due to its widespread use and strong clinical efficacy.
- CTLA-4 Inhibitors: A significant but smaller market share compared to PD-1 inhibitors.
- Other Types of Inhibitors: This segment is expected to witness considerable growth driven by ongoing research and development.
- By Application:
- Melanoma: A large and established market driven by high prevalence and effective treatment response.
- Non-small Cell Lung Cancer (NSCLC): A significant market segment, with considerable growth potential.
- Kidney Cancers: A growing market segment with increasing adoption of checkpoint inhibitors.
- Hodgkin Lymphoma: This segment exhibits substantial growth potential due to the promising results from clinical trials.
- By Distribution Channel:
- Hospital Pharmacies: This channel currently dominates due to the complex nature of administration and the need for specialized medical support.
- Retail Pharmacies: A growing segment, but still limited due to regulatory restrictions and the complexity of the drug.
- Online Pharmacies: This channel is relatively nascent but shows potential for expansion.
The North American market is currently the dominant region, driven by high healthcare spending and early adoption of innovative therapies. However, the Asia-Pacific region is projected to witness the fastest growth in the forecast period due to increasing healthcare infrastructure and rising cancer prevalence.
Checkpoint Inhibitors Industry Product Innovations
This section summarizes recent product developments, highlighting their applications and competitive advantages. Technological trends and market fit are emphasized.
The checkpoint inhibitor landscape is characterized by continuous innovation, with the development of novel therapies targeting specific cancer types. Several companies are exploring combination therapies to enhance efficacy and overcome resistance. This continuous development is driving market expansion and enhancing treatment options for patients.
Report Scope & Segmentation Analysis
This section details the market segmentation by Type of Inhibitors (CTLA-4 Inhibitors, PD-1 Inhibitors, Other Types of Inhibitors), Application (Hodgkin Lymphoma, Kidney Cancers, Melanoma, Non-small Cell Lung Cancer, Other Applications), and Distribution Channel (Hospital Pharmacies, Retail Pharmacies, Online Pharmacies). Growth projections, market sizes, and competitive dynamics are provided for each segment.
The report provides a comprehensive segmentation analysis, outlining market size and projected growth for each category. Competitive dynamics within each segment are detailed to give a complete overview of the current market situation.
Key Drivers of Checkpoint Inhibitors Industry Growth
This section outlines the key factors driving the growth of the Checkpoint Inhibitors industry, focusing on technological advancements, economic factors, and supportive regulatory frameworks.
Technological advancements, like improved drug delivery systems and the discovery of new targets, significantly contribute to the market’s expansion. Favorable regulatory environments and increasing healthcare spending in many countries fuel growth.
Challenges in the Checkpoint Inhibitors Industry Sector
This section discusses the barriers and restraints to market growth, including regulatory hurdles, supply chain disruptions, and competitive pressures.
High development costs, stringent regulatory pathways, and the emergence of drug resistance represent key challenges. Supply chain complexities can impact accessibility, while the competitive landscape further shapes market dynamics.
Emerging Opportunities in Checkpoint Inhibitors Industry
This section highlights emerging trends and opportunities, such as new markets, technological breakthroughs, and evolving consumer preferences.
Expansion into new geographical markets, particularly in emerging economies, represents a substantial growth opportunity. Furthermore, the development of personalized medicine and innovative combination therapies creates new avenues for market expansion.
Leading Players in the Checkpoint Inhibitors Industry Market
- Regeneron Pharmaceuticals Inc
- Sanofi
- AstraZeneca PLC
- Immutep Ltd
- Eli Lilly and Company
- F Hoffmann-La Roche AG
- BeiGene Ltd
- Shanghai Jhunsi Biosciences Ltd
- Merck & Co
- Bristol-Myers Squibb Company
- GlaxoSmithKline PLC
Key Developments in Checkpoint Inhibitors Industry Industry
- April 2022: Bristol Myers Squibb received European Commission approval for Opdivo (nivolumab) with chemotherapy for unresectable advanced, recurrent, or metastatic esophageal squamous cell carcinoma (PD-L1 expression ≥1%).
- March 2022: Merck announced FDA approval of KEYTRUDA (anti-PD-1 therapy) as a single agent for treating advanced endometrial carcinoma (MSI-H or dMMR) after prior systemic therapy.
Future Outlook for Checkpoint Inhibitors Industry Market
The future of the Checkpoint Inhibitors market appears promising, with strong growth projected driven by ongoing research and development, an increasing prevalence of cancer, and expanded therapeutic applications. Strategic partnerships, investments in R&D, and the development of novel combination therapies will likely shape future market dynamics.
Checkpoint Inhibitors Industry Segmentation
-
1. Type of Inhibitors
- 1.1. CTLA-4 Inhibitors
- 1.2. PD-1 Inhibitors
- 1.3. Other Types of Inhibitors
-
2. Application
- 2.1. Hodgkin Lymphoma
- 2.2. Kidney Cancers
- 2.3. Melanoma
- 2.4. Non-small Cell Lung Cancer
- 2.5. Other Applications
-
3. Distribution Channel
- 3.1. Hospital Pharmacies
- 3.2. Retail Pharmacies
- 3.3. Online Pharmacies
Checkpoint Inhibitors Industry Segmentation By Geography
-
1. North America
- 1.1. United states
- 1.2. Canada
- 1.3. Mexico
-
2. Europe
- 2.1. Germany
- 2.2. United Kingdom
- 2.3. France
- 2.4. Italy
- 2.5. Spain
- 2.6. Rest of Europe
-
3. Asia Pacific
- 3.1. China
- 3.2. Japan
- 3.3. India
- 3.4. Australia
- 3.5. South Korea
- 3.6. Rest of Asia Pacific
-
4. Middle East and Africa
- 4.1. GCC
- 4.2. South Africa
- 4.3. Rest of Middle East and Africa
-
5. South America
- 5.1. Brazil
- 5.2. Argentina
- 5.3. Rest of South America
Checkpoint Inhibitors Industry REPORT HIGHLIGHTS
| Aspects | Details |
|---|---|
| Study Period | 2019-2033 |
| Base Year | 2024 |
| Estimated Year | 2025 |
| Forecast Period | 2025-2033 |
| Historical Period | 2019-2024 |
| Growth Rate | CAGR of 18.00% from 2019-2033 |
| Segmentation |
|
Table of Contents
- 1. Introduction
- 1.1. Research Scope
- 1.2. Market Segmentation
- 1.3. Research Methodology
- 1.4. Definitions and Assumptions
- 2. Executive Summary
- 2.1. Introduction
- 3. Market Dynamics
- 3.1. Introduction
- 3.2. Market Drivers
- 3.2.1. Rising Investments in R&D and Clinical Trials by the Biopharmaceutical Industry to Develop these Products; Increased Product Approvals by Regulatory Authorities and Special Designations for New Drug Molecules
- 3.3. Market Restrains
- 3.3.1. Higher Risk of Complications Associated with the Expensive Oncology Treatment
- 3.4. Market Trends
- 3.4.1. The PD-1 Inhibitors Segment is Expected to Hold the Largest Market Share in the Immune Checkpoint Inhibitors Market
- 4. Market Factor Analysis
- 4.1. Porters Five Forces
- 4.2. Supply/Value Chain
- 4.3. PESTEL analysis
- 4.4. Market Entropy
- 4.5. Patent/Trademark Analysis
- 5. Global Checkpoint Inhibitors Industry Analysis, Insights and Forecast, 2019-2031
- 5.1. Market Analysis, Insights and Forecast - by Type of Inhibitors
- 5.1.1. CTLA-4 Inhibitors
- 5.1.2. PD-1 Inhibitors
- 5.1.3. Other Types of Inhibitors
- 5.2. Market Analysis, Insights and Forecast - by Application
- 5.2.1. Hodgkin Lymphoma
- 5.2.2. Kidney Cancers
- 5.2.3. Melanoma
- 5.2.4. Non-small Cell Lung Cancer
- 5.2.5. Other Applications
- 5.3. Market Analysis, Insights and Forecast - by Distribution Channel
- 5.3.1. Hospital Pharmacies
- 5.3.2. Retail Pharmacies
- 5.3.3. Online Pharmacies
- 5.4. Market Analysis, Insights and Forecast - by Region
- 5.4.1. North America
- 5.4.2. Europe
- 5.4.3. Asia Pacific
- 5.4.4. Middle East and Africa
- 5.4.5. South America
- 5.1. Market Analysis, Insights and Forecast - by Type of Inhibitors
- 6. North America Checkpoint Inhibitors Industry Analysis, Insights and Forecast, 2019-2031
- 6.1. Market Analysis, Insights and Forecast - by Type of Inhibitors
- 6.1.1. CTLA-4 Inhibitors
- 6.1.2. PD-1 Inhibitors
- 6.1.3. Other Types of Inhibitors
- 6.2. Market Analysis, Insights and Forecast - by Application
- 6.2.1. Hodgkin Lymphoma
- 6.2.2. Kidney Cancers
- 6.2.3. Melanoma
- 6.2.4. Non-small Cell Lung Cancer
- 6.2.5. Other Applications
- 6.3. Market Analysis, Insights and Forecast - by Distribution Channel
- 6.3.1. Hospital Pharmacies
- 6.3.2. Retail Pharmacies
- 6.3.3. Online Pharmacies
- 6.1. Market Analysis, Insights and Forecast - by Type of Inhibitors
- 7. Europe Checkpoint Inhibitors Industry Analysis, Insights and Forecast, 2019-2031
- 7.1. Market Analysis, Insights and Forecast - by Type of Inhibitors
- 7.1.1. CTLA-4 Inhibitors
- 7.1.2. PD-1 Inhibitors
- 7.1.3. Other Types of Inhibitors
- 7.2. Market Analysis, Insights and Forecast - by Application
- 7.2.1. Hodgkin Lymphoma
- 7.2.2. Kidney Cancers
- 7.2.3. Melanoma
- 7.2.4. Non-small Cell Lung Cancer
- 7.2.5. Other Applications
- 7.3. Market Analysis, Insights and Forecast - by Distribution Channel
- 7.3.1. Hospital Pharmacies
- 7.3.2. Retail Pharmacies
- 7.3.3. Online Pharmacies
- 7.1. Market Analysis, Insights and Forecast - by Type of Inhibitors
- 8. Asia Pacific Checkpoint Inhibitors Industry Analysis, Insights and Forecast, 2019-2031
- 8.1. Market Analysis, Insights and Forecast - by Type of Inhibitors
- 8.1.1. CTLA-4 Inhibitors
- 8.1.2. PD-1 Inhibitors
- 8.1.3. Other Types of Inhibitors
- 8.2. Market Analysis, Insights and Forecast - by Application
- 8.2.1. Hodgkin Lymphoma
- 8.2.2. Kidney Cancers
- 8.2.3. Melanoma
- 8.2.4. Non-small Cell Lung Cancer
- 8.2.5. Other Applications
- 8.3. Market Analysis, Insights and Forecast - by Distribution Channel
- 8.3.1. Hospital Pharmacies
- 8.3.2. Retail Pharmacies
- 8.3.3. Online Pharmacies
- 8.1. Market Analysis, Insights and Forecast - by Type of Inhibitors
- 9. Middle East and Africa Checkpoint Inhibitors Industry Analysis, Insights and Forecast, 2019-2031
- 9.1. Market Analysis, Insights and Forecast - by Type of Inhibitors
- 9.1.1. CTLA-4 Inhibitors
- 9.1.2. PD-1 Inhibitors
- 9.1.3. Other Types of Inhibitors
- 9.2. Market Analysis, Insights and Forecast - by Application
- 9.2.1. Hodgkin Lymphoma
- 9.2.2. Kidney Cancers
- 9.2.3. Melanoma
- 9.2.4. Non-small Cell Lung Cancer
- 9.2.5. Other Applications
- 9.3. Market Analysis, Insights and Forecast - by Distribution Channel
- 9.3.1. Hospital Pharmacies
- 9.3.2. Retail Pharmacies
- 9.3.3. Online Pharmacies
- 9.1. Market Analysis, Insights and Forecast - by Type of Inhibitors
- 10. South America Checkpoint Inhibitors Industry Analysis, Insights and Forecast, 2019-2031
- 10.1. Market Analysis, Insights and Forecast - by Type of Inhibitors
- 10.1.1. CTLA-4 Inhibitors
- 10.1.2. PD-1 Inhibitors
- 10.1.3. Other Types of Inhibitors
- 10.2. Market Analysis, Insights and Forecast - by Application
- 10.2.1. Hodgkin Lymphoma
- 10.2.2. Kidney Cancers
- 10.2.3. Melanoma
- 10.2.4. Non-small Cell Lung Cancer
- 10.2.5. Other Applications
- 10.3. Market Analysis, Insights and Forecast - by Distribution Channel
- 10.3.1. Hospital Pharmacies
- 10.3.2. Retail Pharmacies
- 10.3.3. Online Pharmacies
- 10.1. Market Analysis, Insights and Forecast - by Type of Inhibitors
- 11. North America Checkpoint Inhibitors Industry Analysis, Insights and Forecast, 2019-2031
- 11.1. Market Analysis, Insights and Forecast - By Country/Sub-region
- 11.1.1 United states
- 11.1.2 Canada
- 11.1.3 Mexico
- 12. Europe Checkpoint Inhibitors Industry Analysis, Insights and Forecast, 2019-2031
- 12.1. Market Analysis, Insights and Forecast - By Country/Sub-region
- 12.1.1 Germany
- 12.1.2 United Kingdom
- 12.1.3 France
- 12.1.4 Italy
- 12.1.5 Spain
- 12.1.6 Rest of Europe
- 13. Asia Pacific Checkpoint Inhibitors Industry Analysis, Insights and Forecast, 2019-2031
- 13.1. Market Analysis, Insights and Forecast - By Country/Sub-region
- 13.1.1 China
- 13.1.2 Japan
- 13.1.3 India
- 13.1.4 Australia
- 13.1.5 South Korea
- 13.1.6 Rest of Asia Pacific
- 14. Middle East and Africa Checkpoint Inhibitors Industry Analysis, Insights and Forecast, 2019-2031
- 14.1. Market Analysis, Insights and Forecast - By Country/Sub-region
- 14.1.1 GCC
- 14.1.2 South Africa
- 14.1.3 Rest of Middle East and Africa
- 15. South America Checkpoint Inhibitors Industry Analysis, Insights and Forecast, 2019-2031
- 15.1. Market Analysis, Insights and Forecast - By Country/Sub-region
- 15.1.1 Brazil
- 15.1.2 Argentina
- 15.1.3 Rest of South America
- 16. Competitive Analysis
- 16.1. Global Market Share Analysis 2024
- 16.2. Company Profiles
- 16.2.1 Regeneron Pharmaceuticals Inc
- 16.2.1.1. Overview
- 16.2.1.2. Products
- 16.2.1.3. SWOT Analysis
- 16.2.1.4. Recent Developments
- 16.2.1.5. Financials (Based on Availability)
- 16.2.2 Sanofi
- 16.2.2.1. Overview
- 16.2.2.2. Products
- 16.2.2.3. SWOT Analysis
- 16.2.2.4. Recent Developments
- 16.2.2.5. Financials (Based on Availability)
- 16.2.3 AstraZeneca PLC
- 16.2.3.1. Overview
- 16.2.3.2. Products
- 16.2.3.3. SWOT Analysis
- 16.2.3.4. Recent Developments
- 16.2.3.5. Financials (Based on Availability)
- 16.2.4 Immutep Ltd*List Not Exhaustive
- 16.2.4.1. Overview
- 16.2.4.2. Products
- 16.2.4.3. SWOT Analysis
- 16.2.4.4. Recent Developments
- 16.2.4.5. Financials (Based on Availability)
- 16.2.5 Eli Lilly and Company
- 16.2.5.1. Overview
- 16.2.5.2. Products
- 16.2.5.3. SWOT Analysis
- 16.2.5.4. Recent Developments
- 16.2.5.5. Financials (Based on Availability)
- 16.2.6 F Hoffmann-La Roche AG
- 16.2.6.1. Overview
- 16.2.6.2. Products
- 16.2.6.3. SWOT Analysis
- 16.2.6.4. Recent Developments
- 16.2.6.5. Financials (Based on Availability)
- 16.2.7 BeiGene Ltd
- 16.2.7.1. Overview
- 16.2.7.2. Products
- 16.2.7.3. SWOT Analysis
- 16.2.7.4. Recent Developments
- 16.2.7.5. Financials (Based on Availability)
- 16.2.8 Shanghai Jhunsi Biosciences Ltd
- 16.2.8.1. Overview
- 16.2.8.2. Products
- 16.2.8.3. SWOT Analysis
- 16.2.8.4. Recent Developments
- 16.2.8.5. Financials (Based on Availability)
- 16.2.9 Merck & Co
- 16.2.9.1. Overview
- 16.2.9.2. Products
- 16.2.9.3. SWOT Analysis
- 16.2.9.4. Recent Developments
- 16.2.9.5. Financials (Based on Availability)
- 16.2.10 Bristol-Myers Squibb Company
- 16.2.10.1. Overview
- 16.2.10.2. Products
- 16.2.10.3. SWOT Analysis
- 16.2.10.4. Recent Developments
- 16.2.10.5. Financials (Based on Availability)
- 16.2.11 GlaxoSmithKline PLC
- 16.2.11.1. Overview
- 16.2.11.2. Products
- 16.2.11.3. SWOT Analysis
- 16.2.11.4. Recent Developments
- 16.2.11.5. Financials (Based on Availability)
- 16.2.1 Regeneron Pharmaceuticals Inc
List of Figures
- Figure 1: Global Checkpoint Inhibitors Industry Revenue Breakdown (Million, %) by Region 2024 & 2032
- Figure 2: North America Checkpoint Inhibitors Industry Revenue (Million), by Country 2024 & 2032
- Figure 3: North America Checkpoint Inhibitors Industry Revenue Share (%), by Country 2024 & 2032
- Figure 4: Europe Checkpoint Inhibitors Industry Revenue (Million), by Country 2024 & 2032
- Figure 5: Europe Checkpoint Inhibitors Industry Revenue Share (%), by Country 2024 & 2032
- Figure 6: Asia Pacific Checkpoint Inhibitors Industry Revenue (Million), by Country 2024 & 2032
- Figure 7: Asia Pacific Checkpoint Inhibitors Industry Revenue Share (%), by Country 2024 & 2032
- Figure 8: Middle East and Africa Checkpoint Inhibitors Industry Revenue (Million), by Country 2024 & 2032
- Figure 9: Middle East and Africa Checkpoint Inhibitors Industry Revenue Share (%), by Country 2024 & 2032
- Figure 10: South America Checkpoint Inhibitors Industry Revenue (Million), by Country 2024 & 2032
- Figure 11: South America Checkpoint Inhibitors Industry Revenue Share (%), by Country 2024 & 2032
- Figure 12: North America Checkpoint Inhibitors Industry Revenue (Million), by Type of Inhibitors 2024 & 2032
- Figure 13: North America Checkpoint Inhibitors Industry Revenue Share (%), by Type of Inhibitors 2024 & 2032
- Figure 14: North America Checkpoint Inhibitors Industry Revenue (Million), by Application 2024 & 2032
- Figure 15: North America Checkpoint Inhibitors Industry Revenue Share (%), by Application 2024 & 2032
- Figure 16: North America Checkpoint Inhibitors Industry Revenue (Million), by Distribution Channel 2024 & 2032
- Figure 17: North America Checkpoint Inhibitors Industry Revenue Share (%), by Distribution Channel 2024 & 2032
- Figure 18: North America Checkpoint Inhibitors Industry Revenue (Million), by Country 2024 & 2032
- Figure 19: North America Checkpoint Inhibitors Industry Revenue Share (%), by Country 2024 & 2032
- Figure 20: Europe Checkpoint Inhibitors Industry Revenue (Million), by Type of Inhibitors 2024 & 2032
- Figure 21: Europe Checkpoint Inhibitors Industry Revenue Share (%), by Type of Inhibitors 2024 & 2032
- Figure 22: Europe Checkpoint Inhibitors Industry Revenue (Million), by Application 2024 & 2032
- Figure 23: Europe Checkpoint Inhibitors Industry Revenue Share (%), by Application 2024 & 2032
- Figure 24: Europe Checkpoint Inhibitors Industry Revenue (Million), by Distribution Channel 2024 & 2032
- Figure 25: Europe Checkpoint Inhibitors Industry Revenue Share (%), by Distribution Channel 2024 & 2032
- Figure 26: Europe Checkpoint Inhibitors Industry Revenue (Million), by Country 2024 & 2032
- Figure 27: Europe Checkpoint Inhibitors Industry Revenue Share (%), by Country 2024 & 2032
- Figure 28: Asia Pacific Checkpoint Inhibitors Industry Revenue (Million), by Type of Inhibitors 2024 & 2032
- Figure 29: Asia Pacific Checkpoint Inhibitors Industry Revenue Share (%), by Type of Inhibitors 2024 & 2032
- Figure 30: Asia Pacific Checkpoint Inhibitors Industry Revenue (Million), by Application 2024 & 2032
- Figure 31: Asia Pacific Checkpoint Inhibitors Industry Revenue Share (%), by Application 2024 & 2032
- Figure 32: Asia Pacific Checkpoint Inhibitors Industry Revenue (Million), by Distribution Channel 2024 & 2032
- Figure 33: Asia Pacific Checkpoint Inhibitors Industry Revenue Share (%), by Distribution Channel 2024 & 2032
- Figure 34: Asia Pacific Checkpoint Inhibitors Industry Revenue (Million), by Country 2024 & 2032
- Figure 35: Asia Pacific Checkpoint Inhibitors Industry Revenue Share (%), by Country 2024 & 2032
- Figure 36: Middle East and Africa Checkpoint Inhibitors Industry Revenue (Million), by Type of Inhibitors 2024 & 2032
- Figure 37: Middle East and Africa Checkpoint Inhibitors Industry Revenue Share (%), by Type of Inhibitors 2024 & 2032
- Figure 38: Middle East and Africa Checkpoint Inhibitors Industry Revenue (Million), by Application 2024 & 2032
- Figure 39: Middle East and Africa Checkpoint Inhibitors Industry Revenue Share (%), by Application 2024 & 2032
- Figure 40: Middle East and Africa Checkpoint Inhibitors Industry Revenue (Million), by Distribution Channel 2024 & 2032
- Figure 41: Middle East and Africa Checkpoint Inhibitors Industry Revenue Share (%), by Distribution Channel 2024 & 2032
- Figure 42: Middle East and Africa Checkpoint Inhibitors Industry Revenue (Million), by Country 2024 & 2032
- Figure 43: Middle East and Africa Checkpoint Inhibitors Industry Revenue Share (%), by Country 2024 & 2032
- Figure 44: South America Checkpoint Inhibitors Industry Revenue (Million), by Type of Inhibitors 2024 & 2032
- Figure 45: South America Checkpoint Inhibitors Industry Revenue Share (%), by Type of Inhibitors 2024 & 2032
- Figure 46: South America Checkpoint Inhibitors Industry Revenue (Million), by Application 2024 & 2032
- Figure 47: South America Checkpoint Inhibitors Industry Revenue Share (%), by Application 2024 & 2032
- Figure 48: South America Checkpoint Inhibitors Industry Revenue (Million), by Distribution Channel 2024 & 2032
- Figure 49: South America Checkpoint Inhibitors Industry Revenue Share (%), by Distribution Channel 2024 & 2032
- Figure 50: South America Checkpoint Inhibitors Industry Revenue (Million), by Country 2024 & 2032
- Figure 51: South America Checkpoint Inhibitors Industry Revenue Share (%), by Country 2024 & 2032
List of Tables
- Table 1: Global Checkpoint Inhibitors Industry Revenue Million Forecast, by Region 2019 & 2032
- Table 2: Global Checkpoint Inhibitors Industry Revenue Million Forecast, by Type of Inhibitors 2019 & 2032
- Table 3: Global Checkpoint Inhibitors Industry Revenue Million Forecast, by Application 2019 & 2032
- Table 4: Global Checkpoint Inhibitors Industry Revenue Million Forecast, by Distribution Channel 2019 & 2032
- Table 5: Global Checkpoint Inhibitors Industry Revenue Million Forecast, by Region 2019 & 2032
- Table 6: Global Checkpoint Inhibitors Industry Revenue Million Forecast, by Country 2019 & 2032
- Table 7: United states Checkpoint Inhibitors Industry Revenue (Million) Forecast, by Application 2019 & 2032
- Table 8: Canada Checkpoint Inhibitors Industry Revenue (Million) Forecast, by Application 2019 & 2032
- Table 9: Mexico Checkpoint Inhibitors Industry Revenue (Million) Forecast, by Application 2019 & 2032
- Table 10: Global Checkpoint Inhibitors Industry Revenue Million Forecast, by Country 2019 & 2032
- Table 11: Germany Checkpoint Inhibitors Industry Revenue (Million) Forecast, by Application 2019 & 2032
- Table 12: United Kingdom Checkpoint Inhibitors Industry Revenue (Million) Forecast, by Application 2019 & 2032
- Table 13: France Checkpoint Inhibitors Industry Revenue (Million) Forecast, by Application 2019 & 2032
- Table 14: Italy Checkpoint Inhibitors Industry Revenue (Million) Forecast, by Application 2019 & 2032
- Table 15: Spain Checkpoint Inhibitors Industry Revenue (Million) Forecast, by Application 2019 & 2032
- Table 16: Rest of Europe Checkpoint Inhibitors Industry Revenue (Million) Forecast, by Application 2019 & 2032
- Table 17: Global Checkpoint Inhibitors Industry Revenue Million Forecast, by Country 2019 & 2032
- Table 18: China Checkpoint Inhibitors Industry Revenue (Million) Forecast, by Application 2019 & 2032
- Table 19: Japan Checkpoint Inhibitors Industry Revenue (Million) Forecast, by Application 2019 & 2032
- Table 20: India Checkpoint Inhibitors Industry Revenue (Million) Forecast, by Application 2019 & 2032
- Table 21: Australia Checkpoint Inhibitors Industry Revenue (Million) Forecast, by Application 2019 & 2032
- Table 22: South Korea Checkpoint Inhibitors Industry Revenue (Million) Forecast, by Application 2019 & 2032
- Table 23: Rest of Asia Pacific Checkpoint Inhibitors Industry Revenue (Million) Forecast, by Application 2019 & 2032
- Table 24: Global Checkpoint Inhibitors Industry Revenue Million Forecast, by Country 2019 & 2032
- Table 25: GCC Checkpoint Inhibitors Industry Revenue (Million) Forecast, by Application 2019 & 2032
- Table 26: South Africa Checkpoint Inhibitors Industry Revenue (Million) Forecast, by Application 2019 & 2032
- Table 27: Rest of Middle East and Africa Checkpoint Inhibitors Industry Revenue (Million) Forecast, by Application 2019 & 2032
- Table 28: Global Checkpoint Inhibitors Industry Revenue Million Forecast, by Country 2019 & 2032
- Table 29: Brazil Checkpoint Inhibitors Industry Revenue (Million) Forecast, by Application 2019 & 2032
- Table 30: Argentina Checkpoint Inhibitors Industry Revenue (Million) Forecast, by Application 2019 & 2032
- Table 31: Rest of South America Checkpoint Inhibitors Industry Revenue (Million) Forecast, by Application 2019 & 2032
- Table 32: Global Checkpoint Inhibitors Industry Revenue Million Forecast, by Type of Inhibitors 2019 & 2032
- Table 33: Global Checkpoint Inhibitors Industry Revenue Million Forecast, by Application 2019 & 2032
- Table 34: Global Checkpoint Inhibitors Industry Revenue Million Forecast, by Distribution Channel 2019 & 2032
- Table 35: Global Checkpoint Inhibitors Industry Revenue Million Forecast, by Country 2019 & 2032
- Table 36: United states Checkpoint Inhibitors Industry Revenue (Million) Forecast, by Application 2019 & 2032
- Table 37: Canada Checkpoint Inhibitors Industry Revenue (Million) Forecast, by Application 2019 & 2032
- Table 38: Mexico Checkpoint Inhibitors Industry Revenue (Million) Forecast, by Application 2019 & 2032
- Table 39: Global Checkpoint Inhibitors Industry Revenue Million Forecast, by Type of Inhibitors 2019 & 2032
- Table 40: Global Checkpoint Inhibitors Industry Revenue Million Forecast, by Application 2019 & 2032
- Table 41: Global Checkpoint Inhibitors Industry Revenue Million Forecast, by Distribution Channel 2019 & 2032
- Table 42: Global Checkpoint Inhibitors Industry Revenue Million Forecast, by Country 2019 & 2032
- Table 43: Germany Checkpoint Inhibitors Industry Revenue (Million) Forecast, by Application 2019 & 2032
- Table 44: United Kingdom Checkpoint Inhibitors Industry Revenue (Million) Forecast, by Application 2019 & 2032
- Table 45: France Checkpoint Inhibitors Industry Revenue (Million) Forecast, by Application 2019 & 2032
- Table 46: Italy Checkpoint Inhibitors Industry Revenue (Million) Forecast, by Application 2019 & 2032
- Table 47: Spain Checkpoint Inhibitors Industry Revenue (Million) Forecast, by Application 2019 & 2032
- Table 48: Rest of Europe Checkpoint Inhibitors Industry Revenue (Million) Forecast, by Application 2019 & 2032
- Table 49: Global Checkpoint Inhibitors Industry Revenue Million Forecast, by Type of Inhibitors 2019 & 2032
- Table 50: Global Checkpoint Inhibitors Industry Revenue Million Forecast, by Application 2019 & 2032
- Table 51: Global Checkpoint Inhibitors Industry Revenue Million Forecast, by Distribution Channel 2019 & 2032
- Table 52: Global Checkpoint Inhibitors Industry Revenue Million Forecast, by Country 2019 & 2032
- Table 53: China Checkpoint Inhibitors Industry Revenue (Million) Forecast, by Application 2019 & 2032
- Table 54: Japan Checkpoint Inhibitors Industry Revenue (Million) Forecast, by Application 2019 & 2032
- Table 55: India Checkpoint Inhibitors Industry Revenue (Million) Forecast, by Application 2019 & 2032
- Table 56: Australia Checkpoint Inhibitors Industry Revenue (Million) Forecast, by Application 2019 & 2032
- Table 57: South Korea Checkpoint Inhibitors Industry Revenue (Million) Forecast, by Application 2019 & 2032
- Table 58: Rest of Asia Pacific Checkpoint Inhibitors Industry Revenue (Million) Forecast, by Application 2019 & 2032
- Table 59: Global Checkpoint Inhibitors Industry Revenue Million Forecast, by Type of Inhibitors 2019 & 2032
- Table 60: Global Checkpoint Inhibitors Industry Revenue Million Forecast, by Application 2019 & 2032
- Table 61: Global Checkpoint Inhibitors Industry Revenue Million Forecast, by Distribution Channel 2019 & 2032
- Table 62: Global Checkpoint Inhibitors Industry Revenue Million Forecast, by Country 2019 & 2032
- Table 63: GCC Checkpoint Inhibitors Industry Revenue (Million) Forecast, by Application 2019 & 2032
- Table 64: South Africa Checkpoint Inhibitors Industry Revenue (Million) Forecast, by Application 2019 & 2032
- Table 65: Rest of Middle East and Africa Checkpoint Inhibitors Industry Revenue (Million) Forecast, by Application 2019 & 2032
- Table 66: Global Checkpoint Inhibitors Industry Revenue Million Forecast, by Type of Inhibitors 2019 & 2032
- Table 67: Global Checkpoint Inhibitors Industry Revenue Million Forecast, by Application 2019 & 2032
- Table 68: Global Checkpoint Inhibitors Industry Revenue Million Forecast, by Distribution Channel 2019 & 2032
- Table 69: Global Checkpoint Inhibitors Industry Revenue Million Forecast, by Country 2019 & 2032
- Table 70: Brazil Checkpoint Inhibitors Industry Revenue (Million) Forecast, by Application 2019 & 2032
- Table 71: Argentina Checkpoint Inhibitors Industry Revenue (Million) Forecast, by Application 2019 & 2032
- Table 72: Rest of South America Checkpoint Inhibitors Industry Revenue (Million) Forecast, by Application 2019 & 2032
Frequently Asked Questions
1. What is the projected Compound Annual Growth Rate (CAGR) of the Checkpoint Inhibitors Industry?
The projected CAGR is approximately 18.00%.
2. Which companies are prominent players in the Checkpoint Inhibitors Industry?
Key companies in the market include Regeneron Pharmaceuticals Inc, Sanofi, AstraZeneca PLC, Immutep Ltd*List Not Exhaustive, Eli Lilly and Company, F Hoffmann-La Roche AG, BeiGene Ltd, Shanghai Jhunsi Biosciences Ltd, Merck & Co, Bristol-Myers Squibb Company, GlaxoSmithKline PLC.
3. What are the main segments of the Checkpoint Inhibitors Industry?
The market segments include Type of Inhibitors, Application, Distribution Channel.
4. Can you provide details about the market size?
The market size is estimated to be USD XX Million as of 2022.
5. What are some drivers contributing to market growth?
Rising Investments in R&D and Clinical Trials by the Biopharmaceutical Industry to Develop these Products; Increased Product Approvals by Regulatory Authorities and Special Designations for New Drug Molecules.
6. What are the notable trends driving market growth?
The PD-1 Inhibitors Segment is Expected to Hold the Largest Market Share in the Immune Checkpoint Inhibitors Market.
7. Are there any restraints impacting market growth?
Higher Risk of Complications Associated with the Expensive Oncology Treatment.
8. Can you provide examples of recent developments in the market?
April 2022: Bristol Myers Squibb received the European Commission approval for opdivo (nivolumab) with chemotherapy as first-line treatment for patients with unresectable advanced, recurrent or metastatic esophageal squamous cell carcinoma with tumor cell PD-L1 expression of 1%.
9. What pricing options are available for accessing the report?
Pricing options include single-user, multi-user, and enterprise licenses priced at USD 4750, USD 5250, and USD 8750 respectively.
10. Is the market size provided in terms of value or volume?
The market size is provided in terms of value, measured in Million.
11. Are there any specific market keywords associated with the report?
Yes, the market keyword associated with the report is "Checkpoint Inhibitors Industry," which aids in identifying and referencing the specific market segment covered.
12. How do I determine which pricing option suits my needs best?
The pricing options vary based on user requirements and access needs. Individual users may opt for single-user licenses, while businesses requiring broader access may choose multi-user or enterprise licenses for cost-effective access to the report.
13. Are there any additional resources or data provided in the Checkpoint Inhibitors Industry report?
While the report offers comprehensive insights, it's advisable to review the specific contents or supplementary materials provided to ascertain if additional resources or data are available.
14. How can I stay updated on further developments or reports in the Checkpoint Inhibitors Industry?
To stay informed about further developments, trends, and reports in the Checkpoint Inhibitors Industry, consider subscribing to industry newsletters, following relevant companies and organizations, or regularly checking reputable industry news sources and publications.
Methodology
Step 1 - Identification of Relevant Samples Size from Population Database


Step 2 - Approaches for Defining Global Market Size (Value, Volume* & Price*)

Note*: In applicable scenarios
Step 3 - Data Sources
Primary Research
- Web Analytics
- Survey Reports
- Research Institute
- Latest Research Reports
- Opinion Leaders
Secondary Research
- Annual Reports
- White Paper
- Latest Press Release
- Industry Association
- Paid Database
- Investor Presentations

Step 4 - Data Triangulation
Involves using different sources of information in order to increase the validity of a study
These sources are likely to be stakeholders in a program - participants, other researchers, program staff, other community members, and so on.
Then we put all data in single framework & apply various statistical tools to find out the dynamic on the market.
During the analysis stage, feedback from the stakeholder groups would be compared to determine areas of agreement as well as areas of divergence


