

Key Insights
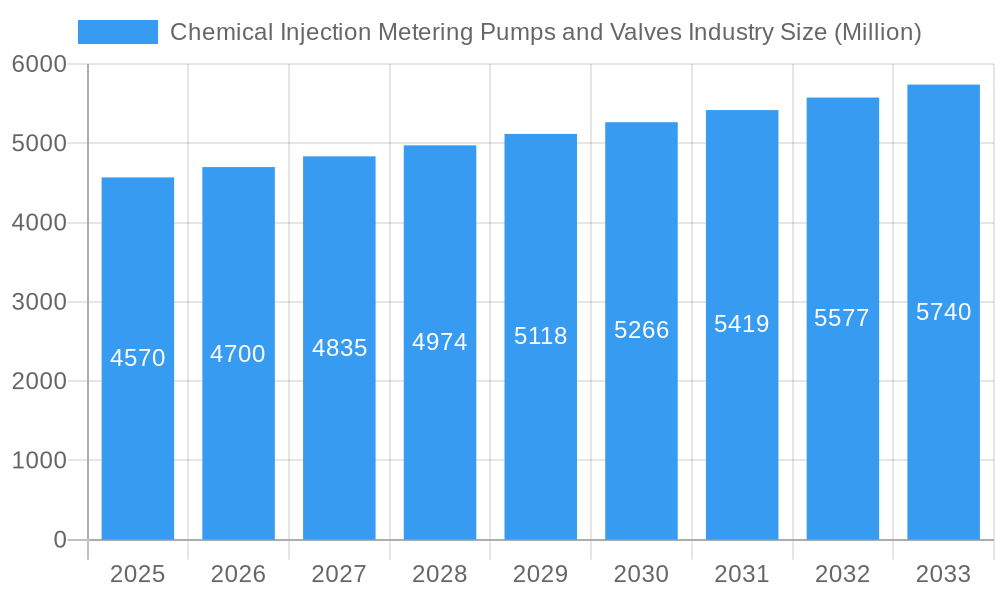
The Chemical Injection Metering Pumps and Valves market is a significant sector experiencing steady growth, projected to reach a valuation of $4.57 billion in 2025 and maintain a Compound Annual Growth Rate (CAGR) of 2.79% from 2025 to 2033. This growth is fueled by several key factors. Increased demand from the oil and gas industry, driven by enhanced recovery techniques and stricter environmental regulations, significantly contributes to market expansion. The chemical processing industry, particularly in segments like petrochemicals and pharmaceuticals, also plays a crucial role, demanding precise chemical injection for optimal process control and product quality. Furthermore, advancements in pump technology, including the development of more efficient and durable materials, along with improved automation and remote monitoring capabilities, are driving market adoption. The rising adoption of smart technologies and Industry 4.0 principles within manufacturing and process industries further fuels this growth trajectory.
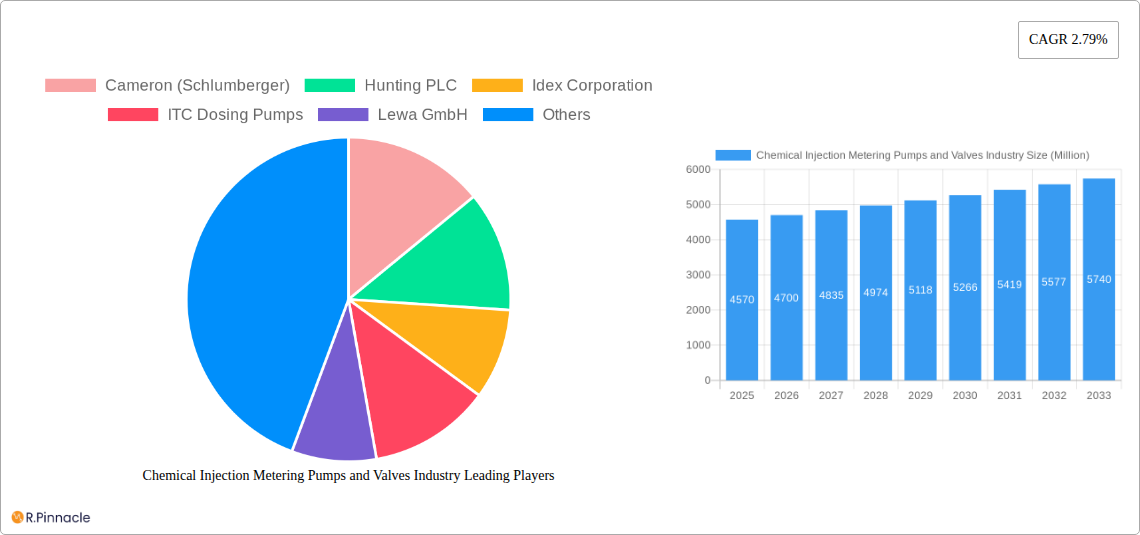
Chemical Injection Metering Pumps and Valves Industry Market Size (In Billion)
However, market growth isn't without challenges. Fluctuations in raw material prices, particularly for specialized metals and polymers used in pump construction, can impact profitability. The cyclical nature of the oil and gas industry, a significant end-user sector, also presents inherent risk. Competition amongst established players like Cameron (Schlumberger), Hunting PLC, and Idex Corporation, along with emerging players, necessitates continuous innovation and cost optimization to maintain market share. Despite these restraints, the long-term outlook remains positive, driven by increasing industrial automation, stringent environmental compliance standards, and the consistent need for precise chemical handling across diverse industries. The market's segmentation, though not explicitly defined, is likely to include various pump types (positive displacement, diaphragm, etc.), valve types (ball, butterfly, etc.), and end-use industries (oil & gas, chemical processing, water treatment, etc.). This segmentation offers diverse opportunities for specialized players to cater to niche needs.
Chemical Injection Metering Pumps and Valves Industry Company Market Share
Chemical Injection Metering Pumps and Valves Industry: A Comprehensive Market Report (2019-2033)
This in-depth report provides a comprehensive analysis of the Chemical Injection Metering Pumps and Valves industry, offering invaluable insights for industry professionals, investors, and strategic decision-makers. Covering the period from 2019 to 2033, with a base year of 2025 and a forecast period of 2025-2033, this report unveils market dynamics, growth drivers, and emerging opportunities within this crucial sector. The market size is projected to reach xx Million by 2033, exhibiting a robust CAGR of xx% during the forecast period.
Chemical Injection Metering Pumps and Valves Industry Market Structure & Innovation Trends
The Chemical Injection Metering Pumps and Valves industry is characterized by a moderately concentrated competitive landscape. Key global players, including Cameron (a Schlumberger company), Hunting PLC, and Idex Corporation, exert considerable influence, alongside other specialized manufacturers. The collective market share of the top 5 entities is estimated to be around **[Insert Percentage]**%. Recent strategic acquisitions and mergers have been a prominent feature, with aggregate deal values reaching approximately **[Insert Value]** Million USD over the past five years. This consolidation activity underscores the industry's ongoing pursuit of technological leadership, operational synergies, and expanded global reach.
- Market Concentration: Moderately concentrated, with the top 5 players collectively commanding an estimated **[Insert Percentage]**% market share.
- Innovation Drivers: Key advancements are emerging from the fields of material science (e.g., corrosion resistance, durability), sophisticated automation, and the integration of digital technologies (IoT, AI for predictive maintenance).
- Regulatory Frameworks: Increasingly stringent environmental regulations worldwide are a significant catalyst, driving the demand for highly efficient, precise, and reliable chemical injection systems that minimize waste and ensure compliance.
- Product Substitutes: While direct substitutes for high-precision chemical metering pumps and valves are limited, alternative methods of chemical delivery exist. These pose a moderate competitive threat, particularly in less demanding applications.
- End-User Demographics: The primary end-use sectors include the critical operations of the oil and gas industry (upstream, midstream, and downstream), chemical processing plants, municipal and industrial water treatment facilities, and power generation facilities.
- M&A Activities: The industry has witnessed a notable trend of consolidation in recent years, with merger and acquisition activities totaling over **[Insert Value]** Million USD in the last five years, signaling strategic expansion and market reshaping.
Chemical Injection Metering Pumps and Valves Industry Market Dynamics & Trends
The Chemical Injection Metering Pumps and Valves market is experiencing robust expansion, propelled by several converging forces. A primary driver is the escalating demand from the oil and gas sector, which requires precise chemical injection for various processes. Concurrently, the broader adoption of advanced metering and control technologies across diverse industrial sectors is significantly contributing to market growth. Technological innovations, such as the seamless integration of smart sensors for real-time monitoring and the implementation of predictive maintenance capabilities, are markedly enhancing operational efficiency, minimizing costly downtime, and improving system longevity. Consumer and regulatory preferences are increasingly leaning towards sustainable and environmentally responsible solutions, creating substantial opportunities for manufacturers to develop and market eco-conscious products. The competitive arena is defined by relentless innovation, the formation of strategic alliances, and a strong emphasis on delivering tailor-made solutions that precisely address the unique operational requirements of individual customers. The market is projected to achieve a Compound Annual Growth Rate (CAGR) of **[Insert Percentage]**% between 2025 and 2033, with market penetration expected to reach approximately **[Insert Percentage]**% in key geographical regions by the end of this forecast period.
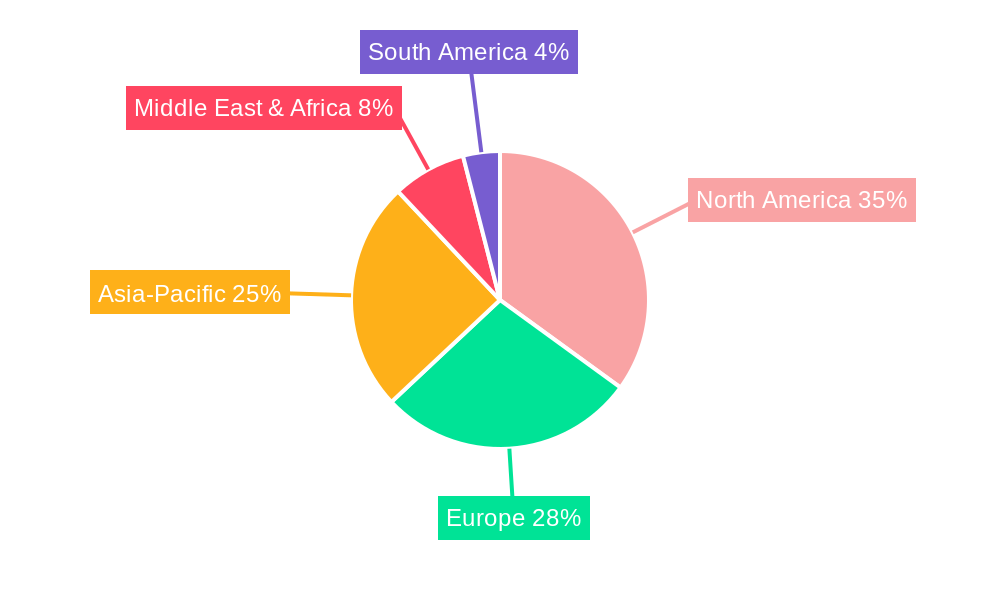
Dominant Regions & Segments in Chemical Injection Metering Pumps and Valves Industry
North America currently holds the leading position in the Chemical Injection Metering Pumps and Valves market, driven by robust demand from the oil & gas and chemical processing sectors, along with supportive government policies and strong technological infrastructure.
- Key Drivers in North America:
- Strong presence of major industry players and robust manufacturing capabilities.
- High adoption of advanced technologies and automation.
- Favorable regulatory environment promoting the use of advanced chemical injection systems.
- Significant investments in infrastructure development projects.
Further analysis reveals that the dominant segment within the market is the oil and gas industry, significantly contributing to the overall market value. The segment's substantial growth is primarily fueled by the expansion of exploration and production activities globally.
Chemical Injection Metering Pumps and Valves Industry Product Innovations
Recent years have witnessed significant advancements in Chemical Injection Metering Pumps and Valves technology, focusing on enhanced precision, durability, and efficiency. The integration of smart sensors and digital control systems enables real-time monitoring and predictive maintenance, reducing operational costs and downtime. New materials and designs are improving the pumps' resistance to corrosion and wear, extending their lifespan and enhancing performance in harsh environments. These innovations better address industry demands for precise chemical injection across diverse applications, particularly within the demanding oil and gas and chemical processing sectors.
Report Scope & Segmentation Analysis
This comprehensive report meticulously segments the Chemical Injection Metering Pumps and Valves market to provide detailed insights. The segmentation is based on key parameters including pump type (e.g., positive displacement pumps, diaphragm pumps, piston pumps), valve type (e.g., ball valves, butterfly valves, globe valves), the specific end-use industry (e.g., oil & gas, chemical processing, water treatment, power generation), and geographical region (North America, Europe, Asia-Pacific, Middle East & Africa, South America). For each segment, the report offers detailed growth projections, current market sizes, and an in-depth analysis of competitive dynamics. For instance, the positive displacement pump segment is anticipated to demonstrate a robust CAGR of **[Insert Percentage]**%, largely attributed to its inherent high precision and exceptional reliability in critical applications.
Key Drivers of Chemical Injection Metering Pumps and Valves Industry Growth
Several factors are driving the growth of the Chemical Injection Metering Pumps and Valves industry. The increasing demand for efficient and precise chemical injection systems across various industries, particularly in oil & gas and chemical processing, is a major driver. Stringent environmental regulations worldwide are mandating the adoption of advanced technologies to minimize environmental impact. Furthermore, technological advancements, such as the integration of smart sensors and digital control systems, are enhancing operational efficiency and reducing costs.
Challenges in the Chemical Injection Metering Pumps and Valves Industry Sector
The Chemical Injection Metering Pumps and Valves industry faces certain challenges. Fluctuations in commodity prices and raw material costs impact profitability. The competitive landscape is characterized by intense rivalry, requiring continuous innovation and cost optimization. Supply chain disruptions and geopolitical instability can affect the availability of components and raw materials. Moreover, stringent safety and environmental regulations necessitate significant investment in compliance measures. These factors together create a complex operating environment.
Emerging Opportunities in Chemical Injection Metering Pumps and Valves Industry
The industry presents several promising opportunities. The growing adoption of automation and digitization across various industries opens avenues for the development and integration of smart chemical injection systems. The increasing demand for sustainable and eco-friendly solutions drives the development of energy-efficient and environmentally friendly products. Expansion into emerging markets, particularly in Asia-Pacific, offers significant growth potential. Furthermore, technological advancements like the use of AI and machine learning create possibilities for predictive maintenance and optimized chemical injection processes.
Leading Players in the Chemical Injection Metering Pumps and Valves Industry Market
- Cameron (Schlumberger)
- Hunting PLC
- Idex Corporation
- ITC Dosing Pumps
- Lewa GmbH
- McFarland-Tritan LLC
- Milton Roy
- ProMinent
- Seepex GmbH
- Seko SpA
- SkoFlo Industries Inc
- SPX FLOW Inc
- Swelore Engineering Pvt Ltd
- List Not Exhaustive
Key Developments in Chemical Injection Metering Pumps and Valves Industry Industry
- 2022 Q4: SPX FLOW Inc. unveiled an innovative new series of smart metering pumps, featuring integrated connectivity for enhanced remote monitoring and control capabilities.
- 2023 Q1: Lewa GmbH solidified its strategic foothold in the Asian market by announcing a significant partnership aimed at expanding its distribution network and customer support.
- 2023 Q2: A landmark merger between two prominent industry players occurred, substantially reshaping the competitive landscape and market dynamics. (Further strategic implications are detailed within the full report)
- Additional detailed analyses of pivotal developments and their profound market impact are comprehensively covered in the full report.
Future Outlook for Chemical Injection Metering Pumps and Valves Industry Market
The trajectory for the Chemical Injection Metering Pumps and Valves industry is exceptionally promising, indicating sustained and significant growth. This optimistic outlook is underpinned by the persistent and increasing demand from vital end-use sectors, the continuous evolution of technological frontiers, and the strategic expansion into emerging and untapped markets. A paramount focus on environmental sustainability and the pervasive integration of digitalization will undoubtedly be the cornerstones that shape future product development strategies and overarching market approaches. The landscape remains rich with opportunities for pioneering innovation and the forging of impactful strategic partnerships, presenting considerable potential for market leadership and enduring commercial success.
Chemical Injection Metering Pumps and Valves Industry Segmentation
-
1. Pump Type
- 1.1. Diaphragm
- 1.2. Piston/Plunger
- 1.3. Other Pump Types
-
2. End-user Industry
- 2.1. Energy, Power, and Chemicals
- 2.2. Oil and Gas
- 2.3. Water and Wastewater Treatment
- 2.4. Food and Beverage
- 2.5. Pharmaceutical
Chemical Injection Metering Pumps and Valves Industry Segmentation By Geography
-
1. Asia Pacific
- 1.1. China
- 1.2. India
- 1.3. Japan
- 1.4. South Korea
- 1.5. ASEAN Countries
- 1.6. Australia and New Zealand
- 1.7. Rest of Asia Pacific
-
2. North America
- 2.1. United States
- 2.2. Canada
- 2.3. Mexico
-
3. Europe
- 3.1. Germany
- 3.2. United Kingdom
- 3.3. Italy
- 3.4. France
- 3.5. Russia
- 3.6. Spain
- 3.7. Rest of Europe
-
4. South America
- 4.1. Brazil
- 4.2. Argentina
- 4.3. Rest of South America
-
5. Middle East and Africa
- 5.1. Saudi Arabia
- 5.2. South Africa
- 5.3. Rest of Middle East and Africa
Chemical Injection Metering Pumps and Valves Industry Regional Market Share
Geographic Coverage of Chemical Injection Metering Pumps and Valves Industry
Chemical Injection Metering Pumps and Valves Industry REPORT HIGHLIGHTS
| Aspects | Details |
|---|---|
| Study Period | 2020-2034 |
| Base Year | 2025 |
| Estimated Year | 2026 |
| Forecast Period | 2026-2034 |
| Historical Period | 2020-2025 |
| Growth Rate | CAGR of 2.79% from 2020-2034 |
| Segmentation |
|
Table of Contents
- 1. Introduction
- 1.1. Research Scope
- 1.2. Market Segmentation
- 1.3. Research Objective
- 1.4. Definitions and Assumptions
- 2. Executive Summary
- 2.1. Market Snapshot
- 3. Market Dynamics
- 3.1. Market Drivers
- 3.2. Market Restrains
- 3.3. Market Trends
- 3.4. Market Opportunities
- 4. Market Factor Analysis
- 4.1. Porters Five Forces
- 4.1.1. Bargaining Power of Suppliers
- 4.1.2. Bargaining Power of Buyers
- 4.1.3. Threat of New Entrants
- 4.1.4. Threat of Substitutes
- 4.1.5. Competitive Rivalry
- 4.2. PESTEL analysis
- 4.3. BCG Analysis
- 4.3.1. Stars (High Growth, High Market Share)
- 4.3.2. Cash Cows (Low Growth, High Market Share)
- 4.3.3. Question Mark (High Growth, Low Market Share)
- 4.3.4. Dogs (Low Growth, Low Market Share)
- 4.4. Ansoff Matrix Analysis
- 4.5. Supply Chain Analysis
- 4.6. Regulatory Landscape
- 4.7. Current Market Potential and Opportunity Assessment (TAM–SAM–SOM Framework)
- 4.8. PRI Analyst Note
- 4.1. Porters Five Forces
- 5. Market Analysis, Insights and Forecast 2021-2033
- 5.1. Market Analysis, Insights and Forecast - by Pump Type
- 5.1.1. Diaphragm
- 5.1.2. Piston/Plunger
- 5.1.3. Other Pump Types
- 5.2. Market Analysis, Insights and Forecast - by End-user Industry
- 5.2.1. Energy, Power, and Chemicals
- 5.2.2. Oil and Gas
- 5.2.3. Water and Wastewater Treatment
- 5.2.4. Food and Beverage
- 5.2.5. Pharmaceutical
- 5.3. Market Analysis, Insights and Forecast - by Region
- 5.3.1. Asia Pacific
- 5.3.2. North America
- 5.3.3. Europe
- 5.3.4. South America
- 5.3.5. Middle East and Africa
- 5.1. Market Analysis, Insights and Forecast - by Pump Type
- 6. Global Chemical Injection Metering Pumps and Valves Industry Analysis, Insights and Forecast, 2021-2033
- 6.1. Market Analysis, Insights and Forecast - by Pump Type
- 6.1.1. Diaphragm
- 6.1.2. Piston/Plunger
- 6.1.3. Other Pump Types
- 6.2. Market Analysis, Insights and Forecast - by End-user Industry
- 6.2.1. Energy, Power, and Chemicals
- 6.2.2. Oil and Gas
- 6.2.3. Water and Wastewater Treatment
- 6.2.4. Food and Beverage
- 6.2.5. Pharmaceutical
- 6.1. Market Analysis, Insights and Forecast - by Pump Type
- 7. Asia Pacific Chemical Injection Metering Pumps and Valves Industry Analysis, Insights and Forecast, 2020-2032
- 7.1. Market Analysis, Insights and Forecast - by Pump Type
- 7.1.1. Diaphragm
- 7.1.2. Piston/Plunger
- 7.1.3. Other Pump Types
- 7.2. Market Analysis, Insights and Forecast - by End-user Industry
- 7.2.1. Energy, Power, and Chemicals
- 7.2.2. Oil and Gas
- 7.2.3. Water and Wastewater Treatment
- 7.2.4. Food and Beverage
- 7.2.5. Pharmaceutical
- 7.1. Market Analysis, Insights and Forecast - by Pump Type
- 8. North America Chemical Injection Metering Pumps and Valves Industry Analysis, Insights and Forecast, 2020-2032
- 8.1. Market Analysis, Insights and Forecast - by Pump Type
- 8.1.1. Diaphragm
- 8.1.2. Piston/Plunger
- 8.1.3. Other Pump Types
- 8.2. Market Analysis, Insights and Forecast - by End-user Industry
- 8.2.1. Energy, Power, and Chemicals
- 8.2.2. Oil and Gas
- 8.2.3. Water and Wastewater Treatment
- 8.2.4. Food and Beverage
- 8.2.5. Pharmaceutical
- 8.1. Market Analysis, Insights and Forecast - by Pump Type
- 9. Europe Chemical Injection Metering Pumps and Valves Industry Analysis, Insights and Forecast, 2020-2032
- 9.1. Market Analysis, Insights and Forecast - by Pump Type
- 9.1.1. Diaphragm
- 9.1.2. Piston/Plunger
- 9.1.3. Other Pump Types
- 9.2. Market Analysis, Insights and Forecast - by End-user Industry
- 9.2.1. Energy, Power, and Chemicals
- 9.2.2. Oil and Gas
- 9.2.3. Water and Wastewater Treatment
- 9.2.4. Food and Beverage
- 9.2.5. Pharmaceutical
- 9.1. Market Analysis, Insights and Forecast - by Pump Type
- 10. South America Chemical Injection Metering Pumps and Valves Industry Analysis, Insights and Forecast, 2020-2032
- 10.1. Market Analysis, Insights and Forecast - by Pump Type
- 10.1.1. Diaphragm
- 10.1.2. Piston/Plunger
- 10.1.3. Other Pump Types
- 10.2. Market Analysis, Insights and Forecast - by End-user Industry
- 10.2.1. Energy, Power, and Chemicals
- 10.2.2. Oil and Gas
- 10.2.3. Water and Wastewater Treatment
- 10.2.4. Food and Beverage
- 10.2.5. Pharmaceutical
- 10.1. Market Analysis, Insights and Forecast - by Pump Type
- 11. Middle East and Africa Chemical Injection Metering Pumps and Valves Industry Analysis, Insights and Forecast, 2020-2032
- 11.1. Market Analysis, Insights and Forecast - by Pump Type
- 11.1.1. Diaphragm
- 11.1.2. Piston/Plunger
- 11.1.3. Other Pump Types
- 11.2. Market Analysis, Insights and Forecast - by End-user Industry
- 11.2.1. Energy, Power, and Chemicals
- 11.2.2. Oil and Gas
- 11.2.3. Water and Wastewater Treatment
- 11.2.4. Food and Beverage
- 11.2.5. Pharmaceutical
- 11.1. Market Analysis, Insights and Forecast - by Pump Type
- 12. Competitive Analysis
- 12.1. Company Profiles
- 12.1.1 Cameron (Schlumberger)
- 12.1.1.1. Company Overview
- 12.1.1.2. Products
- 12.1.1.3. Company Financials
- 12.1.1.4. SWOT Analysis
- 12.1.2 Hunting PLC
- 12.1.2.1. Company Overview
- 12.1.2.2. Products
- 12.1.2.3. Company Financials
- 12.1.2.4. SWOT Analysis
- 12.1.3 Idex Corporation
- 12.1.3.1. Company Overview
- 12.1.3.2. Products
- 12.1.3.3. Company Financials
- 12.1.3.4. SWOT Analysis
- 12.1.4 ITC Dosing Pumps
- 12.1.4.1. Company Overview
- 12.1.4.2. Products
- 12.1.4.3. Company Financials
- 12.1.4.4. SWOT Analysis
- 12.1.5 Lewa GmbH
- 12.1.5.1. Company Overview
- 12.1.5.2. Products
- 12.1.5.3. Company Financials
- 12.1.5.4. SWOT Analysis
- 12.1.6 McFarland-Tritan LLC
- 12.1.6.1. Company Overview
- 12.1.6.2. Products
- 12.1.6.3. Company Financials
- 12.1.6.4. SWOT Analysis
- 12.1.7 Milton Roy
- 12.1.7.1. Company Overview
- 12.1.7.2. Products
- 12.1.7.3. Company Financials
- 12.1.7.4. SWOT Analysis
- 12.1.8 ProMinent
- 12.1.8.1. Company Overview
- 12.1.8.2. Products
- 12.1.8.3. Company Financials
- 12.1.8.4. SWOT Analysis
- 12.1.9 Seepex GmbH
- 12.1.9.1. Company Overview
- 12.1.9.2. Products
- 12.1.9.3. Company Financials
- 12.1.9.4. SWOT Analysis
- 12.1.10 Seko SpA
- 12.1.10.1. Company Overview
- 12.1.10.2. Products
- 12.1.10.3. Company Financials
- 12.1.10.4. SWOT Analysis
- 12.1.11 SkoFlo Industries Inc
- 12.1.11.1. Company Overview
- 12.1.11.2. Products
- 12.1.11.3. Company Financials
- 12.1.11.4. SWOT Analysis
- 12.1.12 SPX FLOW Inc
- 12.1.12.1. Company Overview
- 12.1.12.2. Products
- 12.1.12.3. Company Financials
- 12.1.12.4. SWOT Analysis
- 12.1.13 Swelore Engineering Pvt Ltd *List Not Exhaustive
- 12.1.13.1. Company Overview
- 12.1.13.2. Products
- 12.1.13.3. Company Financials
- 12.1.13.4. SWOT Analysis
- 12.1.1 Cameron (Schlumberger)
- 12.2. Market Entropy
- 12.2.1 Company's Key Areas Served
- 12.2.2 Recent Developments
- 12.3. Company Market Share Analysis 2025
- 12.3.1 Top 5 Companies Market Share Analysis
- 12.3.2 Top 3 Companies Market Share Analysis
- 12.4. List of Potential Customers
- 13. Research Methodology
List of Figures
- Figure 1: Global Chemical Injection Metering Pumps and Valves Industry Revenue Breakdown (Million, %) by Region 2025 & 2033
- Figure 2: Global Chemical Injection Metering Pumps and Valves Industry Volume Breakdown (Billion, %) by Region 2025 & 2033
- Figure 3: Asia Pacific Chemical Injection Metering Pumps and Valves Industry Revenue (Million), by Pump Type 2025 & 2033
- Figure 4: Asia Pacific Chemical Injection Metering Pumps and Valves Industry Volume (Billion), by Pump Type 2025 & 2033
- Figure 5: Asia Pacific Chemical Injection Metering Pumps and Valves Industry Revenue Share (%), by Pump Type 2025 & 2033
- Figure 6: Asia Pacific Chemical Injection Metering Pumps and Valves Industry Volume Share (%), by Pump Type 2025 & 2033
- Figure 7: Asia Pacific Chemical Injection Metering Pumps and Valves Industry Revenue (Million), by End-user Industry 2025 & 2033
- Figure 8: Asia Pacific Chemical Injection Metering Pumps and Valves Industry Volume (Billion), by End-user Industry 2025 & 2033
- Figure 9: Asia Pacific Chemical Injection Metering Pumps and Valves Industry Revenue Share (%), by End-user Industry 2025 & 2033
- Figure 10: Asia Pacific Chemical Injection Metering Pumps and Valves Industry Volume Share (%), by End-user Industry 2025 & 2033
- Figure 11: Asia Pacific Chemical Injection Metering Pumps and Valves Industry Revenue (Million), by Country 2025 & 2033
- Figure 12: Asia Pacific Chemical Injection Metering Pumps and Valves Industry Volume (Billion), by Country 2025 & 2033
- Figure 13: Asia Pacific Chemical Injection Metering Pumps and Valves Industry Revenue Share (%), by Country 2025 & 2033
- Figure 14: Asia Pacific Chemical Injection Metering Pumps and Valves Industry Volume Share (%), by Country 2025 & 2033
- Figure 15: North America Chemical Injection Metering Pumps and Valves Industry Revenue (Million), by Pump Type 2025 & 2033
- Figure 16: North America Chemical Injection Metering Pumps and Valves Industry Volume (Billion), by Pump Type 2025 & 2033
- Figure 17: North America Chemical Injection Metering Pumps and Valves Industry Revenue Share (%), by Pump Type 2025 & 2033
- Figure 18: North America Chemical Injection Metering Pumps and Valves Industry Volume Share (%), by Pump Type 2025 & 2033
- Figure 19: North America Chemical Injection Metering Pumps and Valves Industry Revenue (Million), by End-user Industry 2025 & 2033
- Figure 20: North America Chemical Injection Metering Pumps and Valves Industry Volume (Billion), by End-user Industry 2025 & 2033
- Figure 21: North America Chemical Injection Metering Pumps and Valves Industry Revenue Share (%), by End-user Industry 2025 & 2033
- Figure 22: North America Chemical Injection Metering Pumps and Valves Industry Volume Share (%), by End-user Industry 2025 & 2033
- Figure 23: North America Chemical Injection Metering Pumps and Valves Industry Revenue (Million), by Country 2025 & 2033
- Figure 24: North America Chemical Injection Metering Pumps and Valves Industry Volume (Billion), by Country 2025 & 2033
- Figure 25: North America Chemical Injection Metering Pumps and Valves Industry Revenue Share (%), by Country 2025 & 2033
- Figure 26: North America Chemical Injection Metering Pumps and Valves Industry Volume Share (%), by Country 2025 & 2033
- Figure 27: Europe Chemical Injection Metering Pumps and Valves Industry Revenue (Million), by Pump Type 2025 & 2033
- Figure 28: Europe Chemical Injection Metering Pumps and Valves Industry Volume (Billion), by Pump Type 2025 & 2033
- Figure 29: Europe Chemical Injection Metering Pumps and Valves Industry Revenue Share (%), by Pump Type 2025 & 2033
- Figure 30: Europe Chemical Injection Metering Pumps and Valves Industry Volume Share (%), by Pump Type 2025 & 2033
- Figure 31: Europe Chemical Injection Metering Pumps and Valves Industry Revenue (Million), by End-user Industry 2025 & 2033
- Figure 32: Europe Chemical Injection Metering Pumps and Valves Industry Volume (Billion), by End-user Industry 2025 & 2033
- Figure 33: Europe Chemical Injection Metering Pumps and Valves Industry Revenue Share (%), by End-user Industry 2025 & 2033
- Figure 34: Europe Chemical Injection Metering Pumps and Valves Industry Volume Share (%), by End-user Industry 2025 & 2033
- Figure 35: Europe Chemical Injection Metering Pumps and Valves Industry Revenue (Million), by Country 2025 & 2033
- Figure 36: Europe Chemical Injection Metering Pumps and Valves Industry Volume (Billion), by Country 2025 & 2033
- Figure 37: Europe Chemical Injection Metering Pumps and Valves Industry Revenue Share (%), by Country 2025 & 2033
- Figure 38: Europe Chemical Injection Metering Pumps and Valves Industry Volume Share (%), by Country 2025 & 2033
- Figure 39: South America Chemical Injection Metering Pumps and Valves Industry Revenue (Million), by Pump Type 2025 & 2033
- Figure 40: South America Chemical Injection Metering Pumps and Valves Industry Volume (Billion), by Pump Type 2025 & 2033
- Figure 41: South America Chemical Injection Metering Pumps and Valves Industry Revenue Share (%), by Pump Type 2025 & 2033
- Figure 42: South America Chemical Injection Metering Pumps and Valves Industry Volume Share (%), by Pump Type 2025 & 2033
- Figure 43: South America Chemical Injection Metering Pumps and Valves Industry Revenue (Million), by End-user Industry 2025 & 2033
- Figure 44: South America Chemical Injection Metering Pumps and Valves Industry Volume (Billion), by End-user Industry 2025 & 2033
- Figure 45: South America Chemical Injection Metering Pumps and Valves Industry Revenue Share (%), by End-user Industry 2025 & 2033
- Figure 46: South America Chemical Injection Metering Pumps and Valves Industry Volume Share (%), by End-user Industry 2025 & 2033
- Figure 47: South America Chemical Injection Metering Pumps and Valves Industry Revenue (Million), by Country 2025 & 2033
- Figure 48: South America Chemical Injection Metering Pumps and Valves Industry Volume (Billion), by Country 2025 & 2033
- Figure 49: South America Chemical Injection Metering Pumps and Valves Industry Revenue Share (%), by Country 2025 & 2033
- Figure 50: South America Chemical Injection Metering Pumps and Valves Industry Volume Share (%), by Country 2025 & 2033
- Figure 51: Middle East and Africa Chemical Injection Metering Pumps and Valves Industry Revenue (Million), by Pump Type 2025 & 2033
- Figure 52: Middle East and Africa Chemical Injection Metering Pumps and Valves Industry Volume (Billion), by Pump Type 2025 & 2033
- Figure 53: Middle East and Africa Chemical Injection Metering Pumps and Valves Industry Revenue Share (%), by Pump Type 2025 & 2033
- Figure 54: Middle East and Africa Chemical Injection Metering Pumps and Valves Industry Volume Share (%), by Pump Type 2025 & 2033
- Figure 55: Middle East and Africa Chemical Injection Metering Pumps and Valves Industry Revenue (Million), by End-user Industry 2025 & 2033
- Figure 56: Middle East and Africa Chemical Injection Metering Pumps and Valves Industry Volume (Billion), by End-user Industry 2025 & 2033
- Figure 57: Middle East and Africa Chemical Injection Metering Pumps and Valves Industry Revenue Share (%), by End-user Industry 2025 & 2033
- Figure 58: Middle East and Africa Chemical Injection Metering Pumps and Valves Industry Volume Share (%), by End-user Industry 2025 & 2033
- Figure 59: Middle East and Africa Chemical Injection Metering Pumps and Valves Industry Revenue (Million), by Country 2025 & 2033
- Figure 60: Middle East and Africa Chemical Injection Metering Pumps and Valves Industry Volume (Billion), by Country 2025 & 2033
- Figure 61: Middle East and Africa Chemical Injection Metering Pumps and Valves Industry Revenue Share (%), by Country 2025 & 2033
- Figure 62: Middle East and Africa Chemical Injection Metering Pumps and Valves Industry Volume Share (%), by Country 2025 & 2033
List of Tables
- Table 1: Global Chemical Injection Metering Pumps and Valves Industry Revenue Million Forecast, by Pump Type 2020 & 2033
- Table 2: Global Chemical Injection Metering Pumps and Valves Industry Volume Billion Forecast, by Pump Type 2020 & 2033
- Table 3: Global Chemical Injection Metering Pumps and Valves Industry Revenue Million Forecast, by End-user Industry 2020 & 2033
- Table 4: Global Chemical Injection Metering Pumps and Valves Industry Volume Billion Forecast, by End-user Industry 2020 & 2033
- Table 5: Global Chemical Injection Metering Pumps and Valves Industry Revenue Million Forecast, by Region 2020 & 2033
- Table 6: Global Chemical Injection Metering Pumps and Valves Industry Volume Billion Forecast, by Region 2020 & 2033
- Table 7: Global Chemical Injection Metering Pumps and Valves Industry Revenue Million Forecast, by Pump Type 2020 & 2033
- Table 8: Global Chemical Injection Metering Pumps and Valves Industry Volume Billion Forecast, by Pump Type 2020 & 2033
- Table 9: Global Chemical Injection Metering Pumps and Valves Industry Revenue Million Forecast, by End-user Industry 2020 & 2033
- Table 10: Global Chemical Injection Metering Pumps and Valves Industry Volume Billion Forecast, by End-user Industry 2020 & 2033
- Table 11: Global Chemical Injection Metering Pumps and Valves Industry Revenue Million Forecast, by Country 2020 & 2033
- Table 12: Global Chemical Injection Metering Pumps and Valves Industry Volume Billion Forecast, by Country 2020 & 2033
- Table 13: China Chemical Injection Metering Pumps and Valves Industry Revenue (Million) Forecast, by Application 2020 & 2033
- Table 14: China Chemical Injection Metering Pumps and Valves Industry Volume (Billion) Forecast, by Application 2020 & 2033
- Table 15: India Chemical Injection Metering Pumps and Valves Industry Revenue (Million) Forecast, by Application 2020 & 2033
- Table 16: India Chemical Injection Metering Pumps and Valves Industry Volume (Billion) Forecast, by Application 2020 & 2033
- Table 17: Japan Chemical Injection Metering Pumps and Valves Industry Revenue (Million) Forecast, by Application 2020 & 2033
- Table 18: Japan Chemical Injection Metering Pumps and Valves Industry Volume (Billion) Forecast, by Application 2020 & 2033
- Table 19: South Korea Chemical Injection Metering Pumps and Valves Industry Revenue (Million) Forecast, by Application 2020 & 2033
- Table 20: South Korea Chemical Injection Metering Pumps and Valves Industry Volume (Billion) Forecast, by Application 2020 & 2033
- Table 21: ASEAN Countries Chemical Injection Metering Pumps and Valves Industry Revenue (Million) Forecast, by Application 2020 & 2033
- Table 22: ASEAN Countries Chemical Injection Metering Pumps and Valves Industry Volume (Billion) Forecast, by Application 2020 & 2033
- Table 23: Australia and New Zealand Chemical Injection Metering Pumps and Valves Industry Revenue (Million) Forecast, by Application 2020 & 2033
- Table 24: Australia and New Zealand Chemical Injection Metering Pumps and Valves Industry Volume (Billion) Forecast, by Application 2020 & 2033
- Table 25: Rest of Asia Pacific Chemical Injection Metering Pumps and Valves Industry Revenue (Million) Forecast, by Application 2020 & 2033
- Table 26: Rest of Asia Pacific Chemical Injection Metering Pumps and Valves Industry Volume (Billion) Forecast, by Application 2020 & 2033
- Table 27: Global Chemical Injection Metering Pumps and Valves Industry Revenue Million Forecast, by Pump Type 2020 & 2033
- Table 28: Global Chemical Injection Metering Pumps and Valves Industry Volume Billion Forecast, by Pump Type 2020 & 2033
- Table 29: Global Chemical Injection Metering Pumps and Valves Industry Revenue Million Forecast, by End-user Industry 2020 & 2033
- Table 30: Global Chemical Injection Metering Pumps and Valves Industry Volume Billion Forecast, by End-user Industry 2020 & 2033
- Table 31: Global Chemical Injection Metering Pumps and Valves Industry Revenue Million Forecast, by Country 2020 & 2033
- Table 32: Global Chemical Injection Metering Pumps and Valves Industry Volume Billion Forecast, by Country 2020 & 2033
- Table 33: United States Chemical Injection Metering Pumps and Valves Industry Revenue (Million) Forecast, by Application 2020 & 2033
- Table 34: United States Chemical Injection Metering Pumps and Valves Industry Volume (Billion) Forecast, by Application 2020 & 2033
- Table 35: Canada Chemical Injection Metering Pumps and Valves Industry Revenue (Million) Forecast, by Application 2020 & 2033
- Table 36: Canada Chemical Injection Metering Pumps and Valves Industry Volume (Billion) Forecast, by Application 2020 & 2033
- Table 37: Mexico Chemical Injection Metering Pumps and Valves Industry Revenue (Million) Forecast, by Application 2020 & 2033
- Table 38: Mexico Chemical Injection Metering Pumps and Valves Industry Volume (Billion) Forecast, by Application 2020 & 2033
- Table 39: Global Chemical Injection Metering Pumps and Valves Industry Revenue Million Forecast, by Pump Type 2020 & 2033
- Table 40: Global Chemical Injection Metering Pumps and Valves Industry Volume Billion Forecast, by Pump Type 2020 & 2033
- Table 41: Global Chemical Injection Metering Pumps and Valves Industry Revenue Million Forecast, by End-user Industry 2020 & 2033
- Table 42: Global Chemical Injection Metering Pumps and Valves Industry Volume Billion Forecast, by End-user Industry 2020 & 2033
- Table 43: Global Chemical Injection Metering Pumps and Valves Industry Revenue Million Forecast, by Country 2020 & 2033
- Table 44: Global Chemical Injection Metering Pumps and Valves Industry Volume Billion Forecast, by Country 2020 & 2033
- Table 45: Germany Chemical Injection Metering Pumps and Valves Industry Revenue (Million) Forecast, by Application 2020 & 2033
- Table 46: Germany Chemical Injection Metering Pumps and Valves Industry Volume (Billion) Forecast, by Application 2020 & 2033
- Table 47: United Kingdom Chemical Injection Metering Pumps and Valves Industry Revenue (Million) Forecast, by Application 2020 & 2033
- Table 48: United Kingdom Chemical Injection Metering Pumps and Valves Industry Volume (Billion) Forecast, by Application 2020 & 2033
- Table 49: Italy Chemical Injection Metering Pumps and Valves Industry Revenue (Million) Forecast, by Application 2020 & 2033
- Table 50: Italy Chemical Injection Metering Pumps and Valves Industry Volume (Billion) Forecast, by Application 2020 & 2033
- Table 51: France Chemical Injection Metering Pumps and Valves Industry Revenue (Million) Forecast, by Application 2020 & 2033
- Table 52: France Chemical Injection Metering Pumps and Valves Industry Volume (Billion) Forecast, by Application 2020 & 2033
- Table 53: Russia Chemical Injection Metering Pumps and Valves Industry Revenue (Million) Forecast, by Application 2020 & 2033
- Table 54: Russia Chemical Injection Metering Pumps and Valves Industry Volume (Billion) Forecast, by Application 2020 & 2033
- Table 55: Spain Chemical Injection Metering Pumps and Valves Industry Revenue (Million) Forecast, by Application 2020 & 2033
- Table 56: Spain Chemical Injection Metering Pumps and Valves Industry Volume (Billion) Forecast, by Application 2020 & 2033
- Table 57: Rest of Europe Chemical Injection Metering Pumps and Valves Industry Revenue (Million) Forecast, by Application 2020 & 2033
- Table 58: Rest of Europe Chemical Injection Metering Pumps and Valves Industry Volume (Billion) Forecast, by Application 2020 & 2033
- Table 59: Global Chemical Injection Metering Pumps and Valves Industry Revenue Million Forecast, by Pump Type 2020 & 2033
- Table 60: Global Chemical Injection Metering Pumps and Valves Industry Volume Billion Forecast, by Pump Type 2020 & 2033
- Table 61: Global Chemical Injection Metering Pumps and Valves Industry Revenue Million Forecast, by End-user Industry 2020 & 2033
- Table 62: Global Chemical Injection Metering Pumps and Valves Industry Volume Billion Forecast, by End-user Industry 2020 & 2033
- Table 63: Global Chemical Injection Metering Pumps and Valves Industry Revenue Million Forecast, by Country 2020 & 2033
- Table 64: Global Chemical Injection Metering Pumps and Valves Industry Volume Billion Forecast, by Country 2020 & 2033
- Table 65: Brazil Chemical Injection Metering Pumps and Valves Industry Revenue (Million) Forecast, by Application 2020 & 2033
- Table 66: Brazil Chemical Injection Metering Pumps and Valves Industry Volume (Billion) Forecast, by Application 2020 & 2033
- Table 67: Argentina Chemical Injection Metering Pumps and Valves Industry Revenue (Million) Forecast, by Application 2020 & 2033
- Table 68: Argentina Chemical Injection Metering Pumps and Valves Industry Volume (Billion) Forecast, by Application 2020 & 2033
- Table 69: Rest of South America Chemical Injection Metering Pumps and Valves Industry Revenue (Million) Forecast, by Application 2020 & 2033
- Table 70: Rest of South America Chemical Injection Metering Pumps and Valves Industry Volume (Billion) Forecast, by Application 2020 & 2033
- Table 71: Global Chemical Injection Metering Pumps and Valves Industry Revenue Million Forecast, by Pump Type 2020 & 2033
- Table 72: Global Chemical Injection Metering Pumps and Valves Industry Volume Billion Forecast, by Pump Type 2020 & 2033
- Table 73: Global Chemical Injection Metering Pumps and Valves Industry Revenue Million Forecast, by End-user Industry 2020 & 2033
- Table 74: Global Chemical Injection Metering Pumps and Valves Industry Volume Billion Forecast, by End-user Industry 2020 & 2033
- Table 75: Global Chemical Injection Metering Pumps and Valves Industry Revenue Million Forecast, by Country 2020 & 2033
- Table 76: Global Chemical Injection Metering Pumps and Valves Industry Volume Billion Forecast, by Country 2020 & 2033
- Table 77: Saudi Arabia Chemical Injection Metering Pumps and Valves Industry Revenue (Million) Forecast, by Application 2020 & 2033
- Table 78: Saudi Arabia Chemical Injection Metering Pumps and Valves Industry Volume (Billion) Forecast, by Application 2020 & 2033
- Table 79: South Africa Chemical Injection Metering Pumps and Valves Industry Revenue (Million) Forecast, by Application 2020 & 2033
- Table 80: South Africa Chemical Injection Metering Pumps and Valves Industry Volume (Billion) Forecast, by Application 2020 & 2033
- Table 81: Rest of Middle East and Africa Chemical Injection Metering Pumps and Valves Industry Revenue (Million) Forecast, by Application 2020 & 2033
- Table 82: Rest of Middle East and Africa Chemical Injection Metering Pumps and Valves Industry Volume (Billion) Forecast, by Application 2020 & 2033
Frequently Asked Questions
1. What is the projected Compound Annual Growth Rate (CAGR) of the Chemical Injection Metering Pumps and Valves Industry?
The projected CAGR is approximately 2.79%.
2. Which companies are prominent players in the Chemical Injection Metering Pumps and Valves Industry?
Key companies in the market include Cameron (Schlumberger), Hunting PLC, Idex Corporation, ITC Dosing Pumps, Lewa GmbH, McFarland-Tritan LLC, Milton Roy, ProMinent, Seepex GmbH, Seko SpA, SkoFlo Industries Inc, SPX FLOW Inc, Swelore Engineering Pvt Ltd *List Not Exhaustive.
3. What are the main segments of the Chemical Injection Metering Pumps and Valves Industry?
The market segments include Pump Type, End-user Industry.
4. Can you provide details about the market size?
The market size is estimated to be USD 4.57 Million as of 2022.
5. What are some drivers contributing to market growth?
Accelerating Demand from Wastewater Treatment Applications; Robust Operational Procedures for Regulating Environmental Concerns; Other Drivers.
6. What are the notable trends driving market growth?
Energy. Power. and Chemicals to Dominate the Market.
7. Are there any restraints impacting market growth?
Accelerating Demand from Wastewater Treatment Applications; Robust Operational Procedures for Regulating Environmental Concerns; Other Drivers.
8. Can you provide examples of recent developments in the market?
9. What pricing options are available for accessing the report?
Pricing options include single-user, multi-user, and enterprise licenses priced at USD 4750, USD 5250, and USD 8750 respectively.
10. Is the market size provided in terms of value or volume?
The market size is provided in terms of value, measured in Million and volume, measured in Billion.
11. Are there any specific market keywords associated with the report?
Yes, the market keyword associated with the report is "Chemical Injection Metering Pumps and Valves Industry," which aids in identifying and referencing the specific market segment covered.
12. How do I determine which pricing option suits my needs best?
The pricing options vary based on user requirements and access needs. Individual users may opt for single-user licenses, while businesses requiring broader access may choose multi-user or enterprise licenses for cost-effective access to the report.
13. Are there any additional resources or data provided in the Chemical Injection Metering Pumps and Valves Industry report?
While the report offers comprehensive insights, it's advisable to review the specific contents or supplementary materials provided to ascertain if additional resources or data are available.
14. How can I stay updated on further developments or reports in the Chemical Injection Metering Pumps and Valves Industry?
To stay informed about further developments, trends, and reports in the Chemical Injection Metering Pumps and Valves Industry, consider subscribing to industry newsletters, following relevant companies and organizations, or regularly checking reputable industry news sources and publications.
Methodology
Step 1 - Identification of Relevant Samples Size from Population Database


Step 2 - Approaches for Defining Global Market Size (Value, Volume* & Price*)

Note*: In applicable scenarios
Step 3 - Data Sources
Primary Research
- Web Analytics
- Survey Reports
- Research Institute
- Latest Research Reports
- Opinion Leaders
Secondary Research
- Annual Reports
- White Paper
- Latest Press Release
- Industry Association
- Paid Database
- Investor Presentations

Step 4 - Data Triangulation
Involves using different sources of information in order to increase the validity of a study
These sources are likely to be stakeholders in a program - participants, other researchers, program staff, other community members, and so on.
Then we put all data in single framework & apply various statistical tools to find out the dynamic on the market.
During the analysis stage, feedback from the stakeholder groups would be compared to determine areas of agreement as well as areas of divergence