

Key Insights
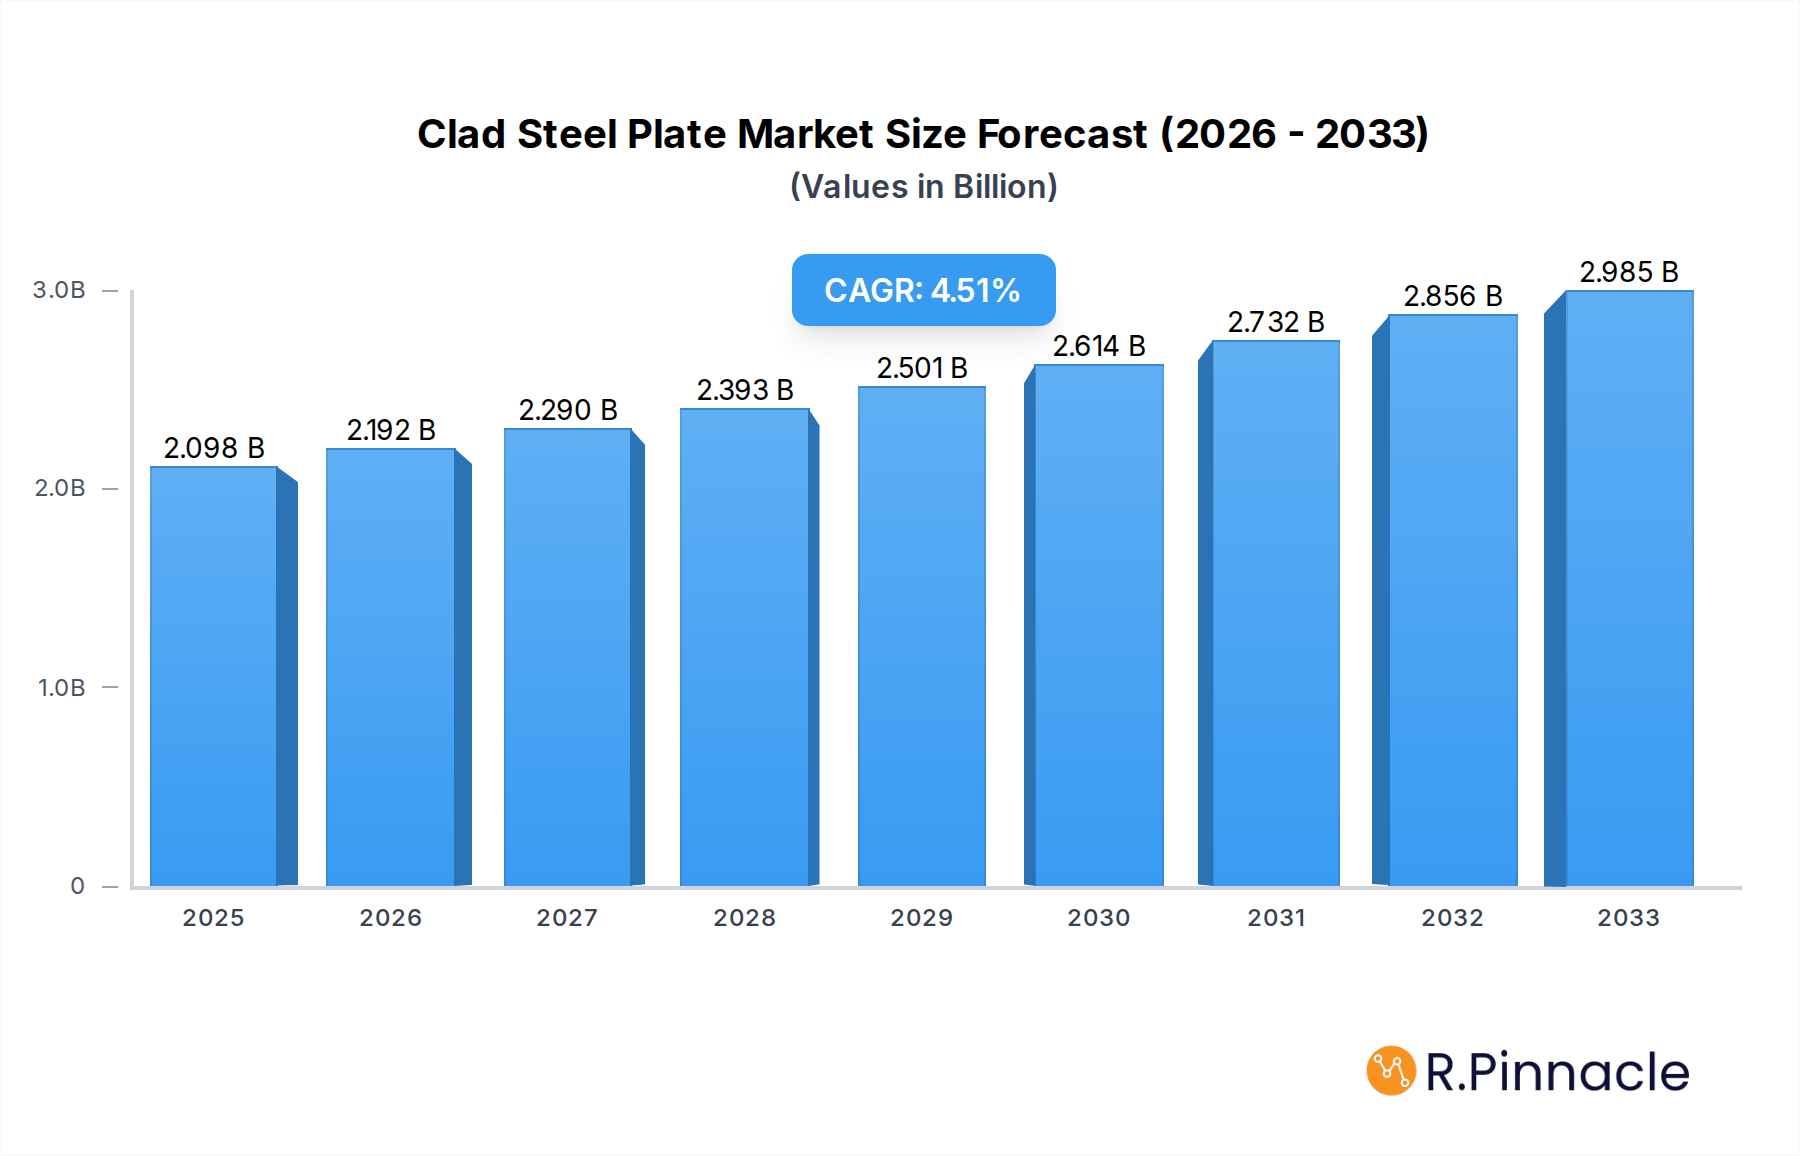
The global clad steel plate market is poised for substantial growth, projected to expand from an estimated $1923 million in 2023 to reach $3650 million by 2033, exhibiting a robust Compound Annual Growth Rate (CAGR) of 4.5% over the forecast period. This significant expansion is primarily driven by the escalating demand from core industries such as Oil & Gas and the Chemical Industry, where clad steel plates are indispensable for their corrosion resistance and structural integrity in harsh environments. The Water Treatment sector is also emerging as a key growth area, with increasing investments in infrastructure and stringent regulations necessitating advanced material solutions. Furthermore, the development of innovative manufacturing techniques for both Explosion Bonded and Roll Bonded Clad Plates is enhancing their performance characteristics and broadening their application spectrum.

Clad Steel Plate Market Size (In Billion)
The market dynamics are further shaped by several prevailing trends. A growing emphasis on sustainability and the need for materials with extended service life are pushing industries towards clad steel solutions. Technological advancements are leading to the production of thinner, yet equally robust, clad plates, offering cost efficiencies and improved fabricability. Geographically, Asia Pacific, led by China and India, is anticipated to witness the highest growth due to rapid industrialization and infrastructure development. However, the market also faces certain restraints, including the initial high cost of production and the availability of alternative materials in specific niche applications. Nevertheless, the inherent superior performance and longevity of clad steel plates are expected to outweigh these challenges, solidifying their crucial role in critical industrial applications.
Clad Steel Plate Company Market Share
Clad Steel Plate Market Structure & Innovation Trends
The clad steel plate market exhibits a moderately concentrated structure, with leading companies like Nobelclad, TISCO, and Voestalpine holding significant market share, estimated at over 30% combined. Innovation remains a critical differentiator, driven by the demand for enhanced corrosion resistance and superior performance in harsh industrial environments. Key innovation drivers include advancements in bonding techniques (explosion bonding and roll bonding) and the development of new clad material combinations to meet specific application needs in the Oil & Gas and Chemical Industries. Regulatory frameworks, particularly those concerning environmental safety and material integrity in critical infrastructure, play a pivotal role in shaping product development and adoption. While direct product substitutes are limited due to the unique properties of clad steel plates, alternative materials like solid corrosion-resistant alloys are considered. End-user demographics are primarily large industrial corporations and government entities involved in infrastructure projects, with a growing interest from emerging economies seeking to upgrade their industrial capabilities. Mergers and Acquisitions (M&A) activity in the sector is moderate, with strategic acquisitions focused on expanding technological capabilities or market reach. Past M&A deal values are estimated to be in the tens of millions.
Clad Steel Plate Market Dynamics & Trends
The clad steel plate market is experiencing robust growth, propelled by a confluence of accelerating factors. A projected Compound Annual Growth Rate (CAGR) of approximately 5.8% over the forecast period (2025–2033) underscores its upward trajectory. The primary growth driver is the escalating demand from the Oil & Gas sector for high-performance materials capable of withstanding corrosive environments in offshore exploration and onshore processing facilities. The Chemical Industry also significantly contributes to market expansion, requiring clad steel plates for reactors, pipelines, and storage tanks that handle aggressive chemicals. Technological disruptions are further fueling market penetration, with continuous improvements in clad manufacturing processes leading to enhanced product quality, reduced costs, and increased efficiency. For instance, advancements in roll bonding technology allow for larger panel sizes and tighter tolerances, appealing to fabricators. Consumer preferences are increasingly leaning towards durable, long-lasting solutions that minimize maintenance downtime and operational risks. This translates into a greater demand for specialized clad steel plates offering superior resistance to specific corrosive agents and high temperatures. Competitive dynamics are characterized by intense R&D efforts among key players such as TISCO, JSW, and Nippon Steel, who are investing heavily in developing novel clad materials and expanding their production capacities. Market penetration is deepening in developing regions as these economies industrialize and invest in critical infrastructure, requiring more sophisticated materials for their projects. The market penetration is estimated to reach 45% in key industrial sectors by the end of the forecast period.
Dominant Regions & Segments in Clad Steel Plate
Asia Pacific currently dominates the global clad steel plate market, driven by robust industrialization, substantial investments in infrastructure, and the presence of major manufacturing hubs. Within this region, China stands out as a leading country, propelled by its vast manufacturing base, significant domestic demand from its Oil & Gas and Chemical Industries, and substantial government support for advanced material production. Companies like TISCO and Shanxi Baotai are key contributors to this regional dominance.
Dominant Segments:
- Application: Oil & Gas: This segment is a major growth engine for clad steel plates.
- Key Drivers: Increased exploration and production activities, particularly in deep-sea and challenging environments, necessitate high-performance corrosion-resistant materials. The need for extended asset life and reduced maintenance costs in refineries and petrochemical plants further fuels demand. Offshore platforms, subsea pipelines, and onshore processing units are significant end-users.
- Application: Chemical Industry: Another crucial application area, demanding robust materials for handling corrosive substances.
- Key Drivers: The growing global chemical production, coupled with stricter safety regulations, drives the adoption of clad steel plates for reactors, heat exchangers, storage tanks, and piping systems. Specialized clad materials are vital for specific chemical processes, ensuring operational integrity and preventing contamination.
- Type: Roll Bonded Clad Plate: This type of clad plate holds a significant market share due to its versatility and cost-effectiveness.
- Key Drivers: Roll bonding is suitable for producing larger clad plates and offers a wide range of material combinations. Its application spans various industries, including pressure vessels, heat exchangers, and structural components in chemical and petrochemical plants. The ability to achieve good bond integrity and surface finish makes it a preferred choice for many fabricators.
The market in North America and Europe also remains substantial, driven by the presence of established Oil & Gas and Chemical industries, coupled with stringent quality and performance standards. However, the rapid industrial growth in Asia Pacific positions it as the key growth driver and dominant region for clad steel plates in the coming years.
Clad Steel Plate Product Innovations
Product innovations in the clad steel plate market are primarily focused on enhancing corrosion resistance, improving mechanical properties, and optimizing manufacturing processes. Advancements in bonding technologies, such as improved explosion bonding techniques and more efficient roll bonding methods, allow for the creation of clad plates with superior bond strength and reduced defect rates. Novel clad material combinations, incorporating high-performance alloys, are being developed to address specific extreme environments encountered in the Oil & Gas and Chemical Industries, offering extended service life and reduced maintenance. These innovations provide significant competitive advantages by enabling clients to achieve greater operational efficiency and safety.
Report Scope & Segmentation Analysis
This comprehensive report delves into the clad steel plate market, segmenting it across key applications and product types. The study period spans from 2019 to 2033, with a base year of 2025 and an estimated year of 2025, followed by a forecast period from 2025 to 2033 and a historical period from 2019 to 2024.
- Application Segmentation: The report analyzes the market across Oil & Gas, Chemical Industry, Water Treatment, and Others. Each segment's market size and growth projections are detailed, considering specific industry trends and demand drivers. The Oil & Gas segment is projected to hold the largest market share, followed by the Chemical Industry.
- Type Segmentation: The market is further segmented into Explosion Bonded Clad Plate and Roll Bonded Clad Plate. The report assesses the competitive dynamics and growth potential within each type, noting the current dominance and projected expansion of Roll Bonded Clad Plate due to its versatility.
Key Drivers of Clad Steel Plate Growth
The growth of the clad steel plate market is primarily driven by escalating demand from the Oil & Gas and Chemical Industries, where the need for corrosion-resistant and high-strength materials is paramount. Technological advancements in bonding processes, such as enhanced roll bonding and explosion bonding techniques, are leading to more efficient and cost-effective production, increasing market accessibility. Furthermore, stringent environmental regulations and safety standards across various industrial sectors mandate the use of robust materials that ensure operational integrity and longevity, further boosting demand.
Challenges in the Clad Steel Plate Sector
Despite robust growth, the clad steel plate sector faces several challenges. Fluctuations in raw material prices, particularly for specialized alloys, can impact production costs and profit margins. High initial investment costs for advanced manufacturing facilities and the specialized expertise required for production can be a barrier to entry for new players. Additionally, intense competition from established manufacturers and the potential for substitution by alternative materials in less demanding applications pose ongoing competitive pressures. Supply chain disruptions and geopolitical uncertainties can also affect the availability of key components and the timely delivery of finished products.
Emerging Opportunities in Clad Steel Plate
Emerging opportunities in the clad steel plate market are significant, driven by the expanding infrastructure development in emerging economies and the increasing focus on renewable energy projects. The growing demand for advanced materials in the Water Treatment sector, particularly for desalination plants and wastewater treatment facilities, presents a substantial growth avenue. Furthermore, technological innovations are enabling the development of new clad steel plate applications in sectors such as power generation, aerospace, and shipbuilding, where superior performance and durability are critical. The increasing adoption of digitalization and automation in manufacturing processes also offers opportunities for enhanced efficiency and product quality.
Leading Players in the Clad Steel Plate Market
- Nobelclad
- TISCO
- Energometall
- Shanxi Baotai
- Dalian Shipbuilding
- Voestalpine
- JSW
- JFE
- Nippon Steel
- Shandong Baode Metal
- Jiangsu Huahong
- Sichuan Jinglei
- Xian Tianli
Key Developments in Clad Steel Plate Industry
- 2023: TISCO announces a significant expansion of its clad steel plate production capacity to meet rising global demand, particularly from the Oil & Gas sector.
- 2022: Nobelclad introduces a new range of clad steel plates with enhanced resistance to hydrogen sulfide (H2S) corrosion, catering to challenging upstream Oil & Gas applications.
- 2021: Voestalpine invests in advanced automation for its roll bonding facilities, aiming to improve production efficiency and product consistency.
- 2020: JSW Steel develops a novel explosion bonded clad plate with a high-nickel alloy for extreme corrosive environments in the chemical processing industry.
- 2019: Nippon Steel collaborates with a leading chemical company to develop customized clad steel solutions for next-generation chemical reactors.
Future Outlook for Clad Steel Plate Market
The future outlook for the clad steel plate market is highly promising, driven by sustained demand from core industries and emerging applications. Continuous technological innovation in bonding techniques and material science will lead to the development of more specialized and high-performance clad steel plates, expanding their applicability in extreme environments. The increasing global focus on infrastructure development, energy security, and environmental sustainability will further propel the adoption of these durable and corrosion-resistant materials. Strategic investments in production capacity, coupled with a focus on research and development, will enable key players to capitalize on these growth accelerators and maintain a competitive edge in the evolving market landscape. The market is expected to witness further consolidation and strategic partnerships to leverage synergies and expand global reach.
Clad Steel Plate Segmentation
-
1. Application
- 1.1. Oil & Gas
- 1.2. Chemical Industry
- 1.3. Water Treatment
- 1.4. Others
-
2. Types
- 2.1. Explosion Bonded Clad Plate
- 2.2. Roll Bonded Clad Plate
Clad Steel Plate Segmentation By Geography
-
1. North America
- 1.1. United States
- 1.2. Canada
- 1.3. Mexico
-
2. South America
- 2.1. Brazil
- 2.2. Argentina
- 2.3. Rest of South America
-
3. Europe
- 3.1. United Kingdom
- 3.2. Germany
- 3.3. France
- 3.4. Italy
- 3.5. Spain
- 3.6. Russia
- 3.7. Benelux
- 3.8. Nordics
- 3.9. Rest of Europe
-
4. Middle East & Africa
- 4.1. Turkey
- 4.2. Israel
- 4.3. GCC
- 4.4. North Africa
- 4.5. South Africa
- 4.6. Rest of Middle East & Africa
-
5. Asia Pacific
- 5.1. China
- 5.2. India
- 5.3. Japan
- 5.4. South Korea
- 5.5. ASEAN
- 5.6. Oceania
- 5.7. Rest of Asia Pacific
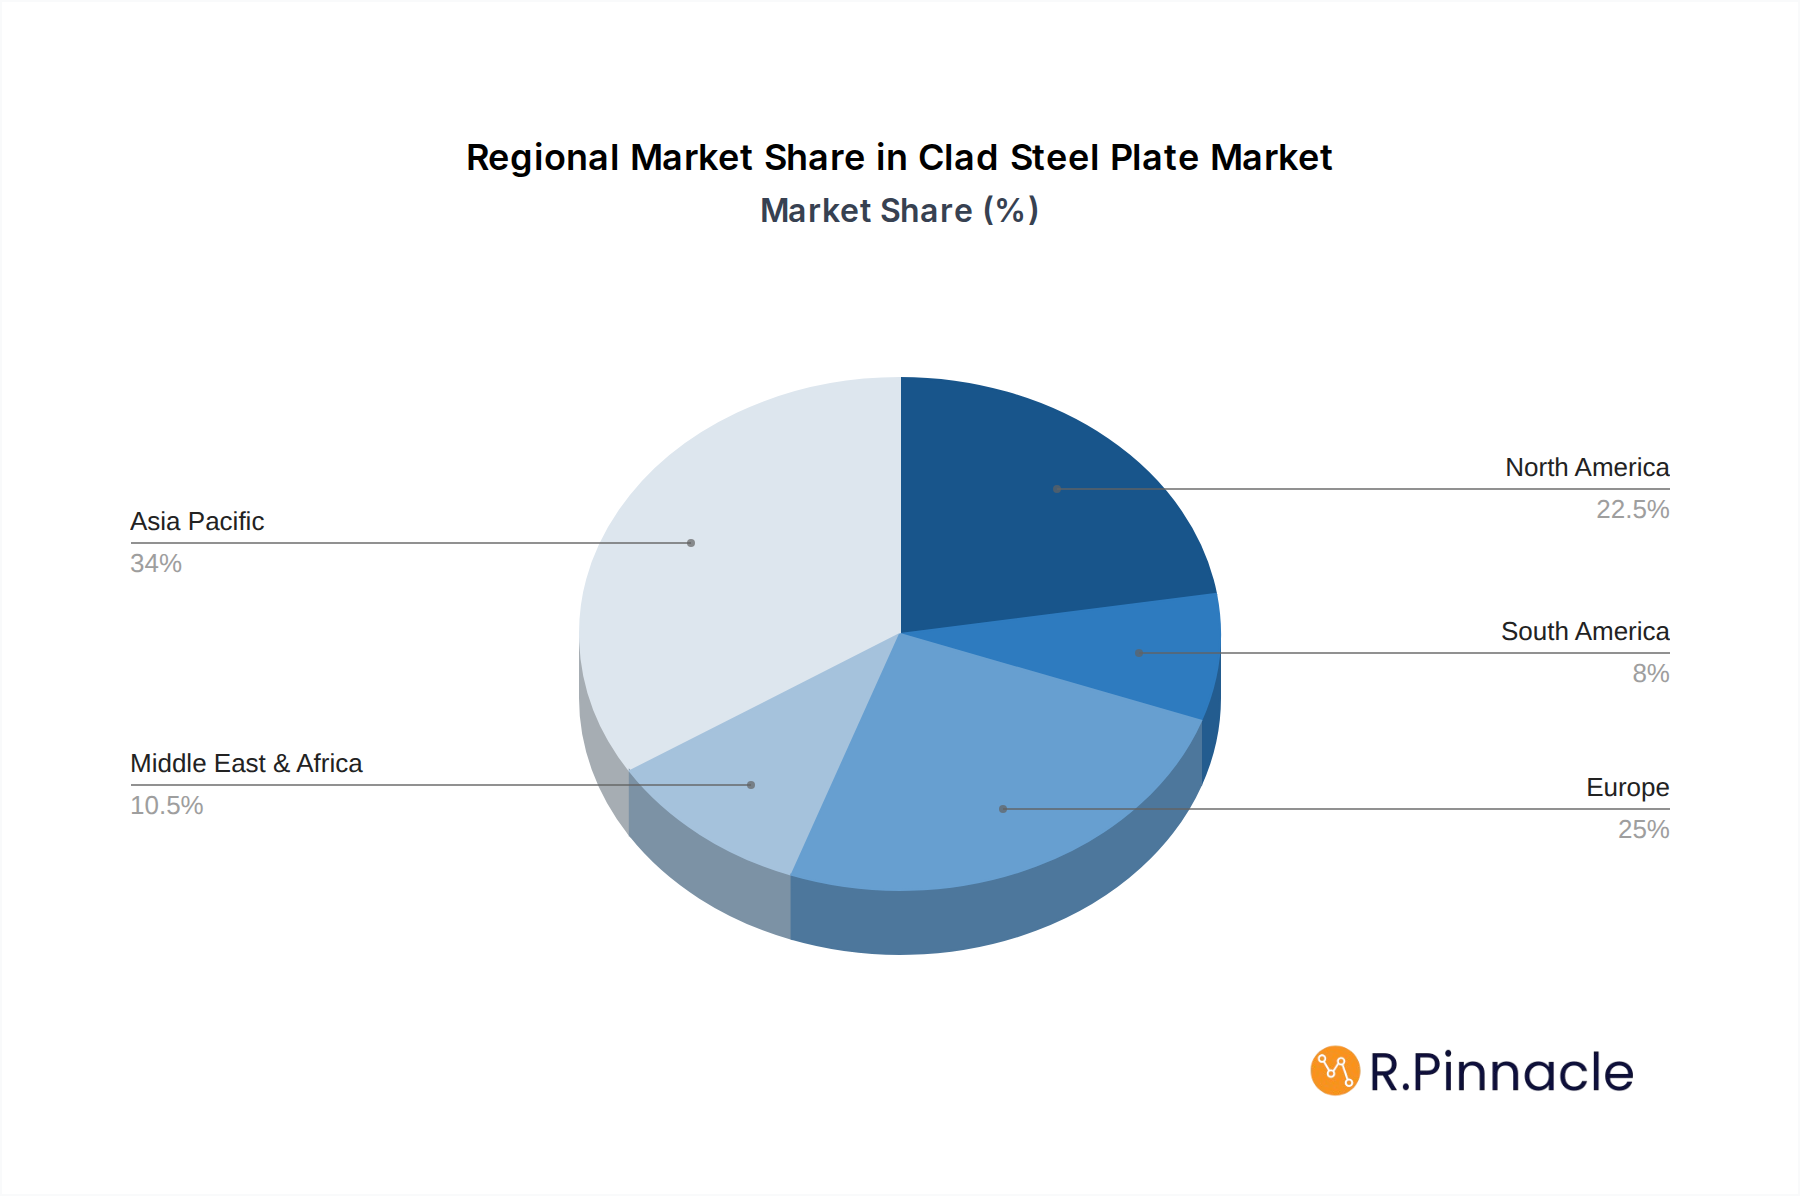
Clad Steel Plate Regional Market Share
Geographic Coverage of Clad Steel Plate
Clad Steel Plate REPORT HIGHLIGHTS
| Aspects | Details |
|---|---|
| Study Period | 2020-2034 |
| Base Year | 2025 |
| Estimated Year | 2026 |
| Forecast Period | 2026-2034 |
| Historical Period | 2020-2025 |
| Growth Rate | CAGR of 4.5% from 2020-2034 |
| Segmentation |
|
Table of Contents
- 1. Introduction
- 1.1. Research Scope
- 1.2. Market Segmentation
- 1.3. Research Methodology
- 1.4. Definitions and Assumptions
- 2. Executive Summary
- 2.1. Introduction
- 3. Market Dynamics
- 3.1. Introduction
- 3.2. Market Drivers
- 3.3. Market Restrains
- 3.4. Market Trends
- 4. Market Factor Analysis
- 4.1. Porters Five Forces
- 4.2. Supply/Value Chain
- 4.3. PESTEL analysis
- 4.4. Market Entropy
- 4.5. Patent/Trademark Analysis
- 5. Global Clad Steel Plate Analysis, Insights and Forecast, 2020-2032
- 5.1. Market Analysis, Insights and Forecast - by Application
- 5.1.1. Oil & Gas
- 5.1.2. Chemical Industry
- 5.1.3. Water Treatment
- 5.1.4. Others
- 5.2. Market Analysis, Insights and Forecast - by Types
- 5.2.1. Explosion Bonded Clad Plate
- 5.2.2. Roll Bonded Clad Plate
- 5.3. Market Analysis, Insights and Forecast - by Region
- 5.3.1. North America
- 5.3.2. South America
- 5.3.3. Europe
- 5.3.4. Middle East & Africa
- 5.3.5. Asia Pacific
- 5.1. Market Analysis, Insights and Forecast - by Application
- 6. North America Clad Steel Plate Analysis, Insights and Forecast, 2020-2032
- 6.1. Market Analysis, Insights and Forecast - by Application
- 6.1.1. Oil & Gas
- 6.1.2. Chemical Industry
- 6.1.3. Water Treatment
- 6.1.4. Others
- 6.2. Market Analysis, Insights and Forecast - by Types
- 6.2.1. Explosion Bonded Clad Plate
- 6.2.2. Roll Bonded Clad Plate
- 6.1. Market Analysis, Insights and Forecast - by Application
- 7. South America Clad Steel Plate Analysis, Insights and Forecast, 2020-2032
- 7.1. Market Analysis, Insights and Forecast - by Application
- 7.1.1. Oil & Gas
- 7.1.2. Chemical Industry
- 7.1.3. Water Treatment
- 7.1.4. Others
- 7.2. Market Analysis, Insights and Forecast - by Types
- 7.2.1. Explosion Bonded Clad Plate
- 7.2.2. Roll Bonded Clad Plate
- 7.1. Market Analysis, Insights and Forecast - by Application
- 8. Europe Clad Steel Plate Analysis, Insights and Forecast, 2020-2032
- 8.1. Market Analysis, Insights and Forecast - by Application
- 8.1.1. Oil & Gas
- 8.1.2. Chemical Industry
- 8.1.3. Water Treatment
- 8.1.4. Others
- 8.2. Market Analysis, Insights and Forecast - by Types
- 8.2.1. Explosion Bonded Clad Plate
- 8.2.2. Roll Bonded Clad Plate
- 8.1. Market Analysis, Insights and Forecast - by Application
- 9. Middle East & Africa Clad Steel Plate Analysis, Insights and Forecast, 2020-2032
- 9.1. Market Analysis, Insights and Forecast - by Application
- 9.1.1. Oil & Gas
- 9.1.2. Chemical Industry
- 9.1.3. Water Treatment
- 9.1.4. Others
- 9.2. Market Analysis, Insights and Forecast - by Types
- 9.2.1. Explosion Bonded Clad Plate
- 9.2.2. Roll Bonded Clad Plate
- 9.1. Market Analysis, Insights and Forecast - by Application
- 10. Asia Pacific Clad Steel Plate Analysis, Insights and Forecast, 2020-2032
- 10.1. Market Analysis, Insights and Forecast - by Application
- 10.1.1. Oil & Gas
- 10.1.2. Chemical Industry
- 10.1.3. Water Treatment
- 10.1.4. Others
- 10.2. Market Analysis, Insights and Forecast - by Types
- 10.2.1. Explosion Bonded Clad Plate
- 10.2.2. Roll Bonded Clad Plate
- 10.1. Market Analysis, Insights and Forecast - by Application
- 11. Competitive Analysis
- 11.1. Global Market Share Analysis 2025
- 11.2. Company Profiles
- 11.2.1 Nobelclad
- 11.2.1.1. Overview
- 11.2.1.2. Products
- 11.2.1.3. SWOT Analysis
- 11.2.1.4. Recent Developments
- 11.2.1.5. Financials (Based on Availability)
- 11.2.2 TISCO
- 11.2.2.1. Overview
- 11.2.2.2. Products
- 11.2.2.3. SWOT Analysis
- 11.2.2.4. Recent Developments
- 11.2.2.5. Financials (Based on Availability)
- 11.2.3 Energometall
- 11.2.3.1. Overview
- 11.2.3.2. Products
- 11.2.3.3. SWOT Analysis
- 11.2.3.4. Recent Developments
- 11.2.3.5. Financials (Based on Availability)
- 11.2.4 Shanxi Baotai
- 11.2.4.1. Overview
- 11.2.4.2. Products
- 11.2.4.3. SWOT Analysis
- 11.2.4.4. Recent Developments
- 11.2.4.5. Financials (Based on Availability)
- 11.2.5 Dalian Shipbuilding
- 11.2.5.1. Overview
- 11.2.5.2. Products
- 11.2.5.3. SWOT Analysis
- 11.2.5.4. Recent Developments
- 11.2.5.5. Financials (Based on Availability)
- 11.2.6 Voestalpine
- 11.2.6.1. Overview
- 11.2.6.2. Products
- 11.2.6.3. SWOT Analysis
- 11.2.6.4. Recent Developments
- 11.2.6.5. Financials (Based on Availability)
- 11.2.7 JSW
- 11.2.7.1. Overview
- 11.2.7.2. Products
- 11.2.7.3. SWOT Analysis
- 11.2.7.4. Recent Developments
- 11.2.7.5. Financials (Based on Availability)
- 11.2.8 JFE
- 11.2.8.1. Overview
- 11.2.8.2. Products
- 11.2.8.3. SWOT Analysis
- 11.2.8.4. Recent Developments
- 11.2.8.5. Financials (Based on Availability)
- 11.2.9 Nippon Steel
- 11.2.9.1. Overview
- 11.2.9.2. Products
- 11.2.9.3. SWOT Analysis
- 11.2.9.4. Recent Developments
- 11.2.9.5. Financials (Based on Availability)
- 11.2.10 Shandong Baode Metal
- 11.2.10.1. Overview
- 11.2.10.2. Products
- 11.2.10.3. SWOT Analysis
- 11.2.10.4. Recent Developments
- 11.2.10.5. Financials (Based on Availability)
- 11.2.11 Jiangsu Huahong
- 11.2.11.1. Overview
- 11.2.11.2. Products
- 11.2.11.3. SWOT Analysis
- 11.2.11.4. Recent Developments
- 11.2.11.5. Financials (Based on Availability)
- 11.2.12 Sichuan Jinglei
- 11.2.12.1. Overview
- 11.2.12.2. Products
- 11.2.12.3. SWOT Analysis
- 11.2.12.4. Recent Developments
- 11.2.12.5. Financials (Based on Availability)
- 11.2.13 Xian Tianli
- 11.2.13.1. Overview
- 11.2.13.2. Products
- 11.2.13.3. SWOT Analysis
- 11.2.13.4. Recent Developments
- 11.2.13.5. Financials (Based on Availability)
- 11.2.1 Nobelclad
List of Figures
- Figure 1: Global Clad Steel Plate Revenue Breakdown (million, %) by Region 2025 & 2033
- Figure 2: Global Clad Steel Plate Volume Breakdown (K, %) by Region 2025 & 2033
- Figure 3: North America Clad Steel Plate Revenue (million), by Application 2025 & 2033
- Figure 4: North America Clad Steel Plate Volume (K), by Application 2025 & 2033
- Figure 5: North America Clad Steel Plate Revenue Share (%), by Application 2025 & 2033
- Figure 6: North America Clad Steel Plate Volume Share (%), by Application 2025 & 2033
- Figure 7: North America Clad Steel Plate Revenue (million), by Types 2025 & 2033
- Figure 8: North America Clad Steel Plate Volume (K), by Types 2025 & 2033
- Figure 9: North America Clad Steel Plate Revenue Share (%), by Types 2025 & 2033
- Figure 10: North America Clad Steel Plate Volume Share (%), by Types 2025 & 2033
- Figure 11: North America Clad Steel Plate Revenue (million), by Country 2025 & 2033
- Figure 12: North America Clad Steel Plate Volume (K), by Country 2025 & 2033
- Figure 13: North America Clad Steel Plate Revenue Share (%), by Country 2025 & 2033
- Figure 14: North America Clad Steel Plate Volume Share (%), by Country 2025 & 2033
- Figure 15: South America Clad Steel Plate Revenue (million), by Application 2025 & 2033
- Figure 16: South America Clad Steel Plate Volume (K), by Application 2025 & 2033
- Figure 17: South America Clad Steel Plate Revenue Share (%), by Application 2025 & 2033
- Figure 18: South America Clad Steel Plate Volume Share (%), by Application 2025 & 2033
- Figure 19: South America Clad Steel Plate Revenue (million), by Types 2025 & 2033
- Figure 20: South America Clad Steel Plate Volume (K), by Types 2025 & 2033
- Figure 21: South America Clad Steel Plate Revenue Share (%), by Types 2025 & 2033
- Figure 22: South America Clad Steel Plate Volume Share (%), by Types 2025 & 2033
- Figure 23: South America Clad Steel Plate Revenue (million), by Country 2025 & 2033
- Figure 24: South America Clad Steel Plate Volume (K), by Country 2025 & 2033
- Figure 25: South America Clad Steel Plate Revenue Share (%), by Country 2025 & 2033
- Figure 26: South America Clad Steel Plate Volume Share (%), by Country 2025 & 2033
- Figure 27: Europe Clad Steel Plate Revenue (million), by Application 2025 & 2033
- Figure 28: Europe Clad Steel Plate Volume (K), by Application 2025 & 2033
- Figure 29: Europe Clad Steel Plate Revenue Share (%), by Application 2025 & 2033
- Figure 30: Europe Clad Steel Plate Volume Share (%), by Application 2025 & 2033
- Figure 31: Europe Clad Steel Plate Revenue (million), by Types 2025 & 2033
- Figure 32: Europe Clad Steel Plate Volume (K), by Types 2025 & 2033
- Figure 33: Europe Clad Steel Plate Revenue Share (%), by Types 2025 & 2033
- Figure 34: Europe Clad Steel Plate Volume Share (%), by Types 2025 & 2033
- Figure 35: Europe Clad Steel Plate Revenue (million), by Country 2025 & 2033
- Figure 36: Europe Clad Steel Plate Volume (K), by Country 2025 & 2033
- Figure 37: Europe Clad Steel Plate Revenue Share (%), by Country 2025 & 2033
- Figure 38: Europe Clad Steel Plate Volume Share (%), by Country 2025 & 2033
- Figure 39: Middle East & Africa Clad Steel Plate Revenue (million), by Application 2025 & 2033
- Figure 40: Middle East & Africa Clad Steel Plate Volume (K), by Application 2025 & 2033
- Figure 41: Middle East & Africa Clad Steel Plate Revenue Share (%), by Application 2025 & 2033
- Figure 42: Middle East & Africa Clad Steel Plate Volume Share (%), by Application 2025 & 2033
- Figure 43: Middle East & Africa Clad Steel Plate Revenue (million), by Types 2025 & 2033
- Figure 44: Middle East & Africa Clad Steel Plate Volume (K), by Types 2025 & 2033
- Figure 45: Middle East & Africa Clad Steel Plate Revenue Share (%), by Types 2025 & 2033
- Figure 46: Middle East & Africa Clad Steel Plate Volume Share (%), by Types 2025 & 2033
- Figure 47: Middle East & Africa Clad Steel Plate Revenue (million), by Country 2025 & 2033
- Figure 48: Middle East & Africa Clad Steel Plate Volume (K), by Country 2025 & 2033
- Figure 49: Middle East & Africa Clad Steel Plate Revenue Share (%), by Country 2025 & 2033
- Figure 50: Middle East & Africa Clad Steel Plate Volume Share (%), by Country 2025 & 2033
- Figure 51: Asia Pacific Clad Steel Plate Revenue (million), by Application 2025 & 2033
- Figure 52: Asia Pacific Clad Steel Plate Volume (K), by Application 2025 & 2033
- Figure 53: Asia Pacific Clad Steel Plate Revenue Share (%), by Application 2025 & 2033
- Figure 54: Asia Pacific Clad Steel Plate Volume Share (%), by Application 2025 & 2033
- Figure 55: Asia Pacific Clad Steel Plate Revenue (million), by Types 2025 & 2033
- Figure 56: Asia Pacific Clad Steel Plate Volume (K), by Types 2025 & 2033
- Figure 57: Asia Pacific Clad Steel Plate Revenue Share (%), by Types 2025 & 2033
- Figure 58: Asia Pacific Clad Steel Plate Volume Share (%), by Types 2025 & 2033
- Figure 59: Asia Pacific Clad Steel Plate Revenue (million), by Country 2025 & 2033
- Figure 60: Asia Pacific Clad Steel Plate Volume (K), by Country 2025 & 2033
- Figure 61: Asia Pacific Clad Steel Plate Revenue Share (%), by Country 2025 & 2033
- Figure 62: Asia Pacific Clad Steel Plate Volume Share (%), by Country 2025 & 2033
List of Tables
- Table 1: Global Clad Steel Plate Revenue million Forecast, by Application 2020 & 2033
- Table 2: Global Clad Steel Plate Volume K Forecast, by Application 2020 & 2033
- Table 3: Global Clad Steel Plate Revenue million Forecast, by Types 2020 & 2033
- Table 4: Global Clad Steel Plate Volume K Forecast, by Types 2020 & 2033
- Table 5: Global Clad Steel Plate Revenue million Forecast, by Region 2020 & 2033
- Table 6: Global Clad Steel Plate Volume K Forecast, by Region 2020 & 2033
- Table 7: Global Clad Steel Plate Revenue million Forecast, by Application 2020 & 2033
- Table 8: Global Clad Steel Plate Volume K Forecast, by Application 2020 & 2033
- Table 9: Global Clad Steel Plate Revenue million Forecast, by Types 2020 & 2033
- Table 10: Global Clad Steel Plate Volume K Forecast, by Types 2020 & 2033
- Table 11: Global Clad Steel Plate Revenue million Forecast, by Country 2020 & 2033
- Table 12: Global Clad Steel Plate Volume K Forecast, by Country 2020 & 2033
- Table 13: United States Clad Steel Plate Revenue (million) Forecast, by Application 2020 & 2033
- Table 14: United States Clad Steel Plate Volume (K) Forecast, by Application 2020 & 2033
- Table 15: Canada Clad Steel Plate Revenue (million) Forecast, by Application 2020 & 2033
- Table 16: Canada Clad Steel Plate Volume (K) Forecast, by Application 2020 & 2033
- Table 17: Mexico Clad Steel Plate Revenue (million) Forecast, by Application 2020 & 2033
- Table 18: Mexico Clad Steel Plate Volume (K) Forecast, by Application 2020 & 2033
- Table 19: Global Clad Steel Plate Revenue million Forecast, by Application 2020 & 2033
- Table 20: Global Clad Steel Plate Volume K Forecast, by Application 2020 & 2033
- Table 21: Global Clad Steel Plate Revenue million Forecast, by Types 2020 & 2033
- Table 22: Global Clad Steel Plate Volume K Forecast, by Types 2020 & 2033
- Table 23: Global Clad Steel Plate Revenue million Forecast, by Country 2020 & 2033
- Table 24: Global Clad Steel Plate Volume K Forecast, by Country 2020 & 2033
- Table 25: Brazil Clad Steel Plate Revenue (million) Forecast, by Application 2020 & 2033
- Table 26: Brazil Clad Steel Plate Volume (K) Forecast, by Application 2020 & 2033
- Table 27: Argentina Clad Steel Plate Revenue (million) Forecast, by Application 2020 & 2033
- Table 28: Argentina Clad Steel Plate Volume (K) Forecast, by Application 2020 & 2033
- Table 29: Rest of South America Clad Steel Plate Revenue (million) Forecast, by Application 2020 & 2033
- Table 30: Rest of South America Clad Steel Plate Volume (K) Forecast, by Application 2020 & 2033
- Table 31: Global Clad Steel Plate Revenue million Forecast, by Application 2020 & 2033
- Table 32: Global Clad Steel Plate Volume K Forecast, by Application 2020 & 2033
- Table 33: Global Clad Steel Plate Revenue million Forecast, by Types 2020 & 2033
- Table 34: Global Clad Steel Plate Volume K Forecast, by Types 2020 & 2033
- Table 35: Global Clad Steel Plate Revenue million Forecast, by Country 2020 & 2033
- Table 36: Global Clad Steel Plate Volume K Forecast, by Country 2020 & 2033
- Table 37: United Kingdom Clad Steel Plate Revenue (million) Forecast, by Application 2020 & 2033
- Table 38: United Kingdom Clad Steel Plate Volume (K) Forecast, by Application 2020 & 2033
- Table 39: Germany Clad Steel Plate Revenue (million) Forecast, by Application 2020 & 2033
- Table 40: Germany Clad Steel Plate Volume (K) Forecast, by Application 2020 & 2033
- Table 41: France Clad Steel Plate Revenue (million) Forecast, by Application 2020 & 2033
- Table 42: France Clad Steel Plate Volume (K) Forecast, by Application 2020 & 2033
- Table 43: Italy Clad Steel Plate Revenue (million) Forecast, by Application 2020 & 2033
- Table 44: Italy Clad Steel Plate Volume (K) Forecast, by Application 2020 & 2033
- Table 45: Spain Clad Steel Plate Revenue (million) Forecast, by Application 2020 & 2033
- Table 46: Spain Clad Steel Plate Volume (K) Forecast, by Application 2020 & 2033
- Table 47: Russia Clad Steel Plate Revenue (million) Forecast, by Application 2020 & 2033
- Table 48: Russia Clad Steel Plate Volume (K) Forecast, by Application 2020 & 2033
- Table 49: Benelux Clad Steel Plate Revenue (million) Forecast, by Application 2020 & 2033
- Table 50: Benelux Clad Steel Plate Volume (K) Forecast, by Application 2020 & 2033
- Table 51: Nordics Clad Steel Plate Revenue (million) Forecast, by Application 2020 & 2033
- Table 52: Nordics Clad Steel Plate Volume (K) Forecast, by Application 2020 & 2033
- Table 53: Rest of Europe Clad Steel Plate Revenue (million) Forecast, by Application 2020 & 2033
- Table 54: Rest of Europe Clad Steel Plate Volume (K) Forecast, by Application 2020 & 2033
- Table 55: Global Clad Steel Plate Revenue million Forecast, by Application 2020 & 2033
- Table 56: Global Clad Steel Plate Volume K Forecast, by Application 2020 & 2033
- Table 57: Global Clad Steel Plate Revenue million Forecast, by Types 2020 & 2033
- Table 58: Global Clad Steel Plate Volume K Forecast, by Types 2020 & 2033
- Table 59: Global Clad Steel Plate Revenue million Forecast, by Country 2020 & 2033
- Table 60: Global Clad Steel Plate Volume K Forecast, by Country 2020 & 2033
- Table 61: Turkey Clad Steel Plate Revenue (million) Forecast, by Application 2020 & 2033
- Table 62: Turkey Clad Steel Plate Volume (K) Forecast, by Application 2020 & 2033
- Table 63: Israel Clad Steel Plate Revenue (million) Forecast, by Application 2020 & 2033
- Table 64: Israel Clad Steel Plate Volume (K) Forecast, by Application 2020 & 2033
- Table 65: GCC Clad Steel Plate Revenue (million) Forecast, by Application 2020 & 2033
- Table 66: GCC Clad Steel Plate Volume (K) Forecast, by Application 2020 & 2033
- Table 67: North Africa Clad Steel Plate Revenue (million) Forecast, by Application 2020 & 2033
- Table 68: North Africa Clad Steel Plate Volume (K) Forecast, by Application 2020 & 2033
- Table 69: South Africa Clad Steel Plate Revenue (million) Forecast, by Application 2020 & 2033
- Table 70: South Africa Clad Steel Plate Volume (K) Forecast, by Application 2020 & 2033
- Table 71: Rest of Middle East & Africa Clad Steel Plate Revenue (million) Forecast, by Application 2020 & 2033
- Table 72: Rest of Middle East & Africa Clad Steel Plate Volume (K) Forecast, by Application 2020 & 2033
- Table 73: Global Clad Steel Plate Revenue million Forecast, by Application 2020 & 2033
- Table 74: Global Clad Steel Plate Volume K Forecast, by Application 2020 & 2033
- Table 75: Global Clad Steel Plate Revenue million Forecast, by Types 2020 & 2033
- Table 76: Global Clad Steel Plate Volume K Forecast, by Types 2020 & 2033
- Table 77: Global Clad Steel Plate Revenue million Forecast, by Country 2020 & 2033
- Table 78: Global Clad Steel Plate Volume K Forecast, by Country 2020 & 2033
- Table 79: China Clad Steel Plate Revenue (million) Forecast, by Application 2020 & 2033
- Table 80: China Clad Steel Plate Volume (K) Forecast, by Application 2020 & 2033
- Table 81: India Clad Steel Plate Revenue (million) Forecast, by Application 2020 & 2033
- Table 82: India Clad Steel Plate Volume (K) Forecast, by Application 2020 & 2033
- Table 83: Japan Clad Steel Plate Revenue (million) Forecast, by Application 2020 & 2033
- Table 84: Japan Clad Steel Plate Volume (K) Forecast, by Application 2020 & 2033
- Table 85: South Korea Clad Steel Plate Revenue (million) Forecast, by Application 2020 & 2033
- Table 86: South Korea Clad Steel Plate Volume (K) Forecast, by Application 2020 & 2033
- Table 87: ASEAN Clad Steel Plate Revenue (million) Forecast, by Application 2020 & 2033
- Table 88: ASEAN Clad Steel Plate Volume (K) Forecast, by Application 2020 & 2033
- Table 89: Oceania Clad Steel Plate Revenue (million) Forecast, by Application 2020 & 2033
- Table 90: Oceania Clad Steel Plate Volume (K) Forecast, by Application 2020 & 2033
- Table 91: Rest of Asia Pacific Clad Steel Plate Revenue (million) Forecast, by Application 2020 & 2033
- Table 92: Rest of Asia Pacific Clad Steel Plate Volume (K) Forecast, by Application 2020 & 2033
Frequently Asked Questions
1. What is the projected Compound Annual Growth Rate (CAGR) of the Clad Steel Plate?
The projected CAGR is approximately 4.5%.
2. Which companies are prominent players in the Clad Steel Plate?
Key companies in the market include Nobelclad, TISCO, Energometall, Shanxi Baotai, Dalian Shipbuilding, Voestalpine, JSW, JFE, Nippon Steel, Shandong Baode Metal, Jiangsu Huahong, Sichuan Jinglei, Xian Tianli.
3. What are the main segments of the Clad Steel Plate?
The market segments include Application, Types.
4. Can you provide details about the market size?
The market size is estimated to be USD 1923 million as of 2022.
5. What are some drivers contributing to market growth?
N/A
6. What are the notable trends driving market growth?
N/A
7. Are there any restraints impacting market growth?
N/A
8. Can you provide examples of recent developments in the market?
N/A
9. What pricing options are available for accessing the report?
Pricing options include single-user, multi-user, and enterprise licenses priced at USD 3950.00, USD 5925.00, and USD 7900.00 respectively.
10. Is the market size provided in terms of value or volume?
The market size is provided in terms of value, measured in million and volume, measured in K.
11. Are there any specific market keywords associated with the report?
Yes, the market keyword associated with the report is "Clad Steel Plate," which aids in identifying and referencing the specific market segment covered.
12. How do I determine which pricing option suits my needs best?
The pricing options vary based on user requirements and access needs. Individual users may opt for single-user licenses, while businesses requiring broader access may choose multi-user or enterprise licenses for cost-effective access to the report.
13. Are there any additional resources or data provided in the Clad Steel Plate report?
While the report offers comprehensive insights, it's advisable to review the specific contents or supplementary materials provided to ascertain if additional resources or data are available.
14. How can I stay updated on further developments or reports in the Clad Steel Plate?
To stay informed about further developments, trends, and reports in the Clad Steel Plate, consider subscribing to industry newsletters, following relevant companies and organizations, or regularly checking reputable industry news sources and publications.
Methodology
Step 1 - Identification of Relevant Samples Size from Population Database


Step 2 - Approaches for Defining Global Market Size (Value, Volume* & Price*)

Note*: In applicable scenarios
Step 3 - Data Sources
Primary Research
- Web Analytics
- Survey Reports
- Research Institute
- Latest Research Reports
- Opinion Leaders
Secondary Research
- Annual Reports
- White Paper
- Latest Press Release
- Industry Association
- Paid Database
- Investor Presentations

Step 4 - Data Triangulation
Involves using different sources of information in order to increase the validity of a study
These sources are likely to be stakeholders in a program - participants, other researchers, program staff, other community members, and so on.
Then we put all data in single framework & apply various statistical tools to find out the dynamic on the market.
During the analysis stage, feedback from the stakeholder groups would be compared to determine areas of agreement as well as areas of divergence