

Key Insights
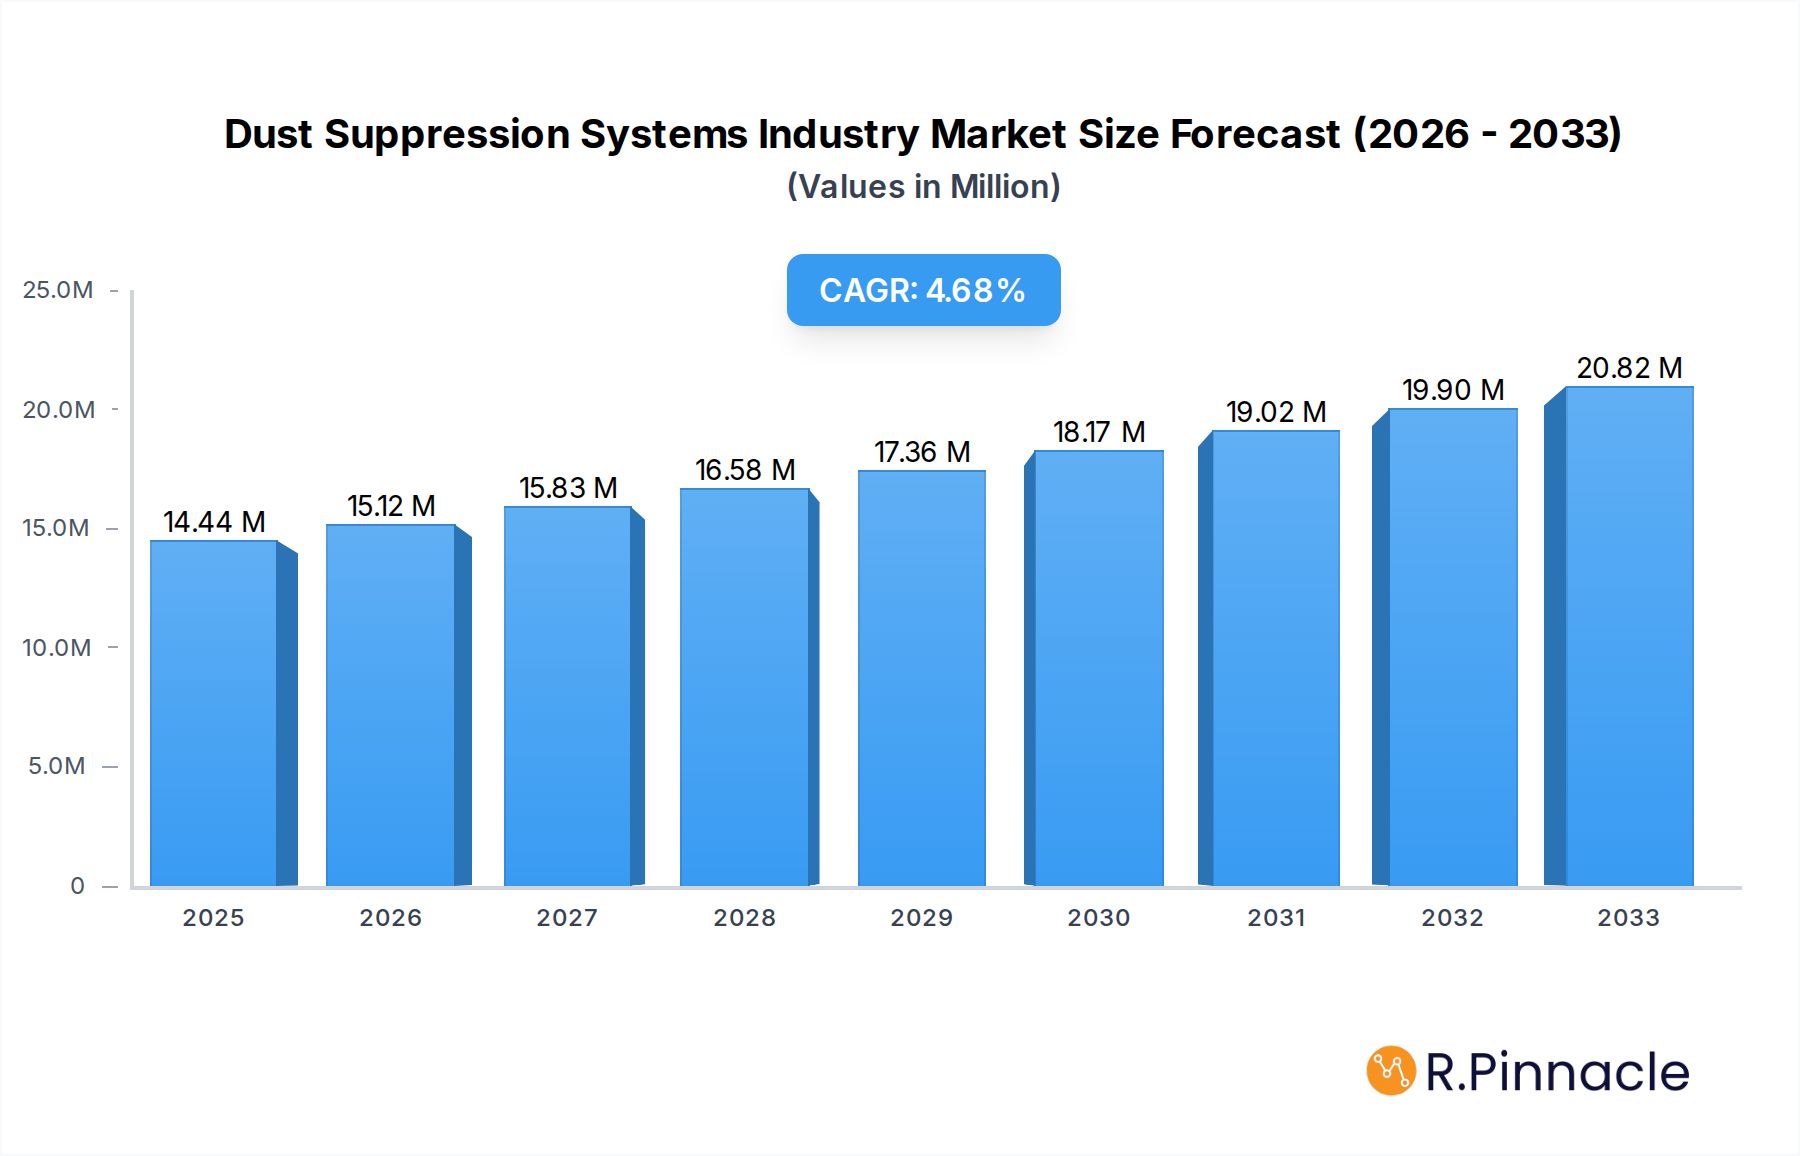
The global Dust Suppression Systems market is poised for significant growth, projected to reach $14.44 million by 2025. This expansion is fueled by a Compound Annual Growth Rate (CAGR) of 4.73% from 2019 to 2033. A primary driver for this upward trajectory is the increasing global focus on environmental regulations and worker safety, particularly in heavy industries. As governments worldwide implement stricter emission controls and workplace health standards, the demand for effective dust mitigation solutions is escalating. The mining and construction sectors are leading this charge, driven by ongoing infrastructure development and resource extraction activities that inherently generate substantial dust. Furthermore, the oil and gas industry's need for dust control in exploration and refining operations contributes significantly to market demand.

Dust Suppression Systems Industry Market Size (In Million)
The market's dynamism is further shaped by emerging trends such as the adoption of advanced technologies like IoT-enabled monitoring and automated suppression systems, enhancing efficiency and precision. Polymeric emulsions and advanced chemical treatments are gaining traction due to their superior long-term dust binding capabilities. However, the market also faces certain restraints. The initial high cost of sophisticated dust suppression systems and the operational expenses associated with certain chemical agents can pose a barrier to widespread adoption, especially for smaller enterprises. Nevertheless, the long-term benefits in terms of regulatory compliance, improved air quality, and enhanced worker health are expected to outweigh these initial investments, propelling sustained market growth across diverse end-user industries and geographical regions.
Dust Suppression Systems Industry Company Market Share
Dust Suppression Systems Industry: Comprehensive Market Analysis and Future Outlook (2019-2033)
Unlock critical insights into the global dust suppression systems market, a vital sector for environmental compliance and operational efficiency. This in-depth report provides a comprehensive analysis of market structure, dynamics, segmentation, and future trajectories. With a study period spanning from 2019 to 2033, anchored by a 2025 base year and a robust 2025-2033 forecast, this report is an indispensable resource for chemical providers, system manufacturers, end-users, and investors seeking to navigate this rapidly evolving landscape.
The report leverages high-ranking keywords such as "dust control solutions," "industrial dust suppression," "mining dust mitigation," "construction dust management," "air pollution control," and "environmental compliance systems" to ensure maximum visibility and reach within the industry.
Dust Suppression Systems Industry Market Structure & Innovation Trends
The dust suppression systems industry is characterized by a moderate market concentration, with a blend of large multinational corporations and specialized regional players. Innovation is a key differentiator, driven by the increasing stringency of environmental regulations and the persistent demand for more efficient and cost-effective dust mitigation solutions across diverse end-user industries. Regulatory frameworks, particularly those pertaining to air quality and occupational health and safety, play a pivotal role in shaping market demand and product development. For instance, the increasing global focus on reducing particulate matter emissions from industrial activities is a significant innovation driver. Product substitutes, such as advanced ventilation systems and alternative dust capture technologies, present ongoing competitive pressures, necessitating continuous technological advancements in traditional dust suppression methods. End-user demographics are increasingly sophisticated, demanding customized solutions tailored to specific operational needs and environmental conditions. Mergers and acquisition (M&A) activities, while not as prevalent as in some other industrial sectors, are strategic moves aimed at consolidating market share, acquiring new technologies, and expanding geographical reach. Notable M&A deals within the broader environmental technology space have seen valuations in the hundreds of millions of dollars, indicating potential for significant consolidation as the market matures. Market share shifts are often influenced by a company's ability to offer integrated solutions encompassing both chemical treatments and sophisticated application systems, alongside strong technical support and a commitment to sustainability.
Dust Suppression Systems Industry Market Dynamics & Trends
The global dust suppression systems market is experiencing robust growth, driven by a confluence of powerful factors. A primary growth driver is the escalating global awareness and stringent enforcement of environmental regulations concerning air quality and particulate matter emissions. Governments worldwide are imposing stricter limits on dust generated from industrial activities, compelling industries such as mining, construction, and quarrying to invest heavily in effective dust suppression technologies. The market is further propelled by technological disruptions, with continuous innovation leading to more efficient, cost-effective, and environmentally friendly dust suppression solutions. The development of advanced chemical formulations, such as sophisticated polymeric emulsions and bio-based binders, alongside smarter application systems like advanced mist cannons and automated sprayers, are transforming the market landscape. Consumer preferences are shifting towards sustainable and eco-friendly solutions. End-users are increasingly seeking dust suppressants that minimize water usage, reduce chemical runoff, and are derived from renewable resources. This trend is fostering innovation in areas like biodegradable dust control agents and waterless suppression technologies. Competitive dynamics are intensifying as established players and new entrants vie for market share. Companies are differentiating themselves through product performance, cost-competitiveness, technological innovation, and the ability to provide comprehensive, integrated solutions. The market penetration of advanced dust suppression systems is steadily increasing across various industrial sectors, with industries actively seeking to improve worker safety, reduce environmental impact, and enhance operational efficiency. The projected Compound Annual Growth Rate (CAGR) for the dust suppression systems market is expected to be in the range of 5-7% over the forecast period, reflecting sustained demand and ongoing technological advancements.
Dominant Regions & Segments in Dust Suppression Systems Industry
The Mining industry stands as a dominant end-user sector in the dust suppression systems market, driven by the inherent dust-generating nature of extraction activities and the stringent safety and environmental regulations governing this sector. Within the chemical types, Magnesium Chloride and Calcium Chloride are historically significant due to their hygroscopic properties and cost-effectiveness in stabilizing unpaved roads and exposed surfaces in mining operations. However, Polymeric Emulsions are gaining substantial traction due to their superior dust binding capabilities, reduced environmental impact, and longer-lasting effectiveness, especially in arid and high-traffic environments. For system types, Wet Suppression systems, including mist cannons and sprinklers, are prevalent in mining due to their ability to encapsulate airborne dust particles effectively. However, the increasing focus on water conservation is spurring interest in Dry Collection systems, particularly in regions facing water scarcity.
North America, particularly the United States and Canada, is a dominant region, fueled by significant mining and construction activities, coupled with strong regulatory frameworks and a high adoption rate of advanced technologies. Economic policies supporting infrastructure development and environmental protection initiatives are key drivers in this region. Countries like Australia, with its extensive mining operations, also represent a substantial market share.
In the Construction industry, Asphalt Emulsions and Polymeric Emulsions are crucial for dust control on temporary roads, worksites, and unpaved areas, enhancing site safety and air quality. Wet Suppression systems are widely deployed for dust control at construction sites, particularly during demolition, excavation, and material handling.
The Oil and Gas and Petrochemical sector also presents significant demand, particularly for dust control in well sites, refineries, and transportation routes. Here, Oil Emulsions and specialized Polymeric Emulsions are employed, alongside robust Wet Suppression systems designed to handle harsh operational environments.
Key drivers in these dominant segments include:
- Stringent Environmental Regulations: Mandating reductions in airborne particulate matter.
- Worker Health and Safety: Protecting workers from respiratory hazards.
- Operational Efficiency: Minimizing dust-related equipment wear and tear and production interruptions.
- Infrastructure Development: Driving demand in construction and mining for site stabilization and dust control.
- Technological Advancements: Leading to more effective and sustainable dust suppression solutions.
Dust Suppression Systems Industry Product Innovations
Product innovations in the dust suppression systems industry are primarily focused on enhancing efficacy, sustainability, and ease of use. Chemical providers are developing advanced formulations, such as environmentally benign polymeric binders and bio-based dust suppressants, offering superior dust binding and reduced water consumption. System providers are introducing intelligent application technologies, including automated misting systems with real-time environmental monitoring and AI-powered control units, optimizing spray patterns and minimizing chemical waste. These innovations address critical market needs for cost-effectiveness, environmental compliance, and improved worker safety, providing competitive advantages through reduced operational costs and enhanced performance in diverse industrial settings.
Report Scope & Segmentation Analysis
This report provides a comprehensive analysis of the dust suppression systems market across key segments. The Chemical Type segmentation includes Lignin Sulfonate, Calcium Chloride, Magnesium Chloride, Asphalt Emulsions, Oil Emulsions, Polymeric Emulsions, and Other Chemical Types, each catering to specific dust control needs and environmental conditions. The System Type segmentation covers Dry Collection and Wet Suppression systems, reflecting different approaches to dust mitigation. The End-user Industry segmentation analyzes demand from Mining, Construction, Food and Beverage, Oil and Gas and Petrochemical, Pharmaceutical, and Other End-user Industries, highlighting the diverse applications and market potential across these sectors. Growth projections and market sizes are detailed for each segment, with an emphasis on their unique competitive dynamics and adoption trends.
Key Drivers of Dust Suppression Systems Industry Growth
The growth of the dust suppression systems industry is propelled by several key drivers. Foremost is the increasingly stringent global environmental regulations aimed at curbing air pollution and protecting public health, compelling industries to adopt effective dust control measures. Technological advancements in chemical formulations and application systems are offering more efficient, cost-effective, and sustainable solutions, driving adoption. The growing awareness of occupational health and safety hazards associated with dust exposure in industrial environments incentivizes investment in robust suppression technologies. Furthermore, infrastructure development and industrial expansion, particularly in emerging economies, create a consistent demand for dust management solutions in sectors like mining and construction.
Challenges in the Dust Suppression Systems Industry Sector
Despite significant growth, the dust suppression systems industry faces several challenges. High initial investment costs for advanced systems can be a barrier for some smaller enterprises. Variability in raw material prices can impact the profitability of chemical providers, affecting pricing strategies. Water scarcity in certain regions poses a constraint for water-based suppression systems, driving the need for innovative dry solutions. Enforcement inconsistencies of environmental regulations across different geographies can create an uneven playing field. Finally, competition from alternative dust control methods and the need for continuous innovation to stay ahead of evolving environmental standards present ongoing challenges.
Emerging Opportunities in Dust Suppression Systems Industry
Emerging opportunities in the dust suppression systems industry lie in the development and deployment of sustainable and bio-based dust suppressants, catering to the growing demand for eco-friendly solutions. The integration of IoT and AI into dust suppression systems offers potential for smart, automated, and highly efficient dust management. Expansion into developing economies with rapidly industrializing sectors presents significant untapped market potential. Furthermore, the increasing focus on remediation of legacy industrial sites and dust control in urban environments opens new application avenues. The development of waterless dust suppression technologies is also a key area for future growth.
Leading Players in the Dust Suppression Systems Industry Market
- ADM
- Benetech Inc
- Borregaard
- Cargill Incorporated
- Chemtex Speciality Limited
- Evonik Industries AG
- GelTech Solutions
- Hexion
- Quaker Houghton (Quaker Chemical Corporation)
- Shaw Almex Industries Ltd
- SUEZ
- Ecolab
- BossTek
- Camfil
- CW Machine Worx
- Donaldson Company Inc
- DSH Systems Ltd
- Duztech AB
- Nederman Holding AB
- SLY Inc
- The ACT Group
Key Developments in Dust Suppression Systems Industry Industry
- March 2024: Camfil Air Pollution Control (APC) has unveiled its newest offering, the Gold Series Timer (GST), an innovative-edge dust collection controller. The GST serves as a straightforward yet powerful tool for managing pulse-jet cleaning in various industrial dust collection systems, such as baghouses. With its state-of-the-art design, the GST provides an intuitive and easily implementable solution for pulse-jet cleaning in industrial dust collection systems.
- February 2023: BOSSTEK, renowned for its portable dust-suppression equipment, has unveiled the DustBoss DB-45 Surge, the newest addition to its acclaimed Surge line. This innovative-edge technology features an innovative pressurized center nozzle, complemented by the OEM's trusted fan and misting ring system, empowering users to effectively manage dust, regardless of weather conditions.
Future Outlook for Dust Suppression Systems Industry Market
The future outlook for the dust suppression systems market is exceptionally positive, driven by sustained regulatory pressure and an increasing emphasis on sustainable industrial practices. The market will witness a greater adoption of smart technologies, including IoT-enabled sensors and AI-powered control systems, to optimize dust suppression efficiency and minimize resource consumption. Innovations in eco-friendly chemical formulations, such as biodegradable and low-water consumption agents, will gain prominence. Emerging economies are poised to become significant growth engines as they invest in industrialization and environmental compliance. Strategic collaborations and M&A activities are likely to increase as companies seek to expand their product portfolios and geographical reach, consolidating their market positions and driving overall industry advancement.
Dust Suppression Systems Industry Segmentation
-
1. Chemical Type
- 1.1. Lignin Sulfonate
- 1.2. Calcium Chloride
- 1.3. Magnesium Chloride
- 1.4. Asphalt Emulsions
- 1.5. Oil Emulsions
- 1.6. Polymeric Emulsions
- 1.7. Other Chemical Types
-
2. System Type
- 2.1. Dry Collection
- 2.2. Wet Suppression
-
3. End-user Industry
- 3.1. Mining
- 3.2. Construction
- 3.3. Food and Beverage
- 3.4. Oil and Gas and Petrochemical
- 3.5. Pharmaceutical
- 3.6. Other End-user Industries
Dust Suppression Systems Industry Segmentation By Geography
-
1. Asia Pacific
- 1.1. China
- 1.2. India
- 1.3. Japan
- 1.4. South Korea
- 1.5. Malaysia
- 1.6. Thailand
- 1.7. Indonesia
- 1.8. Vietnam
- 1.9. Rest of Asia Pacific
-
2. North America
- 2.1. United States
- 2.2. Canada
- 2.3. Mexico
-
3. Europe
- 3.1. Germany
- 3.2. United Kingdom
- 3.3. Italy
- 3.4. France
- 3.5. Italy
- 3.6. Spain
- 3.7. Nordic Countries
- 3.8. Turkey
- 3.9. Russia
- 3.10. Rest of Europe
-
4. South America
- 4.1. Brazil
- 4.2. Argentina
- 4.3. Colombia
- 4.4. Rest of South America
-
5. Middle East and Africa
- 5.1. Saudi Arabia
- 5.2. Qatar
- 5.3. United Arab Emirates
- 5.4. Nigeria
- 5.5. Egypt
- 5.6. South Africa
- 5.7. Rest of Middle East and Africa
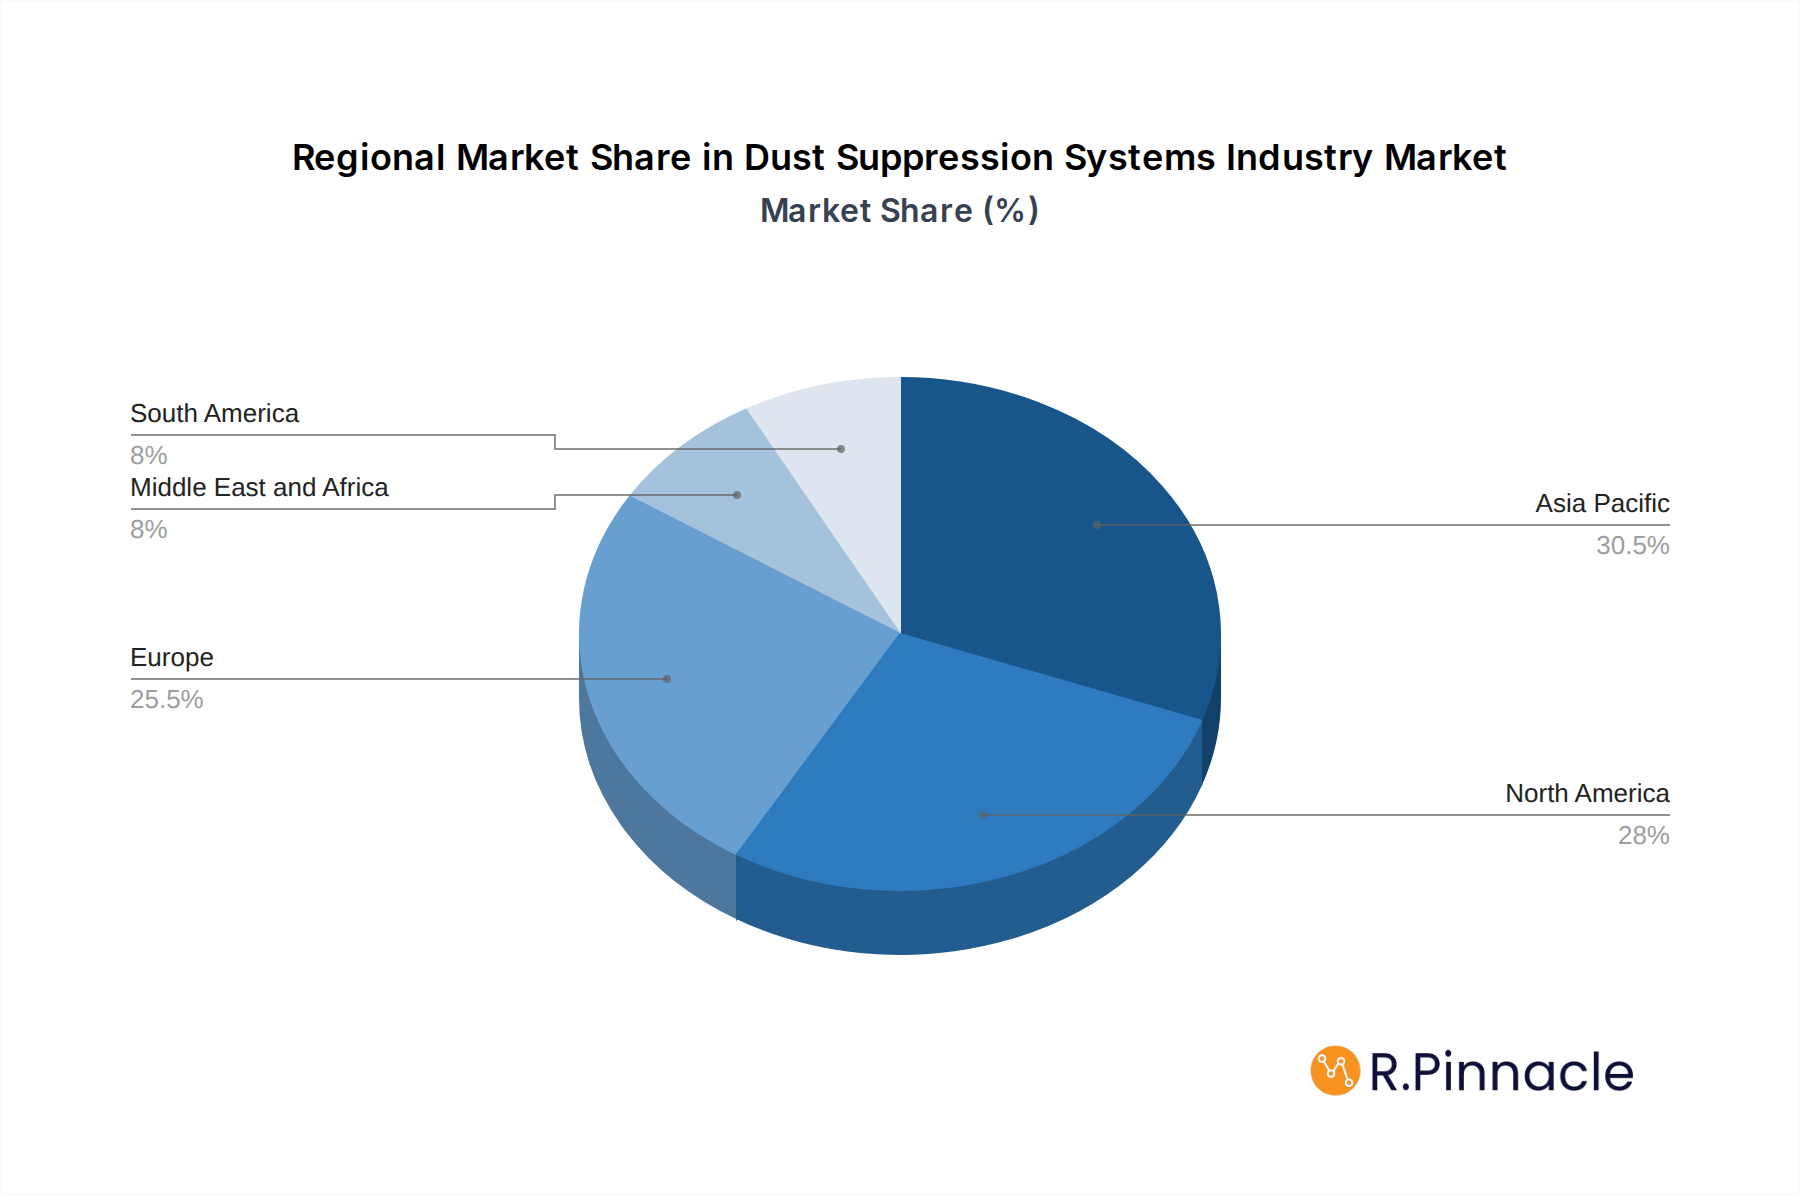
Dust Suppression Systems Industry Regional Market Share
Geographic Coverage of Dust Suppression Systems Industry
Dust Suppression Systems Industry REPORT HIGHLIGHTS
| Aspects | Details |
|---|---|
| Study Period | 2020-2034 |
| Base Year | 2025 |
| Estimated Year | 2026 |
| Forecast Period | 2026-2034 |
| Historical Period | 2020-2025 |
| Growth Rate | CAGR of 4.73% from 2020-2034 |
| Segmentation |
|
Table of Contents
- 1. Introduction
- 1.1. Research Scope
- 1.2. Market Segmentation
- 1.3. Research Objective
- 1.4. Definitions and Assumptions
- 2. Executive Summary
- 2.1. Market Snapshot
- 3. Market Dynamics
- 3.1. Market Drivers
- 3.2. Market Restrains
- 3.3. Market Trends
- 3.4. Market Opportunities
- 4. Market Factor Analysis
- 4.1. Porters Five Forces
- 4.1.1. Bargaining Power of Suppliers
- 4.1.2. Bargaining Power of Buyers
- 4.1.3. Threat of New Entrants
- 4.1.4. Threat of Substitutes
- 4.1.5. Competitive Rivalry
- 4.2. PESTEL analysis
- 4.3. BCG Analysis
- 4.3.1. Stars (High Growth, High Market Share)
- 4.3.2. Cash Cows (Low Growth, High Market Share)
- 4.3.3. Question Mark (High Growth, Low Market Share)
- 4.3.4. Dogs (Low Growth, Low Market Share)
- 4.4. Ansoff Matrix Analysis
- 4.5. Supply Chain Analysis
- 4.6. Regulatory Landscape
- 4.7. Current Market Potential and Opportunity Assessment (TAM–SAM–SOM Framework)
- 4.8. PRI Analyst Note
- 4.1. Porters Five Forces
- 5. Market Analysis, Insights and Forecast 2021-2033
- 5.1. Market Analysis, Insights and Forecast - by Chemical Type
- 5.1.1. Lignin Sulfonate
- 5.1.2. Calcium Chloride
- 5.1.3. Magnesium Chloride
- 5.1.4. Asphalt Emulsions
- 5.1.5. Oil Emulsions
- 5.1.6. Polymeric Emulsions
- 5.1.7. Other Chemical Types
- 5.2. Market Analysis, Insights and Forecast - by System Type
- 5.2.1. Dry Collection
- 5.2.2. Wet Suppression
- 5.3. Market Analysis, Insights and Forecast - by End-user Industry
- 5.3.1. Mining
- 5.3.2. Construction
- 5.3.3. Food and Beverage
- 5.3.4. Oil and Gas and Petrochemical
- 5.3.5. Pharmaceutical
- 5.3.6. Other End-user Industries
- 5.4. Market Analysis, Insights and Forecast - by Region
- 5.4.1. Asia Pacific
- 5.4.2. North America
- 5.4.3. Europe
- 5.4.4. South America
- 5.4.5. Middle East and Africa
- 5.1. Market Analysis, Insights and Forecast - by Chemical Type
- 6. Global Dust Suppression Systems Industry Analysis, Insights and Forecast, 2021-2033
- 6.1. Market Analysis, Insights and Forecast - by Chemical Type
- 6.1.1. Lignin Sulfonate
- 6.1.2. Calcium Chloride
- 6.1.3. Magnesium Chloride
- 6.1.4. Asphalt Emulsions
- 6.1.5. Oil Emulsions
- 6.1.6. Polymeric Emulsions
- 6.1.7. Other Chemical Types
- 6.2. Market Analysis, Insights and Forecast - by System Type
- 6.2.1. Dry Collection
- 6.2.2. Wet Suppression
- 6.3. Market Analysis, Insights and Forecast - by End-user Industry
- 6.3.1. Mining
- 6.3.2. Construction
- 6.3.3. Food and Beverage
- 6.3.4. Oil and Gas and Petrochemical
- 6.3.5. Pharmaceutical
- 6.3.6. Other End-user Industries
- 6.1. Market Analysis, Insights and Forecast - by Chemical Type
- 7. Asia Pacific Dust Suppression Systems Industry Analysis, Insights and Forecast, 2020-2032
- 7.1. Market Analysis, Insights and Forecast - by Chemical Type
- 7.1.1. Lignin Sulfonate
- 7.1.2. Calcium Chloride
- 7.1.3. Magnesium Chloride
- 7.1.4. Asphalt Emulsions
- 7.1.5. Oil Emulsions
- 7.1.6. Polymeric Emulsions
- 7.1.7. Other Chemical Types
- 7.2. Market Analysis, Insights and Forecast - by System Type
- 7.2.1. Dry Collection
- 7.2.2. Wet Suppression
- 7.3. Market Analysis, Insights and Forecast - by End-user Industry
- 7.3.1. Mining
- 7.3.2. Construction
- 7.3.3. Food and Beverage
- 7.3.4. Oil and Gas and Petrochemical
- 7.3.5. Pharmaceutical
- 7.3.6. Other End-user Industries
- 7.1. Market Analysis, Insights and Forecast - by Chemical Type
- 8. North America Dust Suppression Systems Industry Analysis, Insights and Forecast, 2020-2032
- 8.1. Market Analysis, Insights and Forecast - by Chemical Type
- 8.1.1. Lignin Sulfonate
- 8.1.2. Calcium Chloride
- 8.1.3. Magnesium Chloride
- 8.1.4. Asphalt Emulsions
- 8.1.5. Oil Emulsions
- 8.1.6. Polymeric Emulsions
- 8.1.7. Other Chemical Types
- 8.2. Market Analysis, Insights and Forecast - by System Type
- 8.2.1. Dry Collection
- 8.2.2. Wet Suppression
- 8.3. Market Analysis, Insights and Forecast - by End-user Industry
- 8.3.1. Mining
- 8.3.2. Construction
- 8.3.3. Food and Beverage
- 8.3.4. Oil and Gas and Petrochemical
- 8.3.5. Pharmaceutical
- 8.3.6. Other End-user Industries
- 8.1. Market Analysis, Insights and Forecast - by Chemical Type
- 9. Europe Dust Suppression Systems Industry Analysis, Insights and Forecast, 2020-2032
- 9.1. Market Analysis, Insights and Forecast - by Chemical Type
- 9.1.1. Lignin Sulfonate
- 9.1.2. Calcium Chloride
- 9.1.3. Magnesium Chloride
- 9.1.4. Asphalt Emulsions
- 9.1.5. Oil Emulsions
- 9.1.6. Polymeric Emulsions
- 9.1.7. Other Chemical Types
- 9.2. Market Analysis, Insights and Forecast - by System Type
- 9.2.1. Dry Collection
- 9.2.2. Wet Suppression
- 9.3. Market Analysis, Insights and Forecast - by End-user Industry
- 9.3.1. Mining
- 9.3.2. Construction
- 9.3.3. Food and Beverage
- 9.3.4. Oil and Gas and Petrochemical
- 9.3.5. Pharmaceutical
- 9.3.6. Other End-user Industries
- 9.1. Market Analysis, Insights and Forecast - by Chemical Type
- 10. South America Dust Suppression Systems Industry Analysis, Insights and Forecast, 2020-2032
- 10.1. Market Analysis, Insights and Forecast - by Chemical Type
- 10.1.1. Lignin Sulfonate
- 10.1.2. Calcium Chloride
- 10.1.3. Magnesium Chloride
- 10.1.4. Asphalt Emulsions
- 10.1.5. Oil Emulsions
- 10.1.6. Polymeric Emulsions
- 10.1.7. Other Chemical Types
- 10.2. Market Analysis, Insights and Forecast - by System Type
- 10.2.1. Dry Collection
- 10.2.2. Wet Suppression
- 10.3. Market Analysis, Insights and Forecast - by End-user Industry
- 10.3.1. Mining
- 10.3.2. Construction
- 10.3.3. Food and Beverage
- 10.3.4. Oil and Gas and Petrochemical
- 10.3.5. Pharmaceutical
- 10.3.6. Other End-user Industries
- 10.1. Market Analysis, Insights and Forecast - by Chemical Type
- 11. Middle East and Africa Dust Suppression Systems Industry Analysis, Insights and Forecast, 2020-2032
- 11.1. Market Analysis, Insights and Forecast - by Chemical Type
- 11.1.1. Lignin Sulfonate
- 11.1.2. Calcium Chloride
- 11.1.3. Magnesium Chloride
- 11.1.4. Asphalt Emulsions
- 11.1.5. Oil Emulsions
- 11.1.6. Polymeric Emulsions
- 11.1.7. Other Chemical Types
- 11.2. Market Analysis, Insights and Forecast - by System Type
- 11.2.1. Dry Collection
- 11.2.2. Wet Suppression
- 11.3. Market Analysis, Insights and Forecast - by End-user Industry
- 11.3.1. Mining
- 11.3.2. Construction
- 11.3.3. Food and Beverage
- 11.3.4. Oil and Gas and Petrochemical
- 11.3.5. Pharmaceutical
- 11.3.6. Other End-user Industries
- 11.1. Market Analysis, Insights and Forecast - by Chemical Type
- 12. Competitive Analysis
- 12.1. Company Profiles
- 12.1.1 Chemical Providers
- 12.1.1.1. Company Overview
- 12.1.1.2. Products
- 12.1.1.3. Company Financials
- 12.1.1.4. SWOT Analysis
- 12.1.2 1 ADM
- 12.1.2.1. Company Overview
- 12.1.2.2. Products
- 12.1.2.3. Company Financials
- 12.1.2.4. SWOT Analysis
- 12.1.3 2 Benetech Inc
- 12.1.3.1. Company Overview
- 12.1.3.2. Products
- 12.1.3.3. Company Financials
- 12.1.3.4. SWOT Analysis
- 12.1.4 3 Borregaard
- 12.1.4.1. Company Overview
- 12.1.4.2. Products
- 12.1.4.3. Company Financials
- 12.1.4.4. SWOT Analysis
- 12.1.5 4 Cargill Incorporated
- 12.1.5.1. Company Overview
- 12.1.5.2. Products
- 12.1.5.3. Company Financials
- 12.1.5.4. SWOT Analysis
- 12.1.6 5 Chemtex Speciality Limited
- 12.1.6.1. Company Overview
- 12.1.6.2. Products
- 12.1.6.3. Company Financials
- 12.1.6.4. SWOT Analysis
- 12.1.7 6 Evonik Industries AG
- 12.1.7.1. Company Overview
- 12.1.7.2. Products
- 12.1.7.3. Company Financials
- 12.1.7.4. SWOT Analysis
- 12.1.8 7 GelTech Solutions
- 12.1.8.1. Company Overview
- 12.1.8.2. Products
- 12.1.8.3. Company Financials
- 12.1.8.4. SWOT Analysis
- 12.1.9 8 Hexion
- 12.1.9.1. Company Overview
- 12.1.9.2. Products
- 12.1.9.3. Company Financials
- 12.1.9.4. SWOT Analysis
- 12.1.10 9 Quaker Houghton (Quaker Chemical Corporation)
- 12.1.10.1. Company Overview
- 12.1.10.2. Products
- 12.1.10.3. Company Financials
- 12.1.10.4. SWOT Analysis
- 12.1.11 10 Shaw Almex Industries Ltd
- 12.1.11.1. Company Overview
- 12.1.11.2. Products
- 12.1.11.3. Company Financials
- 12.1.11.4. SWOT Analysis
- 12.1.12 11 SUEZ
- 12.1.12.1. Company Overview
- 12.1.12.2. Products
- 12.1.12.3. Company Financials
- 12.1.12.4. SWOT Analysis
- 12.1.13 12 Ecolab
- 12.1.13.1. Company Overview
- 12.1.13.2. Products
- 12.1.13.3. Company Financials
- 12.1.13.4. SWOT Analysis
- 12.1.14 System Providers
- 12.1.14.1. Company Overview
- 12.1.14.2. Products
- 12.1.14.3. Company Financials
- 12.1.14.4. SWOT Analysis
- 12.1.15 1 BossTek
- 12.1.15.1. Company Overview
- 12.1.15.2. Products
- 12.1.15.3. Company Financials
- 12.1.15.4. SWOT Analysis
- 12.1.16 2 Camfil
- 12.1.16.1. Company Overview
- 12.1.16.2. Products
- 12.1.16.3. Company Financials
- 12.1.16.4. SWOT Analysis
- 12.1.17 3 CW Machine Worx
- 12.1.17.1. Company Overview
- 12.1.17.2. Products
- 12.1.17.3. Company Financials
- 12.1.17.4. SWOT Analysis
- 12.1.18 4 Donaldson Company Inc
- 12.1.18.1. Company Overview
- 12.1.18.2. Products
- 12.1.18.3. Company Financials
- 12.1.18.4. SWOT Analysis
- 12.1.19 5 DSH Systems Ltd
- 12.1.19.1. Company Overview
- 12.1.19.2. Products
- 12.1.19.3. Company Financials
- 12.1.19.4. SWOT Analysis
- 12.1.20 6 Duztech AB
- 12.1.20.1. Company Overview
- 12.1.20.2. Products
- 12.1.20.3. Company Financials
- 12.1.20.4. SWOT Analysis
- 12.1.21 7 Nederman Holding AB
- 12.1.21.1. Company Overview
- 12.1.21.2. Products
- 12.1.21.3. Company Financials
- 12.1.21.4. SWOT Analysis
- 12.1.22 8 SLY Inc
- 12.1.22.1. Company Overview
- 12.1.22.2. Products
- 12.1.22.3. Company Financials
- 12.1.22.4. SWOT Analysis
- 12.1.23 9 The ACT Group*List Not Exhaustive
- 12.1.23.1. Company Overview
- 12.1.23.2. Products
- 12.1.23.3. Company Financials
- 12.1.23.4. SWOT Analysis
- 12.1.1 Chemical Providers
- 12.2. Market Entropy
- 12.2.1 Company's Key Areas Served
- 12.2.2 Recent Developments
- 12.3. Company Market Share Analysis 2025
- 12.3.1 Top 5 Companies Market Share Analysis
- 12.3.2 Top 3 Companies Market Share Analysis
- 12.4. List of Potential Customers
- 13. Research Methodology
List of Figures
- Figure 1: Global Dust Suppression Systems Industry Revenue Breakdown (Million, %) by Region 2025 & 2033
- Figure 2: Global Dust Suppression Systems Industry Volume Breakdown (Billion, %) by Region 2025 & 2033
- Figure 3: Asia Pacific Dust Suppression Systems Industry Revenue (Million), by Chemical Type 2025 & 2033
- Figure 4: Asia Pacific Dust Suppression Systems Industry Volume (Billion), by Chemical Type 2025 & 2033
- Figure 5: Asia Pacific Dust Suppression Systems Industry Revenue Share (%), by Chemical Type 2025 & 2033
- Figure 6: Asia Pacific Dust Suppression Systems Industry Volume Share (%), by Chemical Type 2025 & 2033
- Figure 7: Asia Pacific Dust Suppression Systems Industry Revenue (Million), by System Type 2025 & 2033
- Figure 8: Asia Pacific Dust Suppression Systems Industry Volume (Billion), by System Type 2025 & 2033
- Figure 9: Asia Pacific Dust Suppression Systems Industry Revenue Share (%), by System Type 2025 & 2033
- Figure 10: Asia Pacific Dust Suppression Systems Industry Volume Share (%), by System Type 2025 & 2033
- Figure 11: Asia Pacific Dust Suppression Systems Industry Revenue (Million), by End-user Industry 2025 & 2033
- Figure 12: Asia Pacific Dust Suppression Systems Industry Volume (Billion), by End-user Industry 2025 & 2033
- Figure 13: Asia Pacific Dust Suppression Systems Industry Revenue Share (%), by End-user Industry 2025 & 2033
- Figure 14: Asia Pacific Dust Suppression Systems Industry Volume Share (%), by End-user Industry 2025 & 2033
- Figure 15: Asia Pacific Dust Suppression Systems Industry Revenue (Million), by Country 2025 & 2033
- Figure 16: Asia Pacific Dust Suppression Systems Industry Volume (Billion), by Country 2025 & 2033
- Figure 17: Asia Pacific Dust Suppression Systems Industry Revenue Share (%), by Country 2025 & 2033
- Figure 18: Asia Pacific Dust Suppression Systems Industry Volume Share (%), by Country 2025 & 2033
- Figure 19: North America Dust Suppression Systems Industry Revenue (Million), by Chemical Type 2025 & 2033
- Figure 20: North America Dust Suppression Systems Industry Volume (Billion), by Chemical Type 2025 & 2033
- Figure 21: North America Dust Suppression Systems Industry Revenue Share (%), by Chemical Type 2025 & 2033
- Figure 22: North America Dust Suppression Systems Industry Volume Share (%), by Chemical Type 2025 & 2033
- Figure 23: North America Dust Suppression Systems Industry Revenue (Million), by System Type 2025 & 2033
- Figure 24: North America Dust Suppression Systems Industry Volume (Billion), by System Type 2025 & 2033
- Figure 25: North America Dust Suppression Systems Industry Revenue Share (%), by System Type 2025 & 2033
- Figure 26: North America Dust Suppression Systems Industry Volume Share (%), by System Type 2025 & 2033
- Figure 27: North America Dust Suppression Systems Industry Revenue (Million), by End-user Industry 2025 & 2033
- Figure 28: North America Dust Suppression Systems Industry Volume (Billion), by End-user Industry 2025 & 2033
- Figure 29: North America Dust Suppression Systems Industry Revenue Share (%), by End-user Industry 2025 & 2033
- Figure 30: North America Dust Suppression Systems Industry Volume Share (%), by End-user Industry 2025 & 2033
- Figure 31: North America Dust Suppression Systems Industry Revenue (Million), by Country 2025 & 2033
- Figure 32: North America Dust Suppression Systems Industry Volume (Billion), by Country 2025 & 2033
- Figure 33: North America Dust Suppression Systems Industry Revenue Share (%), by Country 2025 & 2033
- Figure 34: North America Dust Suppression Systems Industry Volume Share (%), by Country 2025 & 2033
- Figure 35: Europe Dust Suppression Systems Industry Revenue (Million), by Chemical Type 2025 & 2033
- Figure 36: Europe Dust Suppression Systems Industry Volume (Billion), by Chemical Type 2025 & 2033
- Figure 37: Europe Dust Suppression Systems Industry Revenue Share (%), by Chemical Type 2025 & 2033
- Figure 38: Europe Dust Suppression Systems Industry Volume Share (%), by Chemical Type 2025 & 2033
- Figure 39: Europe Dust Suppression Systems Industry Revenue (Million), by System Type 2025 & 2033
- Figure 40: Europe Dust Suppression Systems Industry Volume (Billion), by System Type 2025 & 2033
- Figure 41: Europe Dust Suppression Systems Industry Revenue Share (%), by System Type 2025 & 2033
- Figure 42: Europe Dust Suppression Systems Industry Volume Share (%), by System Type 2025 & 2033
- Figure 43: Europe Dust Suppression Systems Industry Revenue (Million), by End-user Industry 2025 & 2033
- Figure 44: Europe Dust Suppression Systems Industry Volume (Billion), by End-user Industry 2025 & 2033
- Figure 45: Europe Dust Suppression Systems Industry Revenue Share (%), by End-user Industry 2025 & 2033
- Figure 46: Europe Dust Suppression Systems Industry Volume Share (%), by End-user Industry 2025 & 2033
- Figure 47: Europe Dust Suppression Systems Industry Revenue (Million), by Country 2025 & 2033
- Figure 48: Europe Dust Suppression Systems Industry Volume (Billion), by Country 2025 & 2033
- Figure 49: Europe Dust Suppression Systems Industry Revenue Share (%), by Country 2025 & 2033
- Figure 50: Europe Dust Suppression Systems Industry Volume Share (%), by Country 2025 & 2033
- Figure 51: South America Dust Suppression Systems Industry Revenue (Million), by Chemical Type 2025 & 2033
- Figure 52: South America Dust Suppression Systems Industry Volume (Billion), by Chemical Type 2025 & 2033
- Figure 53: South America Dust Suppression Systems Industry Revenue Share (%), by Chemical Type 2025 & 2033
- Figure 54: South America Dust Suppression Systems Industry Volume Share (%), by Chemical Type 2025 & 2033
- Figure 55: South America Dust Suppression Systems Industry Revenue (Million), by System Type 2025 & 2033
- Figure 56: South America Dust Suppression Systems Industry Volume (Billion), by System Type 2025 & 2033
- Figure 57: South America Dust Suppression Systems Industry Revenue Share (%), by System Type 2025 & 2033
- Figure 58: South America Dust Suppression Systems Industry Volume Share (%), by System Type 2025 & 2033
- Figure 59: South America Dust Suppression Systems Industry Revenue (Million), by End-user Industry 2025 & 2033
- Figure 60: South America Dust Suppression Systems Industry Volume (Billion), by End-user Industry 2025 & 2033
- Figure 61: South America Dust Suppression Systems Industry Revenue Share (%), by End-user Industry 2025 & 2033
- Figure 62: South America Dust Suppression Systems Industry Volume Share (%), by End-user Industry 2025 & 2033
- Figure 63: South America Dust Suppression Systems Industry Revenue (Million), by Country 2025 & 2033
- Figure 64: South America Dust Suppression Systems Industry Volume (Billion), by Country 2025 & 2033
- Figure 65: South America Dust Suppression Systems Industry Revenue Share (%), by Country 2025 & 2033
- Figure 66: South America Dust Suppression Systems Industry Volume Share (%), by Country 2025 & 2033
- Figure 67: Middle East and Africa Dust Suppression Systems Industry Revenue (Million), by Chemical Type 2025 & 2033
- Figure 68: Middle East and Africa Dust Suppression Systems Industry Volume (Billion), by Chemical Type 2025 & 2033
- Figure 69: Middle East and Africa Dust Suppression Systems Industry Revenue Share (%), by Chemical Type 2025 & 2033
- Figure 70: Middle East and Africa Dust Suppression Systems Industry Volume Share (%), by Chemical Type 2025 & 2033
- Figure 71: Middle East and Africa Dust Suppression Systems Industry Revenue (Million), by System Type 2025 & 2033
- Figure 72: Middle East and Africa Dust Suppression Systems Industry Volume (Billion), by System Type 2025 & 2033
- Figure 73: Middle East and Africa Dust Suppression Systems Industry Revenue Share (%), by System Type 2025 & 2033
- Figure 74: Middle East and Africa Dust Suppression Systems Industry Volume Share (%), by System Type 2025 & 2033
- Figure 75: Middle East and Africa Dust Suppression Systems Industry Revenue (Million), by End-user Industry 2025 & 2033
- Figure 76: Middle East and Africa Dust Suppression Systems Industry Volume (Billion), by End-user Industry 2025 & 2033
- Figure 77: Middle East and Africa Dust Suppression Systems Industry Revenue Share (%), by End-user Industry 2025 & 2033
- Figure 78: Middle East and Africa Dust Suppression Systems Industry Volume Share (%), by End-user Industry 2025 & 2033
- Figure 79: Middle East and Africa Dust Suppression Systems Industry Revenue (Million), by Country 2025 & 2033
- Figure 80: Middle East and Africa Dust Suppression Systems Industry Volume (Billion), by Country 2025 & 2033
- Figure 81: Middle East and Africa Dust Suppression Systems Industry Revenue Share (%), by Country 2025 & 2033
- Figure 82: Middle East and Africa Dust Suppression Systems Industry Volume Share (%), by Country 2025 & 2033
List of Tables
- Table 1: Global Dust Suppression Systems Industry Revenue Million Forecast, by Chemical Type 2020 & 2033
- Table 2: Global Dust Suppression Systems Industry Volume Billion Forecast, by Chemical Type 2020 & 2033
- Table 3: Global Dust Suppression Systems Industry Revenue Million Forecast, by System Type 2020 & 2033
- Table 4: Global Dust Suppression Systems Industry Volume Billion Forecast, by System Type 2020 & 2033
- Table 5: Global Dust Suppression Systems Industry Revenue Million Forecast, by End-user Industry 2020 & 2033
- Table 6: Global Dust Suppression Systems Industry Volume Billion Forecast, by End-user Industry 2020 & 2033
- Table 7: Global Dust Suppression Systems Industry Revenue Million Forecast, by Region 2020 & 2033
- Table 8: Global Dust Suppression Systems Industry Volume Billion Forecast, by Region 2020 & 2033
- Table 9: Global Dust Suppression Systems Industry Revenue Million Forecast, by Chemical Type 2020 & 2033
- Table 10: Global Dust Suppression Systems Industry Volume Billion Forecast, by Chemical Type 2020 & 2033
- Table 11: Global Dust Suppression Systems Industry Revenue Million Forecast, by System Type 2020 & 2033
- Table 12: Global Dust Suppression Systems Industry Volume Billion Forecast, by System Type 2020 & 2033
- Table 13: Global Dust Suppression Systems Industry Revenue Million Forecast, by End-user Industry 2020 & 2033
- Table 14: Global Dust Suppression Systems Industry Volume Billion Forecast, by End-user Industry 2020 & 2033
- Table 15: Global Dust Suppression Systems Industry Revenue Million Forecast, by Country 2020 & 2033
- Table 16: Global Dust Suppression Systems Industry Volume Billion Forecast, by Country 2020 & 2033
- Table 17: China Dust Suppression Systems Industry Revenue (Million) Forecast, by Application 2020 & 2033
- Table 18: China Dust Suppression Systems Industry Volume (Billion) Forecast, by Application 2020 & 2033
- Table 19: India Dust Suppression Systems Industry Revenue (Million) Forecast, by Application 2020 & 2033
- Table 20: India Dust Suppression Systems Industry Volume (Billion) Forecast, by Application 2020 & 2033
- Table 21: Japan Dust Suppression Systems Industry Revenue (Million) Forecast, by Application 2020 & 2033
- Table 22: Japan Dust Suppression Systems Industry Volume (Billion) Forecast, by Application 2020 & 2033
- Table 23: South Korea Dust Suppression Systems Industry Revenue (Million) Forecast, by Application 2020 & 2033
- Table 24: South Korea Dust Suppression Systems Industry Volume (Billion) Forecast, by Application 2020 & 2033
- Table 25: Malaysia Dust Suppression Systems Industry Revenue (Million) Forecast, by Application 2020 & 2033
- Table 26: Malaysia Dust Suppression Systems Industry Volume (Billion) Forecast, by Application 2020 & 2033
- Table 27: Thailand Dust Suppression Systems Industry Revenue (Million) Forecast, by Application 2020 & 2033
- Table 28: Thailand Dust Suppression Systems Industry Volume (Billion) Forecast, by Application 2020 & 2033
- Table 29: Indonesia Dust Suppression Systems Industry Revenue (Million) Forecast, by Application 2020 & 2033
- Table 30: Indonesia Dust Suppression Systems Industry Volume (Billion) Forecast, by Application 2020 & 2033
- Table 31: Vietnam Dust Suppression Systems Industry Revenue (Million) Forecast, by Application 2020 & 2033
- Table 32: Vietnam Dust Suppression Systems Industry Volume (Billion) Forecast, by Application 2020 & 2033
- Table 33: Rest of Asia Pacific Dust Suppression Systems Industry Revenue (Million) Forecast, by Application 2020 & 2033
- Table 34: Rest of Asia Pacific Dust Suppression Systems Industry Volume (Billion) Forecast, by Application 2020 & 2033
- Table 35: Global Dust Suppression Systems Industry Revenue Million Forecast, by Chemical Type 2020 & 2033
- Table 36: Global Dust Suppression Systems Industry Volume Billion Forecast, by Chemical Type 2020 & 2033
- Table 37: Global Dust Suppression Systems Industry Revenue Million Forecast, by System Type 2020 & 2033
- Table 38: Global Dust Suppression Systems Industry Volume Billion Forecast, by System Type 2020 & 2033
- Table 39: Global Dust Suppression Systems Industry Revenue Million Forecast, by End-user Industry 2020 & 2033
- Table 40: Global Dust Suppression Systems Industry Volume Billion Forecast, by End-user Industry 2020 & 2033
- Table 41: Global Dust Suppression Systems Industry Revenue Million Forecast, by Country 2020 & 2033
- Table 42: Global Dust Suppression Systems Industry Volume Billion Forecast, by Country 2020 & 2033
- Table 43: United States Dust Suppression Systems Industry Revenue (Million) Forecast, by Application 2020 & 2033
- Table 44: United States Dust Suppression Systems Industry Volume (Billion) Forecast, by Application 2020 & 2033
- Table 45: Canada Dust Suppression Systems Industry Revenue (Million) Forecast, by Application 2020 & 2033
- Table 46: Canada Dust Suppression Systems Industry Volume (Billion) Forecast, by Application 2020 & 2033
- Table 47: Mexico Dust Suppression Systems Industry Revenue (Million) Forecast, by Application 2020 & 2033
- Table 48: Mexico Dust Suppression Systems Industry Volume (Billion) Forecast, by Application 2020 & 2033
- Table 49: Global Dust Suppression Systems Industry Revenue Million Forecast, by Chemical Type 2020 & 2033
- Table 50: Global Dust Suppression Systems Industry Volume Billion Forecast, by Chemical Type 2020 & 2033
- Table 51: Global Dust Suppression Systems Industry Revenue Million Forecast, by System Type 2020 & 2033
- Table 52: Global Dust Suppression Systems Industry Volume Billion Forecast, by System Type 2020 & 2033
- Table 53: Global Dust Suppression Systems Industry Revenue Million Forecast, by End-user Industry 2020 & 2033
- Table 54: Global Dust Suppression Systems Industry Volume Billion Forecast, by End-user Industry 2020 & 2033
- Table 55: Global Dust Suppression Systems Industry Revenue Million Forecast, by Country 2020 & 2033
- Table 56: Global Dust Suppression Systems Industry Volume Billion Forecast, by Country 2020 & 2033
- Table 57: Germany Dust Suppression Systems Industry Revenue (Million) Forecast, by Application 2020 & 2033
- Table 58: Germany Dust Suppression Systems Industry Volume (Billion) Forecast, by Application 2020 & 2033
- Table 59: United Kingdom Dust Suppression Systems Industry Revenue (Million) Forecast, by Application 2020 & 2033
- Table 60: United Kingdom Dust Suppression Systems Industry Volume (Billion) Forecast, by Application 2020 & 2033
- Table 61: Italy Dust Suppression Systems Industry Revenue (Million) Forecast, by Application 2020 & 2033
- Table 62: Italy Dust Suppression Systems Industry Volume (Billion) Forecast, by Application 2020 & 2033
- Table 63: France Dust Suppression Systems Industry Revenue (Million) Forecast, by Application 2020 & 2033
- Table 64: France Dust Suppression Systems Industry Volume (Billion) Forecast, by Application 2020 & 2033
- Table 65: Italy Dust Suppression Systems Industry Revenue (Million) Forecast, by Application 2020 & 2033
- Table 66: Italy Dust Suppression Systems Industry Volume (Billion) Forecast, by Application 2020 & 2033
- Table 67: Spain Dust Suppression Systems Industry Revenue (Million) Forecast, by Application 2020 & 2033
- Table 68: Spain Dust Suppression Systems Industry Volume (Billion) Forecast, by Application 2020 & 2033
- Table 69: Nordic Countries Dust Suppression Systems Industry Revenue (Million) Forecast, by Application 2020 & 2033
- Table 70: Nordic Countries Dust Suppression Systems Industry Volume (Billion) Forecast, by Application 2020 & 2033
- Table 71: Turkey Dust Suppression Systems Industry Revenue (Million) Forecast, by Application 2020 & 2033
- Table 72: Turkey Dust Suppression Systems Industry Volume (Billion) Forecast, by Application 2020 & 2033
- Table 73: Russia Dust Suppression Systems Industry Revenue (Million) Forecast, by Application 2020 & 2033
- Table 74: Russia Dust Suppression Systems Industry Volume (Billion) Forecast, by Application 2020 & 2033
- Table 75: Rest of Europe Dust Suppression Systems Industry Revenue (Million) Forecast, by Application 2020 & 2033
- Table 76: Rest of Europe Dust Suppression Systems Industry Volume (Billion) Forecast, by Application 2020 & 2033
- Table 77: Global Dust Suppression Systems Industry Revenue Million Forecast, by Chemical Type 2020 & 2033
- Table 78: Global Dust Suppression Systems Industry Volume Billion Forecast, by Chemical Type 2020 & 2033
- Table 79: Global Dust Suppression Systems Industry Revenue Million Forecast, by System Type 2020 & 2033
- Table 80: Global Dust Suppression Systems Industry Volume Billion Forecast, by System Type 2020 & 2033
- Table 81: Global Dust Suppression Systems Industry Revenue Million Forecast, by End-user Industry 2020 & 2033
- Table 82: Global Dust Suppression Systems Industry Volume Billion Forecast, by End-user Industry 2020 & 2033
- Table 83: Global Dust Suppression Systems Industry Revenue Million Forecast, by Country 2020 & 2033
- Table 84: Global Dust Suppression Systems Industry Volume Billion Forecast, by Country 2020 & 2033
- Table 85: Brazil Dust Suppression Systems Industry Revenue (Million) Forecast, by Application 2020 & 2033
- Table 86: Brazil Dust Suppression Systems Industry Volume (Billion) Forecast, by Application 2020 & 2033
- Table 87: Argentina Dust Suppression Systems Industry Revenue (Million) Forecast, by Application 2020 & 2033
- Table 88: Argentina Dust Suppression Systems Industry Volume (Billion) Forecast, by Application 2020 & 2033
- Table 89: Colombia Dust Suppression Systems Industry Revenue (Million) Forecast, by Application 2020 & 2033
- Table 90: Colombia Dust Suppression Systems Industry Volume (Billion) Forecast, by Application 2020 & 2033
- Table 91: Rest of South America Dust Suppression Systems Industry Revenue (Million) Forecast, by Application 2020 & 2033
- Table 92: Rest of South America Dust Suppression Systems Industry Volume (Billion) Forecast, by Application 2020 & 2033
- Table 93: Global Dust Suppression Systems Industry Revenue Million Forecast, by Chemical Type 2020 & 2033
- Table 94: Global Dust Suppression Systems Industry Volume Billion Forecast, by Chemical Type 2020 & 2033
- Table 95: Global Dust Suppression Systems Industry Revenue Million Forecast, by System Type 2020 & 2033
- Table 96: Global Dust Suppression Systems Industry Volume Billion Forecast, by System Type 2020 & 2033
- Table 97: Global Dust Suppression Systems Industry Revenue Million Forecast, by End-user Industry 2020 & 2033
- Table 98: Global Dust Suppression Systems Industry Volume Billion Forecast, by End-user Industry 2020 & 2033
- Table 99: Global Dust Suppression Systems Industry Revenue Million Forecast, by Country 2020 & 2033
- Table 100: Global Dust Suppression Systems Industry Volume Billion Forecast, by Country 2020 & 2033
- Table 101: Saudi Arabia Dust Suppression Systems Industry Revenue (Million) Forecast, by Application 2020 & 2033
- Table 102: Saudi Arabia Dust Suppression Systems Industry Volume (Billion) Forecast, by Application 2020 & 2033
- Table 103: Qatar Dust Suppression Systems Industry Revenue (Million) Forecast, by Application 2020 & 2033
- Table 104: Qatar Dust Suppression Systems Industry Volume (Billion) Forecast, by Application 2020 & 2033
- Table 105: United Arab Emirates Dust Suppression Systems Industry Revenue (Million) Forecast, by Application 2020 & 2033
- Table 106: United Arab Emirates Dust Suppression Systems Industry Volume (Billion) Forecast, by Application 2020 & 2033
- Table 107: Nigeria Dust Suppression Systems Industry Revenue (Million) Forecast, by Application 2020 & 2033
- Table 108: Nigeria Dust Suppression Systems Industry Volume (Billion) Forecast, by Application 2020 & 2033
- Table 109: Egypt Dust Suppression Systems Industry Revenue (Million) Forecast, by Application 2020 & 2033
- Table 110: Egypt Dust Suppression Systems Industry Volume (Billion) Forecast, by Application 2020 & 2033
- Table 111: South Africa Dust Suppression Systems Industry Revenue (Million) Forecast, by Application 2020 & 2033
- Table 112: South Africa Dust Suppression Systems Industry Volume (Billion) Forecast, by Application 2020 & 2033
- Table 113: Rest of Middle East and Africa Dust Suppression Systems Industry Revenue (Million) Forecast, by Application 2020 & 2033
- Table 114: Rest of Middle East and Africa Dust Suppression Systems Industry Volume (Billion) Forecast, by Application 2020 & 2033
Frequently Asked Questions
1. What is the projected Compound Annual Growth Rate (CAGR) of the Dust Suppression Systems Industry?
The projected CAGR is approximately 4.73%.
2. Which companies are prominent players in the Dust Suppression Systems Industry?
Key companies in the market include Chemical Providers, 1 ADM, 2 Benetech Inc, 3 Borregaard, 4 Cargill Incorporated, 5 Chemtex Speciality Limited, 6 Evonik Industries AG, 7 GelTech Solutions, 8 Hexion, 9 Quaker Houghton (Quaker Chemical Corporation), 10 Shaw Almex Industries Ltd, 11 SUEZ, 12 Ecolab, System Providers, 1 BossTek, 2 Camfil, 3 CW Machine Worx, 4 Donaldson Company Inc, 5 DSH Systems Ltd, 6 Duztech AB, 7 Nederman Holding AB, 8 SLY Inc, 9 The ACT Group*List Not Exhaustive.
3. What are the main segments of the Dust Suppression Systems Industry?
The market segments include Chemical Type, System Type, End-user Industry.
4. Can you provide details about the market size?
The market size is estimated to be USD 14.44 Million as of 2022.
5. What are some drivers contributing to market growth?
Growth in Construction and Infrastructure in Asia-Pacific; Increase in Regulatory Compliances; Other Drivers.
6. What are the notable trends driving market growth?
Construction Industry to Dominate the Market.
7. Are there any restraints impacting market growth?
Growth in Construction and Infrastructure in Asia-Pacific; Increase in Regulatory Compliances; Other Drivers.
8. Can you provide examples of recent developments in the market?
March 2024: Camfil Air Pollution Control (APC) has unveiled its newest offering, the Gold Series Timer (GST), an innovative-edge dust collection controller. The GST serves as a straightforward yet powerful tool for managing pulse-jet cleaning in various industrial dust collection systems, such as baghouses. With its state-of-the-art design, the GST provides an intuitive and easily implementable solution for pulse-jet cleaning in industrial dust collection systems.February 2023: BOSSTEK, renowned for its portable dust-suppression equipment, has unveiled the DustBoss DB-45 Surge, the newest addition to its acclaimed Surge line. This innovative-edge technology features an innovative pressurized center nozzle, complemented by the OEM's trusted fan and misting ring system, empowering users to effectively manage dust, regardless of weather conditions.
9. What pricing options are available for accessing the report?
Pricing options include single-user, multi-user, and enterprise licenses priced at USD 4750, USD 5250, and USD 8750 respectively.
10. Is the market size provided in terms of value or volume?
The market size is provided in terms of value, measured in Million and volume, measured in Billion.
11. Are there any specific market keywords associated with the report?
Yes, the market keyword associated with the report is "Dust Suppression Systems Industry," which aids in identifying and referencing the specific market segment covered.
12. How do I determine which pricing option suits my needs best?
The pricing options vary based on user requirements and access needs. Individual users may opt for single-user licenses, while businesses requiring broader access may choose multi-user or enterprise licenses for cost-effective access to the report.
13. Are there any additional resources or data provided in the Dust Suppression Systems Industry report?
While the report offers comprehensive insights, it's advisable to review the specific contents or supplementary materials provided to ascertain if additional resources or data are available.
14. How can I stay updated on further developments or reports in the Dust Suppression Systems Industry?
To stay informed about further developments, trends, and reports in the Dust Suppression Systems Industry, consider subscribing to industry newsletters, following relevant companies and organizations, or regularly checking reputable industry news sources and publications.
Methodology
Step 1 - Identification of Relevant Samples Size from Population Database


Step 2 - Approaches for Defining Global Market Size (Value, Volume* & Price*)

Note*: In applicable scenarios
Step 3 - Data Sources
Primary Research
- Web Analytics
- Survey Reports
- Research Institute
- Latest Research Reports
- Opinion Leaders
Secondary Research
- Annual Reports
- White Paper
- Latest Press Release
- Industry Association
- Paid Database
- Investor Presentations

Step 4 - Data Triangulation
Involves using different sources of information in order to increase the validity of a study
These sources are likely to be stakeholders in a program - participants, other researchers, program staff, other community members, and so on.
Then we put all data in single framework & apply various statistical tools to find out the dynamic on the market.
During the analysis stage, feedback from the stakeholder groups would be compared to determine areas of agreement as well as areas of divergence