

Key Insights
The global cleaning mop market is poised for significant expansion, projected to reach USD 8.27 billion in 2025. This growth is driven by a compelling CAGR of 14.34%, indicating a robust upward trajectory that will likely extend well beyond the forecast period. A primary catalyst for this surge is the increasing consumer awareness regarding hygiene and sanitation, especially amplified by recent global health events. This heightened focus translates into a greater demand for effective cleaning solutions across all sectors. Furthermore, the growing urbanization and the rise of nuclear families, particularly in emerging economies, contribute to the demand for convenient and efficient cleaning tools. The continuous innovation in mop technology, introducing features like enhanced absorbency, ergonomic designs, and eco-friendly materials, is also playing a crucial role in attracting consumers and businesses alike. From advanced microfiber cloths to smart self-wringing mechanisms, product development is directly addressing user pain points and enhancing the overall cleaning experience, thereby fueling market penetration and revenue generation.
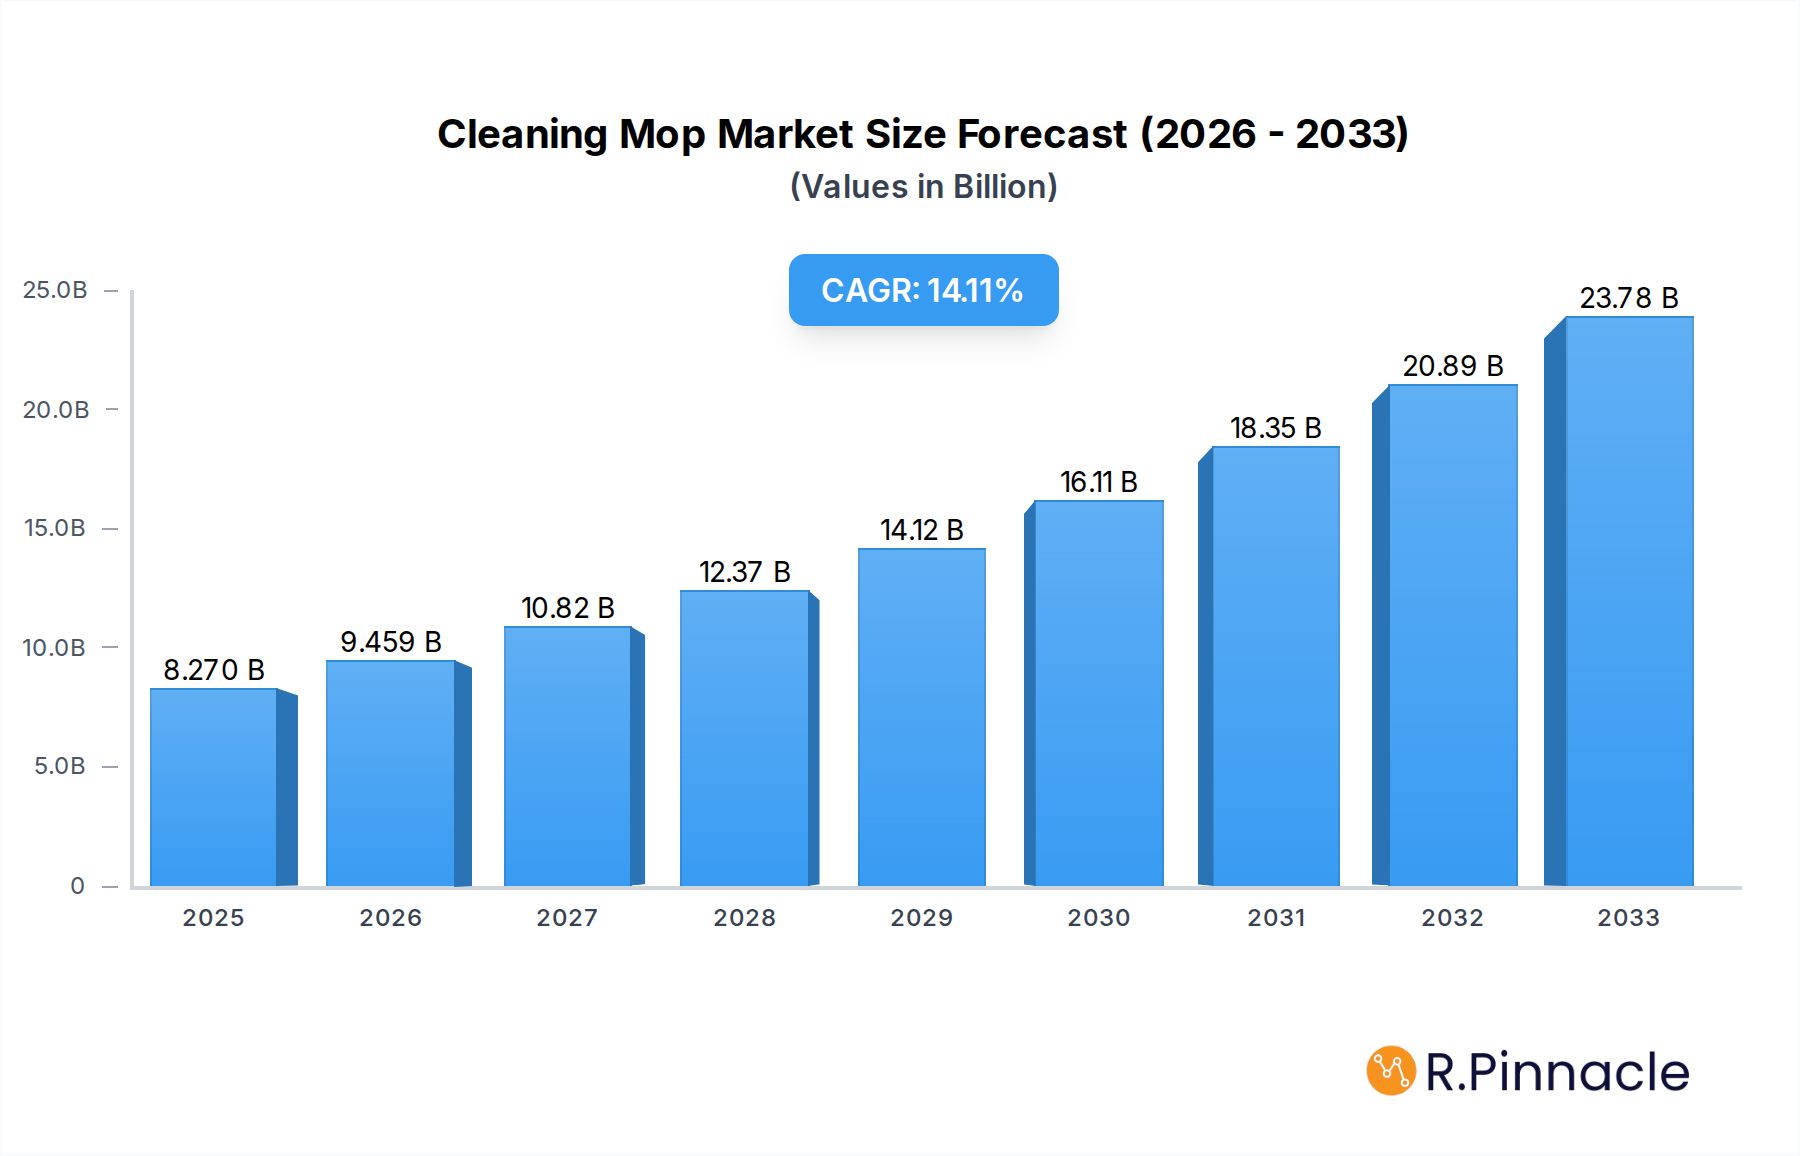
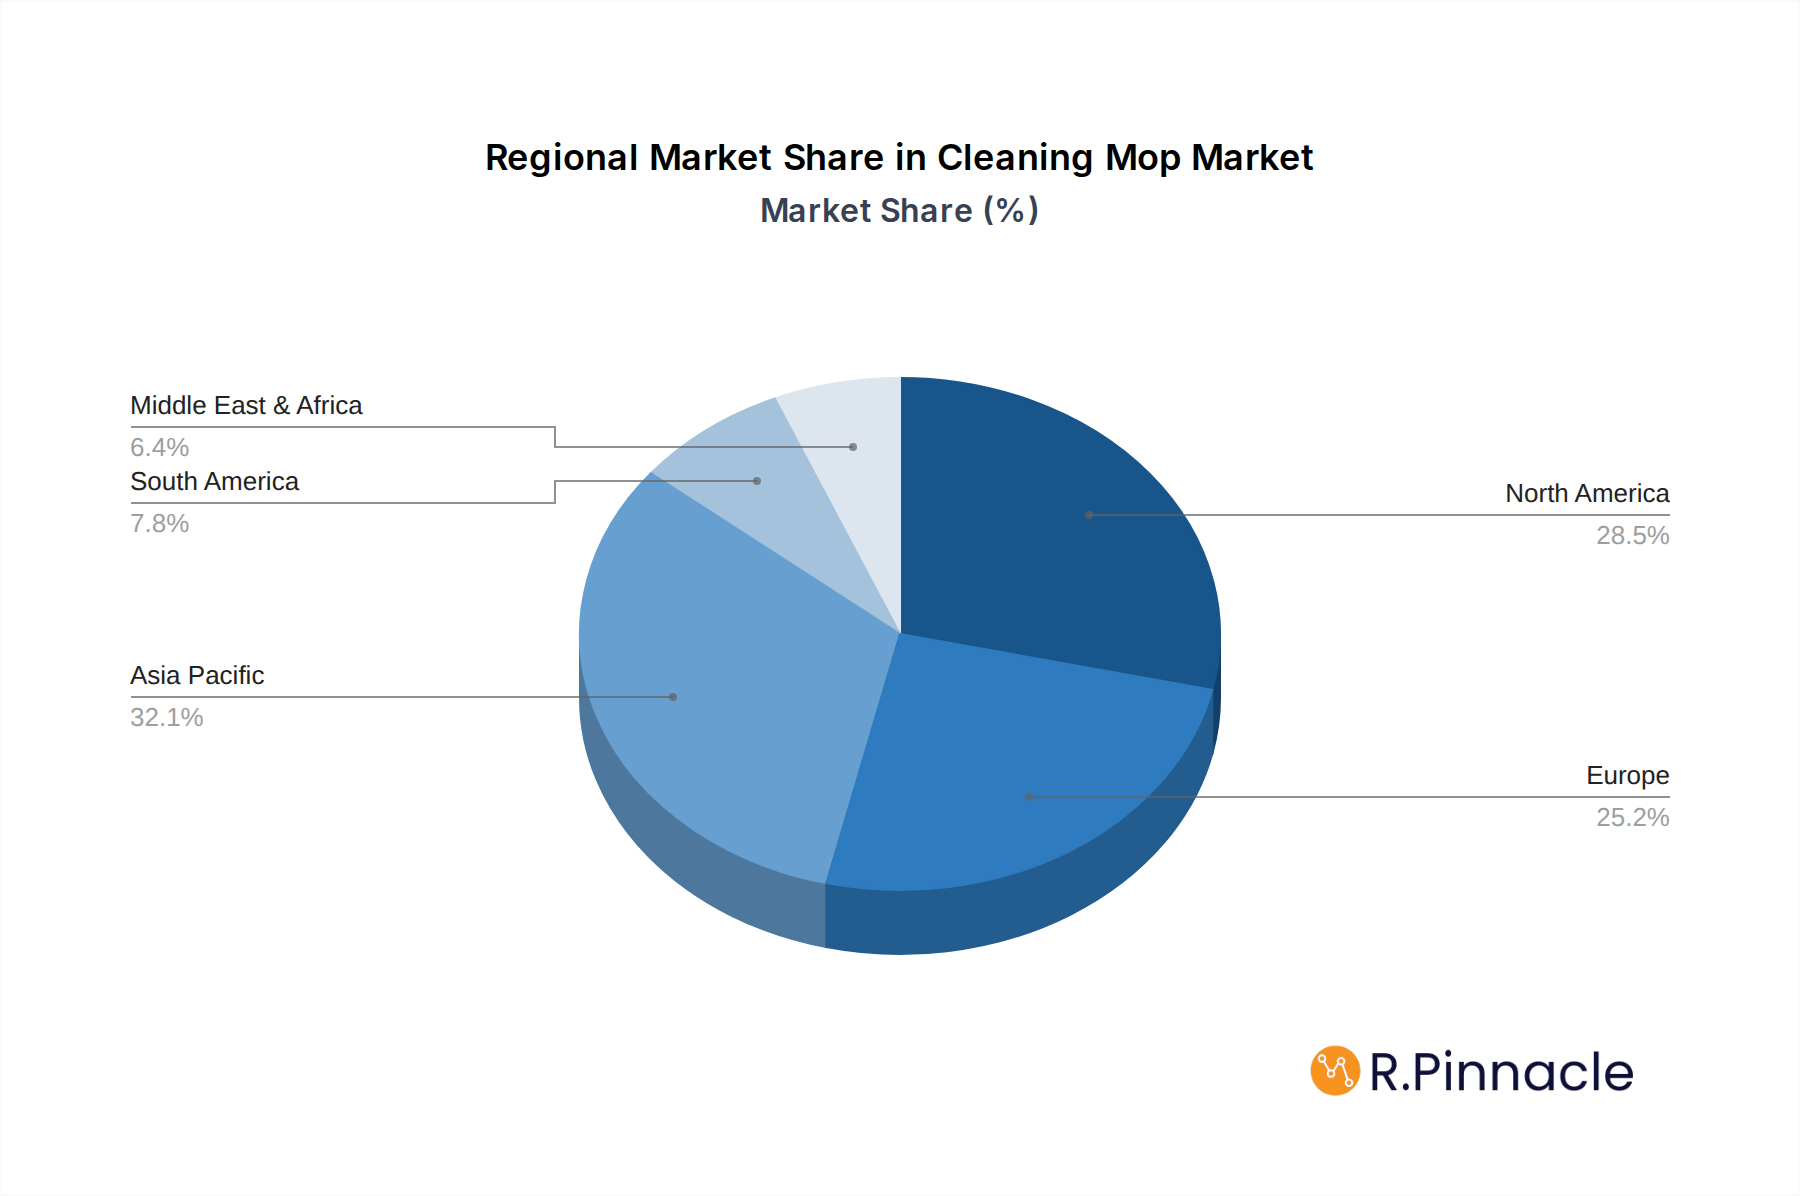
Cleaning Mop Market Size (In Billion)
The market segmentation reveals a diverse landscape catering to a wide array of needs. The "Residential" segment, driven by individual household requirements for maintaining clean living spaces, is a cornerstone of the market. Simultaneously, the "Commercial" and "Hospital" segments represent substantial growth avenues, fueled by stringent hygiene regulations and the need for professional-grade cleaning solutions in public and healthcare facilities. The industrial sector also contributes significantly, demanding durable and highly effective mops for large-scale cleaning operations. In terms of product types, while traditional "Cloth Mops" continue to hold a significant share due to their affordability and versatility, innovative "Sponge Mops" are gaining traction for their superior absorbency and ease of use, particularly for spills. The market is populated by a mix of established global players and niche manufacturers, all vying for market share through product differentiation, strategic partnerships, and expanding distribution networks. Regions like Asia Pacific and North America are expected to lead in terms of market size, influenced by their large populations, economic development, and established cleaning habits, while other regions show strong potential for rapid growth.

Cleaning Mop Company Market Share
Cleaning Mop Market Research Report: Unveiling Growth Trajectories and Strategic Imperatives (2019-2033)
This comprehensive Cleaning Mop Market research report delves into the intricate landscape of the global mop market, providing deep-dive analysis and actionable insights for industry stakeholders. Covering a study period from 2019 to 2033, with a base and estimated year of 2025 and a forecast period from 2025 to 2033, this report leverages extensive historical data from 2019 to 2024 to project future market dynamics.
Cleaning Mop Market Structure & Innovation Trends
The global Cleaning Mop market exhibits a XX% market concentration, with a dynamic interplay between established giants and emerging innovators. Key innovation drivers include the demand for eco-friendly materials, enhanced cleaning efficiency, and ergonomic designs. Regulatory frameworks, such as those pertaining to material safety and waste disposal, are increasingly shaping product development and market access. Product substitutes, including robotic cleaning devices and specialized cleaning tools, present a constant competitive challenge, necessitating continuous product evolution. End-user demographics are shifting, with a growing emphasis on convenience and hygiene in both residential and commercial settings. Mergers and acquisitions (M&A) activities are observed, with total deal values estimated at approximately $XX billion, reflecting strategic consolidations and market expansion efforts by key players like Libman, Freudenberg Gala, and Clorox.
Cleaning Mop Market Dynamics & Trends
The Cleaning Mop market is poised for robust growth, driven by several pivotal factors. Increasing global awareness of hygiene standards, particularly in the wake of recent health concerns, is a significant market growth driver, fueling demand across all segments. Technological disruptions are revolutionizing mop design, with advancements in microfiber technology, self-cleaning mechanisms, and integrated water dispensing systems enhancing product efficacy and user experience. Consumer preferences are evolving towards sustainable and durable cleaning solutions, prompting manufacturers to invest in eco-friendly materials and production processes. Competitive dynamics are intense, characterized by product differentiation, aggressive pricing strategies, and expanding distribution networks. The market penetration of innovative cleaning mop solutions is projected to increase significantly. The Compound Annual Growth Rate (CAGR) for the cleaning mop market is estimated at XX% during the forecast period, indicating substantial expansion.
Dominant Regions & Segments in Cleaning Mop
North America currently dominates the global Cleaning Mop market, with the United States leading in terms of market size and consumer spending. This dominance is attributed to strong economic policies promoting household and commercial hygiene, coupled with significant investment in infrastructure that supports the widespread adoption of cleaning solutions.
- Application: Residential: The residential segment is a major growth engine, fueled by rising disposable incomes and an increasing preference for well-maintained living spaces.
- Application: Commercial: The commercial segment, encompassing offices, retail spaces, and hospitality, is witnessing substantial growth driven by stringent hygiene regulations and the need for efficient cleaning solutions.
- Application: Hospital: The hospital segment demonstrates consistent demand, propelled by the critical need for sterile environments and infection control.
- Application: Industrial: The industrial segment, though smaller, shows steady growth, driven by the requirement for robust and specialized cleaning tools in manufacturing and production facilities.
- Types: Cloth Mop: Cloth mops, particularly those utilizing advanced microfiber technology, remain a popular choice due to their effectiveness and versatility.
- Types: Sponge Mop: Sponge mops continue to hold a significant market share, particularly in residential applications, due to their absorbency and ease of use.
Cleaning Mop Product Innovations
Product innovations in the Cleaning Mop sector are focused on enhancing cleaning performance, sustainability, and user convenience. Advances in microfiber materials offer superior absorbency and particle trapping, while eco-friendly designs incorporating recycled plastics and biodegradable components are gaining traction. Smart cleaning features, such as integrated spray mechanisms and self-wringing capabilities, are enhancing user experience and competitive advantage.
Report Scope & Segmentation Analysis
This report segments the Cleaning Mop market by Application: Residential, Commercial, Hospital, Industrial, and Others. The Residential segment is expected to grow at a CAGR of XX% with a market size of $XX billion by 2033. The Commercial segment, valued at $XX billion, is projected to expand at a CAGR of XX%, driven by increasing demand for professional cleaning services. The Hospital segment, a critical area for hygiene, is estimated at $XX billion with a projected CAGR of XX%. The Industrial segment and 'Others' category are also detailed with their respective growth projections and competitive landscapes.
Key Drivers of Cleaning Mop Growth
Key drivers for the Cleaning Mop market growth are multifaceted. Technological advancements, such as the development of highly absorbent and durable microfiber cloths, are enhancing product performance. Growing awareness of hygiene and sanitation, particularly in public spaces and healthcare facilities, is a significant economic driver. Furthermore, evolving consumer preferences towards convenient and efficient cleaning solutions are propelling market expansion.
Challenges in the Cleaning Mop Sector
Despite strong growth prospects, the Cleaning Mop sector faces several challenges. Intense price competition among manufacturers can impact profit margins. Supply chain disruptions, particularly concerning raw material availability and logistics, can affect production and distribution. Evolving environmental regulations, while promoting sustainability, can also necessitate significant investment in new product development and manufacturing processes.
Emerging Opportunities in Cleaning Mop
Emerging opportunities in the Cleaning Mop market lie in the development of smart and connected cleaning solutions. The increasing demand for eco-friendly and sustainable mops presents a significant opportunity for manufacturers focusing on biodegradable materials and reduced environmental impact. Expansion into emerging economies with growing middle-class populations and increasing awareness of hygiene standards also offers substantial growth potential.
Leading Players in the Cleaning Mop Market
- Libman
- Freudenberg Gala
- Clorox
- PG
- Colgate
- Unilever
- Scotch Brite (3M)
- Zwipes
- ERC
- Eurow
- Atlas Graham
- Norwex
- Toray
- Partek
Key Developments in Cleaning Mop Industry
- 2024 (Q1): Libman launches a new range of eco-friendly microfiber mops, enhancing sustainability in the residential sector.
- 2023 (Q4): Freudenberg Gala introduces advanced anti-microbial mop technology for hospital applications.
- 2023 (Q3): Clorox acquires a smaller competitor, expanding its product portfolio and market reach.
- 2023 (Q2): Scotch Brite (3M) unveils a new self-wringing mop system for enhanced user convenience.
- 2022 (Q4): Norwex expands its direct-to-consumer sales channels, increasing market penetration.
Future Outlook for Cleaning Mop Market
The future outlook for the Cleaning Mop market is exceptionally positive, driven by persistent demand for cleanliness and hygiene. Continued innovation in material science and product design, particularly in the realm of sustainable and smart cleaning solutions, will be pivotal. The expanding middle class in developing economies presents a vast untapped market, promising significant growth accelerators. Strategic partnerships and a focus on product differentiation will be key for sustained success.
Cleaning Mop Segmentation
-
1. Application
- 1.1. Residential
- 1.2. Commercial
- 1.3. Hospital
- 1.4. Industrial
- 1.5. Others
-
2. Types
- 2.1. Cloth Mop
- 2.2. Sponge Mop
- 2.3. Others
Cleaning Mop Segmentation By Geography
-
1. North America
- 1.1. United States
- 1.2. Canada
- 1.3. Mexico
-
2. South America
- 2.1. Brazil
- 2.2. Argentina
- 2.3. Rest of South America
-
3. Europe
- 3.1. United Kingdom
- 3.2. Germany
- 3.3. France
- 3.4. Italy
- 3.5. Spain
- 3.6. Russia
- 3.7. Benelux
- 3.8. Nordics
- 3.9. Rest of Europe
-
4. Middle East & Africa
- 4.1. Turkey
- 4.2. Israel
- 4.3. GCC
- 4.4. North Africa
- 4.5. South Africa
- 4.6. Rest of Middle East & Africa
-
5. Asia Pacific
- 5.1. China
- 5.2. India
- 5.3. Japan
- 5.4. South Korea
- 5.5. ASEAN
- 5.6. Oceania
- 5.7. Rest of Asia Pacific
Cleaning Mop Regional Market Share
Geographic Coverage of Cleaning Mop
Cleaning Mop REPORT HIGHLIGHTS
| Aspects | Details |
|---|---|
| Study Period | 2020-2034 |
| Base Year | 2025 |
| Estimated Year | 2026 |
| Forecast Period | 2026-2034 |
| Historical Period | 2020-2025 |
| Growth Rate | CAGR of 14.34% from 2020-2034 |
| Segmentation |
|
Table of Contents
- 1. Introduction
- 1.1. Research Scope
- 1.2. Market Segmentation
- 1.3. Research Methodology
- 1.4. Definitions and Assumptions
- 2. Executive Summary
- 2.1. Introduction
- 3. Market Dynamics
- 3.1. Introduction
- 3.2. Market Drivers
- 3.3. Market Restrains
- 3.4. Market Trends
- 4. Market Factor Analysis
- 4.1. Porters Five Forces
- 4.2. Supply/Value Chain
- 4.3. PESTEL analysis
- 4.4. Market Entropy
- 4.5. Patent/Trademark Analysis
- 5. Global Cleaning Mop Analysis, Insights and Forecast, 2020-2032
- 5.1. Market Analysis, Insights and Forecast - by Application
- 5.1.1. Residential
- 5.1.2. Commercial
- 5.1.3. Hospital
- 5.1.4. Industrial
- 5.1.5. Others
- 5.2. Market Analysis, Insights and Forecast - by Types
- 5.2.1. Cloth Mop
- 5.2.2. Sponge Mop
- 5.2.3. Others
- 5.3. Market Analysis, Insights and Forecast - by Region
- 5.3.1. North America
- 5.3.2. South America
- 5.3.3. Europe
- 5.3.4. Middle East & Africa
- 5.3.5. Asia Pacific
- 5.1. Market Analysis, Insights and Forecast - by Application
- 6. North America Cleaning Mop Analysis, Insights and Forecast, 2020-2032
- 6.1. Market Analysis, Insights and Forecast - by Application
- 6.1.1. Residential
- 6.1.2. Commercial
- 6.1.3. Hospital
- 6.1.4. Industrial
- 6.1.5. Others
- 6.2. Market Analysis, Insights and Forecast - by Types
- 6.2.1. Cloth Mop
- 6.2.2. Sponge Mop
- 6.2.3. Others
- 6.1. Market Analysis, Insights and Forecast - by Application
- 7. South America Cleaning Mop Analysis, Insights and Forecast, 2020-2032
- 7.1. Market Analysis, Insights and Forecast - by Application
- 7.1.1. Residential
- 7.1.2. Commercial
- 7.1.3. Hospital
- 7.1.4. Industrial
- 7.1.5. Others
- 7.2. Market Analysis, Insights and Forecast - by Types
- 7.2.1. Cloth Mop
- 7.2.2. Sponge Mop
- 7.2.3. Others
- 7.1. Market Analysis, Insights and Forecast - by Application
- 8. Europe Cleaning Mop Analysis, Insights and Forecast, 2020-2032
- 8.1. Market Analysis, Insights and Forecast - by Application
- 8.1.1. Residential
- 8.1.2. Commercial
- 8.1.3. Hospital
- 8.1.4. Industrial
- 8.1.5. Others
- 8.2. Market Analysis, Insights and Forecast - by Types
- 8.2.1. Cloth Mop
- 8.2.2. Sponge Mop
- 8.2.3. Others
- 8.1. Market Analysis, Insights and Forecast - by Application
- 9. Middle East & Africa Cleaning Mop Analysis, Insights and Forecast, 2020-2032
- 9.1. Market Analysis, Insights and Forecast - by Application
- 9.1.1. Residential
- 9.1.2. Commercial
- 9.1.3. Hospital
- 9.1.4. Industrial
- 9.1.5. Others
- 9.2. Market Analysis, Insights and Forecast - by Types
- 9.2.1. Cloth Mop
- 9.2.2. Sponge Mop
- 9.2.3. Others
- 9.1. Market Analysis, Insights and Forecast - by Application
- 10. Asia Pacific Cleaning Mop Analysis, Insights and Forecast, 2020-2032
- 10.1. Market Analysis, Insights and Forecast - by Application
- 10.1.1. Residential
- 10.1.2. Commercial
- 10.1.3. Hospital
- 10.1.4. Industrial
- 10.1.5. Others
- 10.2. Market Analysis, Insights and Forecast - by Types
- 10.2.1. Cloth Mop
- 10.2.2. Sponge Mop
- 10.2.3. Others
- 10.1. Market Analysis, Insights and Forecast - by Application
- 11. Competitive Analysis
- 11.1. Global Market Share Analysis 2025
- 11.2. Company Profiles
- 11.2.1 Libman
- 11.2.1.1. Overview
- 11.2.1.2. Products
- 11.2.1.3. SWOT Analysis
- 11.2.1.4. Recent Developments
- 11.2.1.5. Financials (Based on Availability)
- 11.2.2 Freudenberg Gala
- 11.2.2.1. Overview
- 11.2.2.2. Products
- 11.2.2.3. SWOT Analysis
- 11.2.2.4. Recent Developments
- 11.2.2.5. Financials (Based on Availability)
- 11.2.3 Clorox
- 11.2.3.1. Overview
- 11.2.3.2. Products
- 11.2.3.3. SWOT Analysis
- 11.2.3.4. Recent Developments
- 11.2.3.5. Financials (Based on Availability)
- 11.2.4 PG
- 11.2.4.1. Overview
- 11.2.4.2. Products
- 11.2.4.3. SWOT Analysis
- 11.2.4.4. Recent Developments
- 11.2.4.5. Financials (Based on Availability)
- 11.2.5 Colgate
- 11.2.5.1. Overview
- 11.2.5.2. Products
- 11.2.5.3. SWOT Analysis
- 11.2.5.4. Recent Developments
- 11.2.5.5. Financials (Based on Availability)
- 11.2.6 Unilever
- 11.2.6.1. Overview
- 11.2.6.2. Products
- 11.2.6.3. SWOT Analysis
- 11.2.6.4. Recent Developments
- 11.2.6.5. Financials (Based on Availability)
- 11.2.7 Scotch Brite(3M)
- 11.2.7.1. Overview
- 11.2.7.2. Products
- 11.2.7.3. SWOT Analysis
- 11.2.7.4. Recent Developments
- 11.2.7.5. Financials (Based on Availability)
- 11.2.8 Zwipes
- 11.2.8.1. Overview
- 11.2.8.2. Products
- 11.2.8.3. SWOT Analysis
- 11.2.8.4. Recent Developments
- 11.2.8.5. Financials (Based on Availability)
- 11.2.9 ERC
- 11.2.9.1. Overview
- 11.2.9.2. Products
- 11.2.9.3. SWOT Analysis
- 11.2.9.4. Recent Developments
- 11.2.9.5. Financials (Based on Availability)
- 11.2.10 Eurow
- 11.2.10.1. Overview
- 11.2.10.2. Products
- 11.2.10.3. SWOT Analysis
- 11.2.10.4. Recent Developments
- 11.2.10.5. Financials (Based on Availability)
- 11.2.11 Atlas Graham
- 11.2.11.1. Overview
- 11.2.11.2. Products
- 11.2.11.3. SWOT Analysis
- 11.2.11.4. Recent Developments
- 11.2.11.5. Financials (Based on Availability)
- 11.2.12 Norwex
- 11.2.12.1. Overview
- 11.2.12.2. Products
- 11.2.12.3. SWOT Analysis
- 11.2.12.4. Recent Developments
- 11.2.12.5. Financials (Based on Availability)
- 11.2.13 Toray
- 11.2.13.1. Overview
- 11.2.13.2. Products
- 11.2.13.3. SWOT Analysis
- 11.2.13.4. Recent Developments
- 11.2.13.5. Financials (Based on Availability)
- 11.2.14 Partek
- 11.2.14.1. Overview
- 11.2.14.2. Products
- 11.2.14.3. SWOT Analysis
- 11.2.14.4. Recent Developments
- 11.2.14.5. Financials (Based on Availability)
- 11.2.1 Libman
List of Figures
- Figure 1: Global Cleaning Mop Revenue Breakdown (undefined, %) by Region 2025 & 2033
- Figure 2: Global Cleaning Mop Volume Breakdown (K, %) by Region 2025 & 2033
- Figure 3: North America Cleaning Mop Revenue (undefined), by Application 2025 & 2033
- Figure 4: North America Cleaning Mop Volume (K), by Application 2025 & 2033
- Figure 5: North America Cleaning Mop Revenue Share (%), by Application 2025 & 2033
- Figure 6: North America Cleaning Mop Volume Share (%), by Application 2025 & 2033
- Figure 7: North America Cleaning Mop Revenue (undefined), by Types 2025 & 2033
- Figure 8: North America Cleaning Mop Volume (K), by Types 2025 & 2033
- Figure 9: North America Cleaning Mop Revenue Share (%), by Types 2025 & 2033
- Figure 10: North America Cleaning Mop Volume Share (%), by Types 2025 & 2033
- Figure 11: North America Cleaning Mop Revenue (undefined), by Country 2025 & 2033
- Figure 12: North America Cleaning Mop Volume (K), by Country 2025 & 2033
- Figure 13: North America Cleaning Mop Revenue Share (%), by Country 2025 & 2033
- Figure 14: North America Cleaning Mop Volume Share (%), by Country 2025 & 2033
- Figure 15: South America Cleaning Mop Revenue (undefined), by Application 2025 & 2033
- Figure 16: South America Cleaning Mop Volume (K), by Application 2025 & 2033
- Figure 17: South America Cleaning Mop Revenue Share (%), by Application 2025 & 2033
- Figure 18: South America Cleaning Mop Volume Share (%), by Application 2025 & 2033
- Figure 19: South America Cleaning Mop Revenue (undefined), by Types 2025 & 2033
- Figure 20: South America Cleaning Mop Volume (K), by Types 2025 & 2033
- Figure 21: South America Cleaning Mop Revenue Share (%), by Types 2025 & 2033
- Figure 22: South America Cleaning Mop Volume Share (%), by Types 2025 & 2033
- Figure 23: South America Cleaning Mop Revenue (undefined), by Country 2025 & 2033
- Figure 24: South America Cleaning Mop Volume (K), by Country 2025 & 2033
- Figure 25: South America Cleaning Mop Revenue Share (%), by Country 2025 & 2033
- Figure 26: South America Cleaning Mop Volume Share (%), by Country 2025 & 2033
- Figure 27: Europe Cleaning Mop Revenue (undefined), by Application 2025 & 2033
- Figure 28: Europe Cleaning Mop Volume (K), by Application 2025 & 2033
- Figure 29: Europe Cleaning Mop Revenue Share (%), by Application 2025 & 2033
- Figure 30: Europe Cleaning Mop Volume Share (%), by Application 2025 & 2033
- Figure 31: Europe Cleaning Mop Revenue (undefined), by Types 2025 & 2033
- Figure 32: Europe Cleaning Mop Volume (K), by Types 2025 & 2033
- Figure 33: Europe Cleaning Mop Revenue Share (%), by Types 2025 & 2033
- Figure 34: Europe Cleaning Mop Volume Share (%), by Types 2025 & 2033
- Figure 35: Europe Cleaning Mop Revenue (undefined), by Country 2025 & 2033
- Figure 36: Europe Cleaning Mop Volume (K), by Country 2025 & 2033
- Figure 37: Europe Cleaning Mop Revenue Share (%), by Country 2025 & 2033
- Figure 38: Europe Cleaning Mop Volume Share (%), by Country 2025 & 2033
- Figure 39: Middle East & Africa Cleaning Mop Revenue (undefined), by Application 2025 & 2033
- Figure 40: Middle East & Africa Cleaning Mop Volume (K), by Application 2025 & 2033
- Figure 41: Middle East & Africa Cleaning Mop Revenue Share (%), by Application 2025 & 2033
- Figure 42: Middle East & Africa Cleaning Mop Volume Share (%), by Application 2025 & 2033
- Figure 43: Middle East & Africa Cleaning Mop Revenue (undefined), by Types 2025 & 2033
- Figure 44: Middle East & Africa Cleaning Mop Volume (K), by Types 2025 & 2033
- Figure 45: Middle East & Africa Cleaning Mop Revenue Share (%), by Types 2025 & 2033
- Figure 46: Middle East & Africa Cleaning Mop Volume Share (%), by Types 2025 & 2033
- Figure 47: Middle East & Africa Cleaning Mop Revenue (undefined), by Country 2025 & 2033
- Figure 48: Middle East & Africa Cleaning Mop Volume (K), by Country 2025 & 2033
- Figure 49: Middle East & Africa Cleaning Mop Revenue Share (%), by Country 2025 & 2033
- Figure 50: Middle East & Africa Cleaning Mop Volume Share (%), by Country 2025 & 2033
- Figure 51: Asia Pacific Cleaning Mop Revenue (undefined), by Application 2025 & 2033
- Figure 52: Asia Pacific Cleaning Mop Volume (K), by Application 2025 & 2033
- Figure 53: Asia Pacific Cleaning Mop Revenue Share (%), by Application 2025 & 2033
- Figure 54: Asia Pacific Cleaning Mop Volume Share (%), by Application 2025 & 2033
- Figure 55: Asia Pacific Cleaning Mop Revenue (undefined), by Types 2025 & 2033
- Figure 56: Asia Pacific Cleaning Mop Volume (K), by Types 2025 & 2033
- Figure 57: Asia Pacific Cleaning Mop Revenue Share (%), by Types 2025 & 2033
- Figure 58: Asia Pacific Cleaning Mop Volume Share (%), by Types 2025 & 2033
- Figure 59: Asia Pacific Cleaning Mop Revenue (undefined), by Country 2025 & 2033
- Figure 60: Asia Pacific Cleaning Mop Volume (K), by Country 2025 & 2033
- Figure 61: Asia Pacific Cleaning Mop Revenue Share (%), by Country 2025 & 2033
- Figure 62: Asia Pacific Cleaning Mop Volume Share (%), by Country 2025 & 2033
List of Tables
- Table 1: Global Cleaning Mop Revenue undefined Forecast, by Application 2020 & 2033
- Table 2: Global Cleaning Mop Volume K Forecast, by Application 2020 & 2033
- Table 3: Global Cleaning Mop Revenue undefined Forecast, by Types 2020 & 2033
- Table 4: Global Cleaning Mop Volume K Forecast, by Types 2020 & 2033
- Table 5: Global Cleaning Mop Revenue undefined Forecast, by Region 2020 & 2033
- Table 6: Global Cleaning Mop Volume K Forecast, by Region 2020 & 2033
- Table 7: Global Cleaning Mop Revenue undefined Forecast, by Application 2020 & 2033
- Table 8: Global Cleaning Mop Volume K Forecast, by Application 2020 & 2033
- Table 9: Global Cleaning Mop Revenue undefined Forecast, by Types 2020 & 2033
- Table 10: Global Cleaning Mop Volume K Forecast, by Types 2020 & 2033
- Table 11: Global Cleaning Mop Revenue undefined Forecast, by Country 2020 & 2033
- Table 12: Global Cleaning Mop Volume K Forecast, by Country 2020 & 2033
- Table 13: United States Cleaning Mop Revenue (undefined) Forecast, by Application 2020 & 2033
- Table 14: United States Cleaning Mop Volume (K) Forecast, by Application 2020 & 2033
- Table 15: Canada Cleaning Mop Revenue (undefined) Forecast, by Application 2020 & 2033
- Table 16: Canada Cleaning Mop Volume (K) Forecast, by Application 2020 & 2033
- Table 17: Mexico Cleaning Mop Revenue (undefined) Forecast, by Application 2020 & 2033
- Table 18: Mexico Cleaning Mop Volume (K) Forecast, by Application 2020 & 2033
- Table 19: Global Cleaning Mop Revenue undefined Forecast, by Application 2020 & 2033
- Table 20: Global Cleaning Mop Volume K Forecast, by Application 2020 & 2033
- Table 21: Global Cleaning Mop Revenue undefined Forecast, by Types 2020 & 2033
- Table 22: Global Cleaning Mop Volume K Forecast, by Types 2020 & 2033
- Table 23: Global Cleaning Mop Revenue undefined Forecast, by Country 2020 & 2033
- Table 24: Global Cleaning Mop Volume K Forecast, by Country 2020 & 2033
- Table 25: Brazil Cleaning Mop Revenue (undefined) Forecast, by Application 2020 & 2033
- Table 26: Brazil Cleaning Mop Volume (K) Forecast, by Application 2020 & 2033
- Table 27: Argentina Cleaning Mop Revenue (undefined) Forecast, by Application 2020 & 2033
- Table 28: Argentina Cleaning Mop Volume (K) Forecast, by Application 2020 & 2033
- Table 29: Rest of South America Cleaning Mop Revenue (undefined) Forecast, by Application 2020 & 2033
- Table 30: Rest of South America Cleaning Mop Volume (K) Forecast, by Application 2020 & 2033
- Table 31: Global Cleaning Mop Revenue undefined Forecast, by Application 2020 & 2033
- Table 32: Global Cleaning Mop Volume K Forecast, by Application 2020 & 2033
- Table 33: Global Cleaning Mop Revenue undefined Forecast, by Types 2020 & 2033
- Table 34: Global Cleaning Mop Volume K Forecast, by Types 2020 & 2033
- Table 35: Global Cleaning Mop Revenue undefined Forecast, by Country 2020 & 2033
- Table 36: Global Cleaning Mop Volume K Forecast, by Country 2020 & 2033
- Table 37: United Kingdom Cleaning Mop Revenue (undefined) Forecast, by Application 2020 & 2033
- Table 38: United Kingdom Cleaning Mop Volume (K) Forecast, by Application 2020 & 2033
- Table 39: Germany Cleaning Mop Revenue (undefined) Forecast, by Application 2020 & 2033
- Table 40: Germany Cleaning Mop Volume (K) Forecast, by Application 2020 & 2033
- Table 41: France Cleaning Mop Revenue (undefined) Forecast, by Application 2020 & 2033
- Table 42: France Cleaning Mop Volume (K) Forecast, by Application 2020 & 2033
- Table 43: Italy Cleaning Mop Revenue (undefined) Forecast, by Application 2020 & 2033
- Table 44: Italy Cleaning Mop Volume (K) Forecast, by Application 2020 & 2033
- Table 45: Spain Cleaning Mop Revenue (undefined) Forecast, by Application 2020 & 2033
- Table 46: Spain Cleaning Mop Volume (K) Forecast, by Application 2020 & 2033
- Table 47: Russia Cleaning Mop Revenue (undefined) Forecast, by Application 2020 & 2033
- Table 48: Russia Cleaning Mop Volume (K) Forecast, by Application 2020 & 2033
- Table 49: Benelux Cleaning Mop Revenue (undefined) Forecast, by Application 2020 & 2033
- Table 50: Benelux Cleaning Mop Volume (K) Forecast, by Application 2020 & 2033
- Table 51: Nordics Cleaning Mop Revenue (undefined) Forecast, by Application 2020 & 2033
- Table 52: Nordics Cleaning Mop Volume (K) Forecast, by Application 2020 & 2033
- Table 53: Rest of Europe Cleaning Mop Revenue (undefined) Forecast, by Application 2020 & 2033
- Table 54: Rest of Europe Cleaning Mop Volume (K) Forecast, by Application 2020 & 2033
- Table 55: Global Cleaning Mop Revenue undefined Forecast, by Application 2020 & 2033
- Table 56: Global Cleaning Mop Volume K Forecast, by Application 2020 & 2033
- Table 57: Global Cleaning Mop Revenue undefined Forecast, by Types 2020 & 2033
- Table 58: Global Cleaning Mop Volume K Forecast, by Types 2020 & 2033
- Table 59: Global Cleaning Mop Revenue undefined Forecast, by Country 2020 & 2033
- Table 60: Global Cleaning Mop Volume K Forecast, by Country 2020 & 2033
- Table 61: Turkey Cleaning Mop Revenue (undefined) Forecast, by Application 2020 & 2033
- Table 62: Turkey Cleaning Mop Volume (K) Forecast, by Application 2020 & 2033
- Table 63: Israel Cleaning Mop Revenue (undefined) Forecast, by Application 2020 & 2033
- Table 64: Israel Cleaning Mop Volume (K) Forecast, by Application 2020 & 2033
- Table 65: GCC Cleaning Mop Revenue (undefined) Forecast, by Application 2020 & 2033
- Table 66: GCC Cleaning Mop Volume (K) Forecast, by Application 2020 & 2033
- Table 67: North Africa Cleaning Mop Revenue (undefined) Forecast, by Application 2020 & 2033
- Table 68: North Africa Cleaning Mop Volume (K) Forecast, by Application 2020 & 2033
- Table 69: South Africa Cleaning Mop Revenue (undefined) Forecast, by Application 2020 & 2033
- Table 70: South Africa Cleaning Mop Volume (K) Forecast, by Application 2020 & 2033
- Table 71: Rest of Middle East & Africa Cleaning Mop Revenue (undefined) Forecast, by Application 2020 & 2033
- Table 72: Rest of Middle East & Africa Cleaning Mop Volume (K) Forecast, by Application 2020 & 2033
- Table 73: Global Cleaning Mop Revenue undefined Forecast, by Application 2020 & 2033
- Table 74: Global Cleaning Mop Volume K Forecast, by Application 2020 & 2033
- Table 75: Global Cleaning Mop Revenue undefined Forecast, by Types 2020 & 2033
- Table 76: Global Cleaning Mop Volume K Forecast, by Types 2020 & 2033
- Table 77: Global Cleaning Mop Revenue undefined Forecast, by Country 2020 & 2033
- Table 78: Global Cleaning Mop Volume K Forecast, by Country 2020 & 2033
- Table 79: China Cleaning Mop Revenue (undefined) Forecast, by Application 2020 & 2033
- Table 80: China Cleaning Mop Volume (K) Forecast, by Application 2020 & 2033
- Table 81: India Cleaning Mop Revenue (undefined) Forecast, by Application 2020 & 2033
- Table 82: India Cleaning Mop Volume (K) Forecast, by Application 2020 & 2033
- Table 83: Japan Cleaning Mop Revenue (undefined) Forecast, by Application 2020 & 2033
- Table 84: Japan Cleaning Mop Volume (K) Forecast, by Application 2020 & 2033
- Table 85: South Korea Cleaning Mop Revenue (undefined) Forecast, by Application 2020 & 2033
- Table 86: South Korea Cleaning Mop Volume (K) Forecast, by Application 2020 & 2033
- Table 87: ASEAN Cleaning Mop Revenue (undefined) Forecast, by Application 2020 & 2033
- Table 88: ASEAN Cleaning Mop Volume (K) Forecast, by Application 2020 & 2033
- Table 89: Oceania Cleaning Mop Revenue (undefined) Forecast, by Application 2020 & 2033
- Table 90: Oceania Cleaning Mop Volume (K) Forecast, by Application 2020 & 2033
- Table 91: Rest of Asia Pacific Cleaning Mop Revenue (undefined) Forecast, by Application 2020 & 2033
- Table 92: Rest of Asia Pacific Cleaning Mop Volume (K) Forecast, by Application 2020 & 2033
Frequently Asked Questions
1. What is the projected Compound Annual Growth Rate (CAGR) of the Cleaning Mop?
The projected CAGR is approximately 14.34%.
2. Which companies are prominent players in the Cleaning Mop?
Key companies in the market include Libman, Freudenberg Gala, Clorox, PG, Colgate, Unilever, Scotch Brite(3M), Zwipes, ERC, Eurow, Atlas Graham, Norwex, Toray, Partek.
3. What are the main segments of the Cleaning Mop?
The market segments include Application, Types.
4. Can you provide details about the market size?
The market size is estimated to be USD XXX N/A as of 2022.
5. What are some drivers contributing to market growth?
N/A
6. What are the notable trends driving market growth?
N/A
7. Are there any restraints impacting market growth?
N/A
8. Can you provide examples of recent developments in the market?
N/A
9. What pricing options are available for accessing the report?
Pricing options include single-user, multi-user, and enterprise licenses priced at USD 3950.00, USD 5925.00, and USD 7900.00 respectively.
10. Is the market size provided in terms of value or volume?
The market size is provided in terms of value, measured in N/A and volume, measured in K.
11. Are there any specific market keywords associated with the report?
Yes, the market keyword associated with the report is "Cleaning Mop," which aids in identifying and referencing the specific market segment covered.
12. How do I determine which pricing option suits my needs best?
The pricing options vary based on user requirements and access needs. Individual users may opt for single-user licenses, while businesses requiring broader access may choose multi-user or enterprise licenses for cost-effective access to the report.
13. Are there any additional resources or data provided in the Cleaning Mop report?
While the report offers comprehensive insights, it's advisable to review the specific contents or supplementary materials provided to ascertain if additional resources or data are available.
14. How can I stay updated on further developments or reports in the Cleaning Mop?
To stay informed about further developments, trends, and reports in the Cleaning Mop, consider subscribing to industry newsletters, following relevant companies and organizations, or regularly checking reputable industry news sources and publications.
Methodology
Step 1 - Identification of Relevant Samples Size from Population Database


Step 2 - Approaches for Defining Global Market Size (Value, Volume* & Price*)

Note*: In applicable scenarios
Step 3 - Data Sources
Primary Research
- Web Analytics
- Survey Reports
- Research Institute
- Latest Research Reports
- Opinion Leaders
Secondary Research
- Annual Reports
- White Paper
- Latest Press Release
- Industry Association
- Paid Database
- Investor Presentations

Step 4 - Data Triangulation
Involves using different sources of information in order to increase the validity of a study
These sources are likely to be stakeholders in a program - participants, other researchers, program staff, other community members, and so on.
Then we put all data in single framework & apply various statistical tools to find out the dynamic on the market.
During the analysis stage, feedback from the stakeholder groups would be compared to determine areas of agreement as well as areas of divergence