

Key Insights
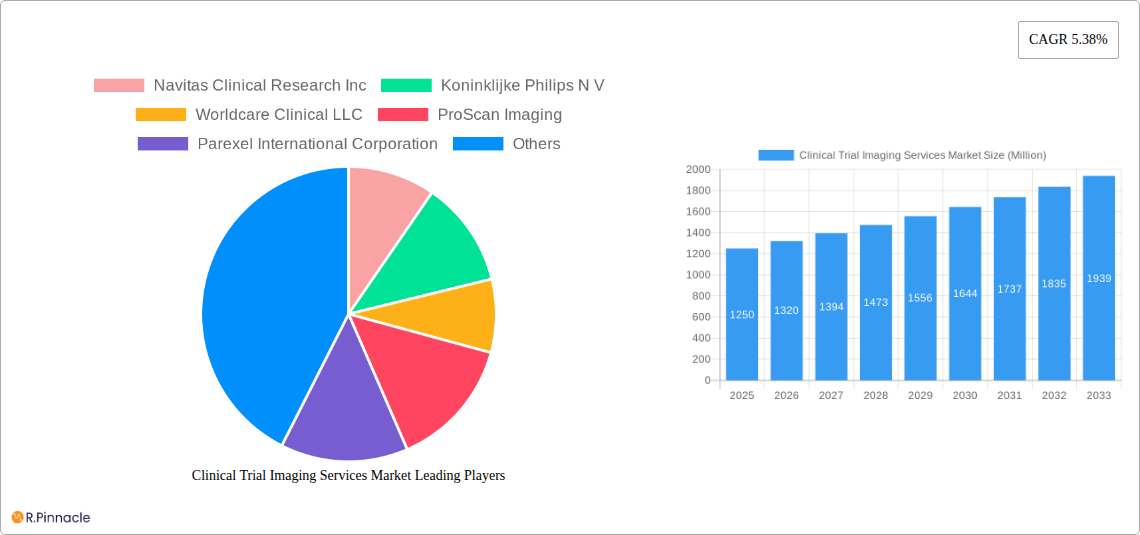
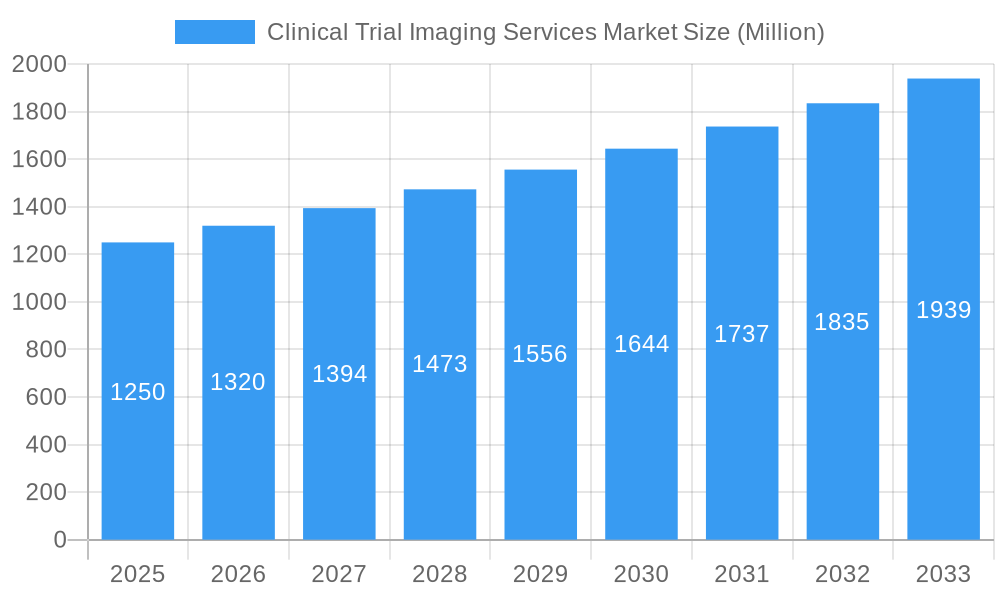
The Clinical Trial Imaging Services market, valued at $1.25 billion in 2025, is projected to experience robust growth, driven by the increasing adoption of imaging technologies in clinical trials across various therapeutic areas. The compound annual growth rate (CAGR) of 5.38% from 2025 to 2033 indicates a significant expansion of this market over the forecast period. Key drivers include the rising prevalence of chronic diseases necessitating advanced diagnostic tools, the growing demand for faster and more efficient clinical trial processes, and the increasing regulatory approvals for innovative imaging modalities. The market is segmented by product and service (Trial Design Consulting Services, Read Analysis Services, Operational Imaging Services, Imaging Software), modality (MRI, CT, Ultrasound, PET, X-Ray, Echocardiography), and end-user (Pharmaceutical & Biotechnology Companies, Medical Device Manufacturers, Academic and Government Research Institutes). North America currently holds a significant market share due to advanced healthcare infrastructure and high adoption rates of new technologies. However, Asia Pacific is expected to witness substantial growth driven by increasing healthcare expenditure and rising awareness regarding advanced diagnostic techniques. The market faces some restraints, including high costs associated with advanced imaging technologies and the need for skilled professionals to operate and interpret the data. Nevertheless, ongoing technological advancements, particularly in AI-driven image analysis and remote image reading capabilities, are poised to overcome these challenges and fuel further market expansion.
Clinical Trial Imaging Services Market Market Size (In Billion)
The competitive landscape comprises a mix of established players like Koninklijke Philips N.V. and Parexel International Corporation, along with specialized clinical research organizations (CROs) and smaller technology providers. The strategic collaborations and mergers & acquisitions observed in recent years suggest a consolidating market, emphasizing the importance of technological innovation and strong regulatory compliance. Future market growth will likely depend on the adoption of innovative imaging techniques, efficient data management solutions, and the integration of AI and machine learning algorithms for enhanced analysis and interpretation of imaging data, ultimately leading to faster and more reliable clinical trial outcomes. Further growth will be influenced by factors such as expanding clinical trial activities globally and the continued development of new therapies across various disease areas.
Clinical Trial Imaging Services Market Company Market Share
Clinical Trial Imaging Services Market Report: 2019-2033
This comprehensive report provides an in-depth analysis of the Clinical Trial Imaging Services market, offering invaluable insights for industry professionals, investors, and researchers. Covering the period 2019-2033, with a focus on 2025, this report meticulously examines market dynamics, segmentation, key players, and future trends. The market is projected to reach xx Million by 2033, exhibiting a CAGR of xx% during the forecast period (2025-2033).
Clinical Trial Imaging Services Market Market Structure & Innovation Trends
The Clinical Trial Imaging Services market exhibits a moderately concentrated structure, with key players like Koninklijke Philips N V, Parexel International Corporation, and Icon PLC holding significant market share. However, the market also accommodates several smaller, specialized firms. Market share fluctuations are influenced by factors including technological advancements, regulatory changes, and M&A activities. The total market value in 2024 was estimated at xx Million.
- Market Concentration: Moderately concentrated, with top 5 players holding approximately xx% market share in 2024.
- Innovation Drivers: Advancements in imaging technologies (e.g., AI-powered image analysis), increasing demand for faster and more efficient clinical trials, and the rising prevalence of chronic diseases.
- Regulatory Framework: Stringent regulatory requirements regarding data privacy, image quality, and clinical trial protocols significantly impact market dynamics. Compliance costs represent a substantial operational expenditure.
- Product Substitutes: Limited direct substitutes exist; however, cost-effective alternatives for specific imaging modalities might influence market share.
- End-User Demographics: Primarily pharmaceutical & biotechnology companies, followed by medical device manufacturers and academic/government research institutes.
- M&A Activities: Several significant M&A transactions have been observed in recent years, driven by the desire to expand service offerings and geographical reach. The total value of M&A deals in the last 5 years was approximately xx Million.
Clinical Trial Imaging Services Market Market Dynamics & Trends
The Clinical Trial Imaging Services market is experiencing robust growth, fueled by several key factors. The increasing prevalence of chronic diseases necessitates more extensive clinical trials, driving demand for imaging services. Technological advancements, particularly in AI-powered image analysis and faster acquisition techniques, enhance efficiency and reduce costs. Furthermore, the growing adoption of advanced imaging modalities, like PET/CT scans, and the expanding use of imaging in personalized medicine contribute to market expansion. The market’s competitive landscape is characterized by intense rivalry among established players and the emergence of innovative startups. This competition fosters continuous innovation and drives down prices, benefitting end-users.
The market penetration of AI-powered image analysis is steadily increasing, projected to reach xx% by 2033. This technology significantly improves diagnostic accuracy and reduces the workload on radiologists. Consumer preferences are shifting towards providers offering comprehensive services, integrating various imaging modalities, and providing faster turnaround times. The overall market exhibits a robust growth trajectory, with the CAGR expected to remain above xx% throughout the forecast period.
Dominant Regions & Segments in Clinical Trial Imaging Services Market
Leading Region: North America dominates the market due to its strong pharmaceutical and biotechnology industry, high healthcare expenditure, and advanced healthcare infrastructure. Europe follows as a significant market.
Dominant Segments:
- Product & Service: Operational Imaging Services currently holds the largest market share, followed by Read Analysis Services and Trial Design Consulting Services. Imaging Software is witnessing the fastest growth.
- Modality: Magnetic Resonance Imaging (MRI) commands the largest segment due to its versatility and high diagnostic capabilities. Computed Tomography (CT) and Ultrasound are also significant segments.
- End-User: Pharmaceutical & Biotechnology Companies constitute the largest end-user segment, followed by Medical Device Manufacturers.
Key Drivers (by Region):
- North America: Strong regulatory frameworks, high research and development spending, and advanced technological infrastructure.
- Europe: Government initiatives promoting healthcare innovation and growing adoption of advanced imaging techniques.
- Asia-Pacific: Increasing healthcare expenditure, expanding pharmaceutical industry, and a large patient pool.
Detailed Dominance Analysis: North America’s dominance stems from the concentration of major pharmaceutical companies, sophisticated healthcare infrastructure, and robust regulatory support for clinical trials. Europe’s strong position is supported by a well-established healthcare system and increasing adoption of advanced technologies. The Asia-Pacific region showcases high growth potential, driven by rising disposable incomes, growing healthcare awareness, and increasing government investments in healthcare infrastructure.
Clinical Trial Imaging Services Market Product Innovations
Recent innovations focus on integrating AI and machine learning into image analysis to enhance diagnostic accuracy and efficiency. New imaging modalities and advanced software tools are also emerging, improving image quality and reducing examination times. The market is witnessing a rise in cloud-based platforms for image storage and sharing, facilitating collaboration among researchers and clinicians globally. These innovations improve the overall efficiency and reduce costs associated with clinical trials.
Report Scope & Segmentation Analysis
This report comprehensively segments the Clinical Trial Imaging Services market based on product and service (Trial Design Consulting Services, Read Analysis Services, Operational Imaging Services, Imaging Software), modality (Magnetic Resonance Imaging, Computed Tomography, Ultrasound, Positron Emission Tomography, X-Ray, Echocardiography, Other Modalities), and end-user (Pharmaceutical & Biotechnology Companies, Medical Device Manufacturers, Academic and Government Research Institutes). Each segment's market size, growth projections, and competitive dynamics are thoroughly analyzed, providing a granular understanding of the market landscape.
Key Drivers of Clinical Trial Imaging Services Market Growth
The market's growth is primarily driven by the increasing prevalence of chronic diseases, the rising demand for faster and more efficient clinical trials, technological advancements in imaging technologies (e.g., AI-powered image analysis), and the growing adoption of advanced imaging modalities. Regulatory support for clinical trials and increasing healthcare expenditure also contribute significantly to market expansion.
Challenges in the Clinical Trial Imaging Services Market Sector
Challenges include stringent regulatory requirements, high infrastructure costs, data privacy concerns, and the need for skilled professionals. Competition from established players and the rising costs of advanced imaging equipment also pose significant challenges. These factors impact market growth and profitability.
Emerging Opportunities in Clinical Trial Imaging Services Market
Emerging opportunities include the expansion of tele-radiology services, the integration of AI and machine learning into image analysis, and the development of new imaging modalities with improved diagnostic capabilities. Growing demand for personalized medicine and the expansion of clinical trials into emerging markets create significant opportunities for market growth.
Leading Players in the Clinical Trial Imaging Services Market Market
- Navitas Clinical Research Inc
- Koninklijke Philips N V
- Worldcare Clinical LLC
- ProScan Imaging
- Parexel International Corporation
- Radiant Sage LLC
- WIRB-Copernicus Group
- Ixico PLC
- Clario
- Resonance Health
- Medpace
- Icon PLC
Key Developments in Clinical Trial Imaging Services Market Industry
- May 2022: Bruker launched innovative 7 Tesla and 9.4 Tesla conduction-cooled Maxwell magnets for its preclinical MRI systems, enhancing research capabilities.
- March 2022: Fujifilm India unveiled a new range of CT, MRI, and ultrasound machines, expanding its product portfolio and market reach.
Future Outlook for Clinical Trial Imaging Services Market Market
The Clinical Trial Imaging Services market is poised for continued growth, driven by technological advancements, expanding clinical trial activities, and rising healthcare expenditure. Strategic partnerships, acquisitions, and the development of innovative imaging solutions will play a crucial role in shaping the market's future trajectory. The market holds significant potential for expansion in emerging economies and through the adoption of personalized medicine approaches.
Clinical Trial Imaging Services Market Segmentation
-
1. Product and Service
- 1.1. Trial Design Consulting Services
- 1.2. Read Analysis Services
- 1.3. Operational Imaging Services
- 1.4. Imaging Software
-
2. Modality
- 2.1. Magnetic Resonance Imaging
- 2.2. Computed Tomography
- 2.3. Ultrasound
- 2.4. Positron Emission Tomography
- 2.5. X-Ray
- 2.6. Echocardiography
- 2.7. Other Modalities
-
3. End-User
- 3.1. Pharmaceutical & Biotechnology Companies
- 3.2. Medical Device Manufacturers
- 3.3. Academic and Government Research Institutes
Clinical Trial Imaging Services Market Segmentation By Geography
-
1. North America
- 1.1. United States
- 1.2. Canada
- 1.3. Mexico
-
2. Europe
- 2.1. Germany
- 2.2. United Kingdom
- 2.3. France
- 2.4. Italy
- 2.5. Spain
- 2.6. Rest of Europe
-
3. Asia Pacific
- 3.1. China
- 3.2. Japan
- 3.3. India
- 3.4. Australia
- 3.5. South Korea
- 3.6. Rest of Asia Pacific
-
4. Middle East and Africa
- 4.1. GCC
- 4.2. South Africa
- 4.3. Rest of Middle East and Africa
-
5. South America
- 5.1. Brazil
- 5.2. Argentina
- 5.3. Rest of South America
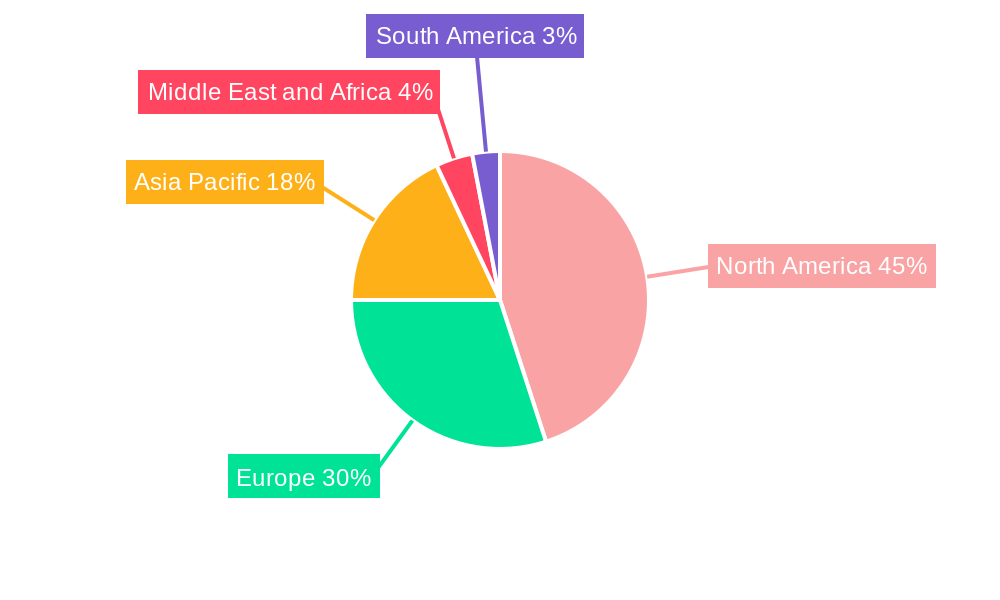
Clinical Trial Imaging Services Market Regional Market Share
Geographic Coverage of Clinical Trial Imaging Services Market
Clinical Trial Imaging Services Market REPORT HIGHLIGHTS
| Aspects | Details |
|---|---|
| Study Period | 2020-2034 |
| Base Year | 2025 |
| Estimated Year | 2026 |
| Forecast Period | 2026-2034 |
| Historical Period | 2020-2025 |
| Growth Rate | CAGR of 5.38% from 2020-2034 |
| Segmentation |
|
Table of Contents
- 1. Introduction
- 1.1. Research Scope
- 1.2. Market Segmentation
- 1.3. Research Objective
- 1.4. Definitions and Assumptions
- 2. Executive Summary
- 2.1. Market Snapshot
- 3. Market Dynamics
- 3.1. Market Drivers
- 3.2. Market Restrains
- 3.3. Market Trends
- 3.4. Market Opportunities
- 4. Market Factor Analysis
- 4.1. Porters Five Forces
- 4.1.1. Bargaining Power of Suppliers
- 4.1.2. Bargaining Power of Buyers
- 4.1.3. Threat of New Entrants
- 4.1.4. Threat of Substitutes
- 4.1.5. Competitive Rivalry
- 4.2. PESTEL analysis
- 4.3. BCG Analysis
- 4.3.1. Stars (High Growth, High Market Share)
- 4.3.2. Cash Cows (Low Growth, High Market Share)
- 4.3.3. Question Mark (High Growth, Low Market Share)
- 4.3.4. Dogs (Low Growth, Low Market Share)
- 4.4. Ansoff Matrix Analysis
- 4.5. Supply Chain Analysis
- 4.6. Regulatory Landscape
- 4.7. Current Market Potential and Opportunity Assessment (TAM–SAM–SOM Framework)
- 4.8. PRI Analyst Note
- 4.1. Porters Five Forces
- 5. Market Analysis, Insights and Forecast 2021-2033
- 5.1. Market Analysis, Insights and Forecast - by Product and Service
- 5.1.1. Trial Design Consulting Services
- 5.1.2. Read Analysis Services
- 5.1.3. Operational Imaging Services
- 5.1.4. Imaging Software
- 5.2. Market Analysis, Insights and Forecast - by Modality
- 5.2.1. Magnetic Resonance Imaging
- 5.2.2. Computed Tomography
- 5.2.3. Ultrasound
- 5.2.4. Positron Emission Tomography
- 5.2.5. X-Ray
- 5.2.6. Echocardiography
- 5.2.7. Other Modalities
- 5.3. Market Analysis, Insights and Forecast - by End-User
- 5.3.1. Pharmaceutical & Biotechnology Companies
- 5.3.2. Medical Device Manufacturers
- 5.3.3. Academic and Government Research Institutes
- 5.4. Market Analysis, Insights and Forecast - by Region
- 5.4.1. North America
- 5.4.2. Europe
- 5.4.3. Asia Pacific
- 5.4.4. Middle East and Africa
- 5.4.5. South America
- 5.1. Market Analysis, Insights and Forecast - by Product and Service
- 6. Global Clinical Trial Imaging Services Market Analysis, Insights and Forecast, 2021-2033
- 6.1. Market Analysis, Insights and Forecast - by Product and Service
- 6.1.1. Trial Design Consulting Services
- 6.1.2. Read Analysis Services
- 6.1.3. Operational Imaging Services
- 6.1.4. Imaging Software
- 6.2. Market Analysis, Insights and Forecast - by Modality
- 6.2.1. Magnetic Resonance Imaging
- 6.2.2. Computed Tomography
- 6.2.3. Ultrasound
- 6.2.4. Positron Emission Tomography
- 6.2.5. X-Ray
- 6.2.6. Echocardiography
- 6.2.7. Other Modalities
- 6.3. Market Analysis, Insights and Forecast - by End-User
- 6.3.1. Pharmaceutical & Biotechnology Companies
- 6.3.2. Medical Device Manufacturers
- 6.3.3. Academic and Government Research Institutes
- 6.1. Market Analysis, Insights and Forecast - by Product and Service
- 7. North America Clinical Trial Imaging Services Market Analysis, Insights and Forecast, 2020-2032
- 7.1. Market Analysis, Insights and Forecast - by Product and Service
- 7.1.1. Trial Design Consulting Services
- 7.1.2. Read Analysis Services
- 7.1.3. Operational Imaging Services
- 7.1.4. Imaging Software
- 7.2. Market Analysis, Insights and Forecast - by Modality
- 7.2.1. Magnetic Resonance Imaging
- 7.2.2. Computed Tomography
- 7.2.3. Ultrasound
- 7.2.4. Positron Emission Tomography
- 7.2.5. X-Ray
- 7.2.6. Echocardiography
- 7.2.7. Other Modalities
- 7.3. Market Analysis, Insights and Forecast - by End-User
- 7.3.1. Pharmaceutical & Biotechnology Companies
- 7.3.2. Medical Device Manufacturers
- 7.3.3. Academic and Government Research Institutes
- 7.1. Market Analysis, Insights and Forecast - by Product and Service
- 8. Europe Clinical Trial Imaging Services Market Analysis, Insights and Forecast, 2020-2032
- 8.1. Market Analysis, Insights and Forecast - by Product and Service
- 8.1.1. Trial Design Consulting Services
- 8.1.2. Read Analysis Services
- 8.1.3. Operational Imaging Services
- 8.1.4. Imaging Software
- 8.2. Market Analysis, Insights and Forecast - by Modality
- 8.2.1. Magnetic Resonance Imaging
- 8.2.2. Computed Tomography
- 8.2.3. Ultrasound
- 8.2.4. Positron Emission Tomography
- 8.2.5. X-Ray
- 8.2.6. Echocardiography
- 8.2.7. Other Modalities
- 8.3. Market Analysis, Insights and Forecast - by End-User
- 8.3.1. Pharmaceutical & Biotechnology Companies
- 8.3.2. Medical Device Manufacturers
- 8.3.3. Academic and Government Research Institutes
- 8.1. Market Analysis, Insights and Forecast - by Product and Service
- 9. Asia Pacific Clinical Trial Imaging Services Market Analysis, Insights and Forecast, 2020-2032
- 9.1. Market Analysis, Insights and Forecast - by Product and Service
- 9.1.1. Trial Design Consulting Services
- 9.1.2. Read Analysis Services
- 9.1.3. Operational Imaging Services
- 9.1.4. Imaging Software
- 9.2. Market Analysis, Insights and Forecast - by Modality
- 9.2.1. Magnetic Resonance Imaging
- 9.2.2. Computed Tomography
- 9.2.3. Ultrasound
- 9.2.4. Positron Emission Tomography
- 9.2.5. X-Ray
- 9.2.6. Echocardiography
- 9.2.7. Other Modalities
- 9.3. Market Analysis, Insights and Forecast - by End-User
- 9.3.1. Pharmaceutical & Biotechnology Companies
- 9.3.2. Medical Device Manufacturers
- 9.3.3. Academic and Government Research Institutes
- 9.1. Market Analysis, Insights and Forecast - by Product and Service
- 10. Middle East and Africa Clinical Trial Imaging Services Market Analysis, Insights and Forecast, 2020-2032
- 10.1. Market Analysis, Insights and Forecast - by Product and Service
- 10.1.1. Trial Design Consulting Services
- 10.1.2. Read Analysis Services
- 10.1.3. Operational Imaging Services
- 10.1.4. Imaging Software
- 10.2. Market Analysis, Insights and Forecast - by Modality
- 10.2.1. Magnetic Resonance Imaging
- 10.2.2. Computed Tomography
- 10.2.3. Ultrasound
- 10.2.4. Positron Emission Tomography
- 10.2.5. X-Ray
- 10.2.6. Echocardiography
- 10.2.7. Other Modalities
- 10.3. Market Analysis, Insights and Forecast - by End-User
- 10.3.1. Pharmaceutical & Biotechnology Companies
- 10.3.2. Medical Device Manufacturers
- 10.3.3. Academic and Government Research Institutes
- 10.1. Market Analysis, Insights and Forecast - by Product and Service
- 11. South America Clinical Trial Imaging Services Market Analysis, Insights and Forecast, 2020-2032
- 11.1. Market Analysis, Insights and Forecast - by Product and Service
- 11.1.1. Trial Design Consulting Services
- 11.1.2. Read Analysis Services
- 11.1.3. Operational Imaging Services
- 11.1.4. Imaging Software
- 11.2. Market Analysis, Insights and Forecast - by Modality
- 11.2.1. Magnetic Resonance Imaging
- 11.2.2. Computed Tomography
- 11.2.3. Ultrasound
- 11.2.4. Positron Emission Tomography
- 11.2.5. X-Ray
- 11.2.6. Echocardiography
- 11.2.7. Other Modalities
- 11.3. Market Analysis, Insights and Forecast - by End-User
- 11.3.1. Pharmaceutical & Biotechnology Companies
- 11.3.2. Medical Device Manufacturers
- 11.3.3. Academic and Government Research Institutes
- 11.1. Market Analysis, Insights and Forecast - by Product and Service
- 12. Competitive Analysis
- 12.1. Company Profiles
- 12.1.1 Navitas Clinical Research Inc
- 12.1.1.1. Company Overview
- 12.1.1.2. Products
- 12.1.1.3. Company Financials
- 12.1.1.4. SWOT Analysis
- 12.1.2 Koninklijke Philips N V
- 12.1.2.1. Company Overview
- 12.1.2.2. Products
- 12.1.2.3. Company Financials
- 12.1.2.4. SWOT Analysis
- 12.1.3 Worldcare Clinical LLC
- 12.1.3.1. Company Overview
- 12.1.3.2. Products
- 12.1.3.3. Company Financials
- 12.1.3.4. SWOT Analysis
- 12.1.4 ProScan Imaging
- 12.1.4.1. Company Overview
- 12.1.4.2. Products
- 12.1.4.3. Company Financials
- 12.1.4.4. SWOT Analysis
- 12.1.5 Parexel International Corporation
- 12.1.5.1. Company Overview
- 12.1.5.2. Products
- 12.1.5.3. Company Financials
- 12.1.5.4. SWOT Analysis
- 12.1.6 Radiant Sage LLC
- 12.1.6.1. Company Overview
- 12.1.6.2. Products
- 12.1.6.3. Company Financials
- 12.1.6.4. SWOT Analysis
- 12.1.7 WIRB-Copernicus Group
- 12.1.7.1. Company Overview
- 12.1.7.2. Products
- 12.1.7.3. Company Financials
- 12.1.7.4. SWOT Analysis
- 12.1.8 Ixico PLC
- 12.1.8.1. Company Overview
- 12.1.8.2. Products
- 12.1.8.3. Company Financials
- 12.1.8.4. SWOT Analysis
- 12.1.9 Clario
- 12.1.9.1. Company Overview
- 12.1.9.2. Products
- 12.1.9.3. Company Financials
- 12.1.9.4. SWOT Analysis
- 12.1.10 Resonance Health
- 12.1.10.1. Company Overview
- 12.1.10.2. Products
- 12.1.10.3. Company Financials
- 12.1.10.4. SWOT Analysis
- 12.1.11 Medpace
- 12.1.11.1. Company Overview
- 12.1.11.2. Products
- 12.1.11.3. Company Financials
- 12.1.11.4. SWOT Analysis
- 12.1.12 Icon PLC
- 12.1.12.1. Company Overview
- 12.1.12.2. Products
- 12.1.12.3. Company Financials
- 12.1.12.4. SWOT Analysis
- 12.1.1 Navitas Clinical Research Inc
- 12.2. Market Entropy
- 12.2.1 Company's Key Areas Served
- 12.2.2 Recent Developments
- 12.3. Company Market Share Analysis 2025
- 12.3.1 Top 5 Companies Market Share Analysis
- 12.3.2 Top 3 Companies Market Share Analysis
- 12.4. List of Potential Customers
- 13. Research Methodology
List of Figures
- Figure 1: Global Clinical Trial Imaging Services Market Revenue Breakdown (Million, %) by Region 2025 & 2033
- Figure 2: North America Clinical Trial Imaging Services Market Revenue (Million), by Product and Service 2025 & 2033
- Figure 3: North America Clinical Trial Imaging Services Market Revenue Share (%), by Product and Service 2025 & 2033
- Figure 4: North America Clinical Trial Imaging Services Market Revenue (Million), by Modality 2025 & 2033
- Figure 5: North America Clinical Trial Imaging Services Market Revenue Share (%), by Modality 2025 & 2033
- Figure 6: North America Clinical Trial Imaging Services Market Revenue (Million), by End-User 2025 & 2033
- Figure 7: North America Clinical Trial Imaging Services Market Revenue Share (%), by End-User 2025 & 2033
- Figure 8: North America Clinical Trial Imaging Services Market Revenue (Million), by Country 2025 & 2033
- Figure 9: North America Clinical Trial Imaging Services Market Revenue Share (%), by Country 2025 & 2033
- Figure 10: Europe Clinical Trial Imaging Services Market Revenue (Million), by Product and Service 2025 & 2033
- Figure 11: Europe Clinical Trial Imaging Services Market Revenue Share (%), by Product and Service 2025 & 2033
- Figure 12: Europe Clinical Trial Imaging Services Market Revenue (Million), by Modality 2025 & 2033
- Figure 13: Europe Clinical Trial Imaging Services Market Revenue Share (%), by Modality 2025 & 2033
- Figure 14: Europe Clinical Trial Imaging Services Market Revenue (Million), by End-User 2025 & 2033
- Figure 15: Europe Clinical Trial Imaging Services Market Revenue Share (%), by End-User 2025 & 2033
- Figure 16: Europe Clinical Trial Imaging Services Market Revenue (Million), by Country 2025 & 2033
- Figure 17: Europe Clinical Trial Imaging Services Market Revenue Share (%), by Country 2025 & 2033
- Figure 18: Asia Pacific Clinical Trial Imaging Services Market Revenue (Million), by Product and Service 2025 & 2033
- Figure 19: Asia Pacific Clinical Trial Imaging Services Market Revenue Share (%), by Product and Service 2025 & 2033
- Figure 20: Asia Pacific Clinical Trial Imaging Services Market Revenue (Million), by Modality 2025 & 2033
- Figure 21: Asia Pacific Clinical Trial Imaging Services Market Revenue Share (%), by Modality 2025 & 2033
- Figure 22: Asia Pacific Clinical Trial Imaging Services Market Revenue (Million), by End-User 2025 & 2033
- Figure 23: Asia Pacific Clinical Trial Imaging Services Market Revenue Share (%), by End-User 2025 & 2033
- Figure 24: Asia Pacific Clinical Trial Imaging Services Market Revenue (Million), by Country 2025 & 2033
- Figure 25: Asia Pacific Clinical Trial Imaging Services Market Revenue Share (%), by Country 2025 & 2033
- Figure 26: Middle East and Africa Clinical Trial Imaging Services Market Revenue (Million), by Product and Service 2025 & 2033
- Figure 27: Middle East and Africa Clinical Trial Imaging Services Market Revenue Share (%), by Product and Service 2025 & 2033
- Figure 28: Middle East and Africa Clinical Trial Imaging Services Market Revenue (Million), by Modality 2025 & 2033
- Figure 29: Middle East and Africa Clinical Trial Imaging Services Market Revenue Share (%), by Modality 2025 & 2033
- Figure 30: Middle East and Africa Clinical Trial Imaging Services Market Revenue (Million), by End-User 2025 & 2033
- Figure 31: Middle East and Africa Clinical Trial Imaging Services Market Revenue Share (%), by End-User 2025 & 2033
- Figure 32: Middle East and Africa Clinical Trial Imaging Services Market Revenue (Million), by Country 2025 & 2033
- Figure 33: Middle East and Africa Clinical Trial Imaging Services Market Revenue Share (%), by Country 2025 & 2033
- Figure 34: South America Clinical Trial Imaging Services Market Revenue (Million), by Product and Service 2025 & 2033
- Figure 35: South America Clinical Trial Imaging Services Market Revenue Share (%), by Product and Service 2025 & 2033
- Figure 36: South America Clinical Trial Imaging Services Market Revenue (Million), by Modality 2025 & 2033
- Figure 37: South America Clinical Trial Imaging Services Market Revenue Share (%), by Modality 2025 & 2033
- Figure 38: South America Clinical Trial Imaging Services Market Revenue (Million), by End-User 2025 & 2033
- Figure 39: South America Clinical Trial Imaging Services Market Revenue Share (%), by End-User 2025 & 2033
- Figure 40: South America Clinical Trial Imaging Services Market Revenue (Million), by Country 2025 & 2033
- Figure 41: South America Clinical Trial Imaging Services Market Revenue Share (%), by Country 2025 & 2033
List of Tables
- Table 1: Global Clinical Trial Imaging Services Market Revenue Million Forecast, by Product and Service 2020 & 2033
- Table 2: Global Clinical Trial Imaging Services Market Revenue Million Forecast, by Modality 2020 & 2033
- Table 3: Global Clinical Trial Imaging Services Market Revenue Million Forecast, by End-User 2020 & 2033
- Table 4: Global Clinical Trial Imaging Services Market Revenue Million Forecast, by Region 2020 & 2033
- Table 5: Global Clinical Trial Imaging Services Market Revenue Million Forecast, by Product and Service 2020 & 2033
- Table 6: Global Clinical Trial Imaging Services Market Revenue Million Forecast, by Modality 2020 & 2033
- Table 7: Global Clinical Trial Imaging Services Market Revenue Million Forecast, by End-User 2020 & 2033
- Table 8: Global Clinical Trial Imaging Services Market Revenue Million Forecast, by Country 2020 & 2033
- Table 9: United States Clinical Trial Imaging Services Market Revenue (Million) Forecast, by Application 2020 & 2033
- Table 10: Canada Clinical Trial Imaging Services Market Revenue (Million) Forecast, by Application 2020 & 2033
- Table 11: Mexico Clinical Trial Imaging Services Market Revenue (Million) Forecast, by Application 2020 & 2033
- Table 12: Global Clinical Trial Imaging Services Market Revenue Million Forecast, by Product and Service 2020 & 2033
- Table 13: Global Clinical Trial Imaging Services Market Revenue Million Forecast, by Modality 2020 & 2033
- Table 14: Global Clinical Trial Imaging Services Market Revenue Million Forecast, by End-User 2020 & 2033
- Table 15: Global Clinical Trial Imaging Services Market Revenue Million Forecast, by Country 2020 & 2033
- Table 16: Germany Clinical Trial Imaging Services Market Revenue (Million) Forecast, by Application 2020 & 2033
- Table 17: United Kingdom Clinical Trial Imaging Services Market Revenue (Million) Forecast, by Application 2020 & 2033
- Table 18: France Clinical Trial Imaging Services Market Revenue (Million) Forecast, by Application 2020 & 2033
- Table 19: Italy Clinical Trial Imaging Services Market Revenue (Million) Forecast, by Application 2020 & 2033
- Table 20: Spain Clinical Trial Imaging Services Market Revenue (Million) Forecast, by Application 2020 & 2033
- Table 21: Rest of Europe Clinical Trial Imaging Services Market Revenue (Million) Forecast, by Application 2020 & 2033
- Table 22: Global Clinical Trial Imaging Services Market Revenue Million Forecast, by Product and Service 2020 & 2033
- Table 23: Global Clinical Trial Imaging Services Market Revenue Million Forecast, by Modality 2020 & 2033
- Table 24: Global Clinical Trial Imaging Services Market Revenue Million Forecast, by End-User 2020 & 2033
- Table 25: Global Clinical Trial Imaging Services Market Revenue Million Forecast, by Country 2020 & 2033
- Table 26: China Clinical Trial Imaging Services Market Revenue (Million) Forecast, by Application 2020 & 2033
- Table 27: Japan Clinical Trial Imaging Services Market Revenue (Million) Forecast, by Application 2020 & 2033
- Table 28: India Clinical Trial Imaging Services Market Revenue (Million) Forecast, by Application 2020 & 2033
- Table 29: Australia Clinical Trial Imaging Services Market Revenue (Million) Forecast, by Application 2020 & 2033
- Table 30: South Korea Clinical Trial Imaging Services Market Revenue (Million) Forecast, by Application 2020 & 2033
- Table 31: Rest of Asia Pacific Clinical Trial Imaging Services Market Revenue (Million) Forecast, by Application 2020 & 2033
- Table 32: Global Clinical Trial Imaging Services Market Revenue Million Forecast, by Product and Service 2020 & 2033
- Table 33: Global Clinical Trial Imaging Services Market Revenue Million Forecast, by Modality 2020 & 2033
- Table 34: Global Clinical Trial Imaging Services Market Revenue Million Forecast, by End-User 2020 & 2033
- Table 35: Global Clinical Trial Imaging Services Market Revenue Million Forecast, by Country 2020 & 2033
- Table 36: GCC Clinical Trial Imaging Services Market Revenue (Million) Forecast, by Application 2020 & 2033
- Table 37: South Africa Clinical Trial Imaging Services Market Revenue (Million) Forecast, by Application 2020 & 2033
- Table 38: Rest of Middle East and Africa Clinical Trial Imaging Services Market Revenue (Million) Forecast, by Application 2020 & 2033
- Table 39: Global Clinical Trial Imaging Services Market Revenue Million Forecast, by Product and Service 2020 & 2033
- Table 40: Global Clinical Trial Imaging Services Market Revenue Million Forecast, by Modality 2020 & 2033
- Table 41: Global Clinical Trial Imaging Services Market Revenue Million Forecast, by End-User 2020 & 2033
- Table 42: Global Clinical Trial Imaging Services Market Revenue Million Forecast, by Country 2020 & 2033
- Table 43: Brazil Clinical Trial Imaging Services Market Revenue (Million) Forecast, by Application 2020 & 2033
- Table 44: Argentina Clinical Trial Imaging Services Market Revenue (Million) Forecast, by Application 2020 & 2033
- Table 45: Rest of South America Clinical Trial Imaging Services Market Revenue (Million) Forecast, by Application 2020 & 2033
Frequently Asked Questions
1. What is the projected Compound Annual Growth Rate (CAGR) of the Clinical Trial Imaging Services Market?
The projected CAGR is approximately 5.38%.
2. Which companies are prominent players in the Clinical Trial Imaging Services Market?
Key companies in the market include Navitas Clinical Research Inc, Koninklijke Philips N V, Worldcare Clinical LLC, ProScan Imaging, Parexel International Corporation, Radiant Sage LLC, WIRB-Copernicus Group, Ixico PLC, Clario, Resonance Health, Medpace, Icon PLC.
3. What are the main segments of the Clinical Trial Imaging Services Market?
The market segments include Product and Service, Modality, End-User.
4. Can you provide details about the market size?
The market size is estimated to be USD 1.25 Million as of 2022.
5. What are some drivers contributing to market growth?
Increase in R&D Spending by the Pharmaceutical and Biotechnological Companies; Increasing Number of Contract Research Organization & Investment by Them.
6. What are the notable trends driving market growth?
Computed Tomography is Expected to Witness Rapid Growth Over the Forecast Period.
7. Are there any restraints impacting market growth?
High Implementation Barriers and Costs of Imaging Systems.
8. Can you provide examples of recent developments in the market?
In May 2022, at the International Society for Magnetic Resonance in Medicine (ISMRM) 2022 conference, Bruker launched innovative 7 Tesla and 9.4 Tesla conduction-cooled Maxwell magnets for its market-leading preclinical magnetic resonance imaging (MRI) systems portfolio.
9. What pricing options are available for accessing the report?
Pricing options include single-user, multi-user, and enterprise licenses priced at USD 4750, USD 5250, and USD 8750 respectively.
10. Is the market size provided in terms of value or volume?
The market size is provided in terms of value, measured in Million.
11. Are there any specific market keywords associated with the report?
Yes, the market keyword associated with the report is "Clinical Trial Imaging Services Market," which aids in identifying and referencing the specific market segment covered.
12. How do I determine which pricing option suits my needs best?
The pricing options vary based on user requirements and access needs. Individual users may opt for single-user licenses, while businesses requiring broader access may choose multi-user or enterprise licenses for cost-effective access to the report.
13. Are there any additional resources or data provided in the Clinical Trial Imaging Services Market report?
While the report offers comprehensive insights, it's advisable to review the specific contents or supplementary materials provided to ascertain if additional resources or data are available.
14. How can I stay updated on further developments or reports in the Clinical Trial Imaging Services Market?
To stay informed about further developments, trends, and reports in the Clinical Trial Imaging Services Market, consider subscribing to industry newsletters, following relevant companies and organizations, or regularly checking reputable industry news sources and publications.
Methodology
Step 1 - Identification of Relevant Samples Size from Population Database


Step 2 - Approaches for Defining Global Market Size (Value, Volume* & Price*)

Note*: In applicable scenarios
Step 3 - Data Sources
Primary Research
- Web Analytics
- Survey Reports
- Research Institute
- Latest Research Reports
- Opinion Leaders
Secondary Research
- Annual Reports
- White Paper
- Latest Press Release
- Industry Association
- Paid Database
- Investor Presentations

Step 4 - Data Triangulation
Involves using different sources of information in order to increase the validity of a study
These sources are likely to be stakeholders in a program - participants, other researchers, program staff, other community members, and so on.
Then we put all data in single framework & apply various statistical tools to find out the dynamic on the market.
During the analysis stage, feedback from the stakeholder groups would be compared to determine areas of agreement as well as areas of divergence