

Key Insights
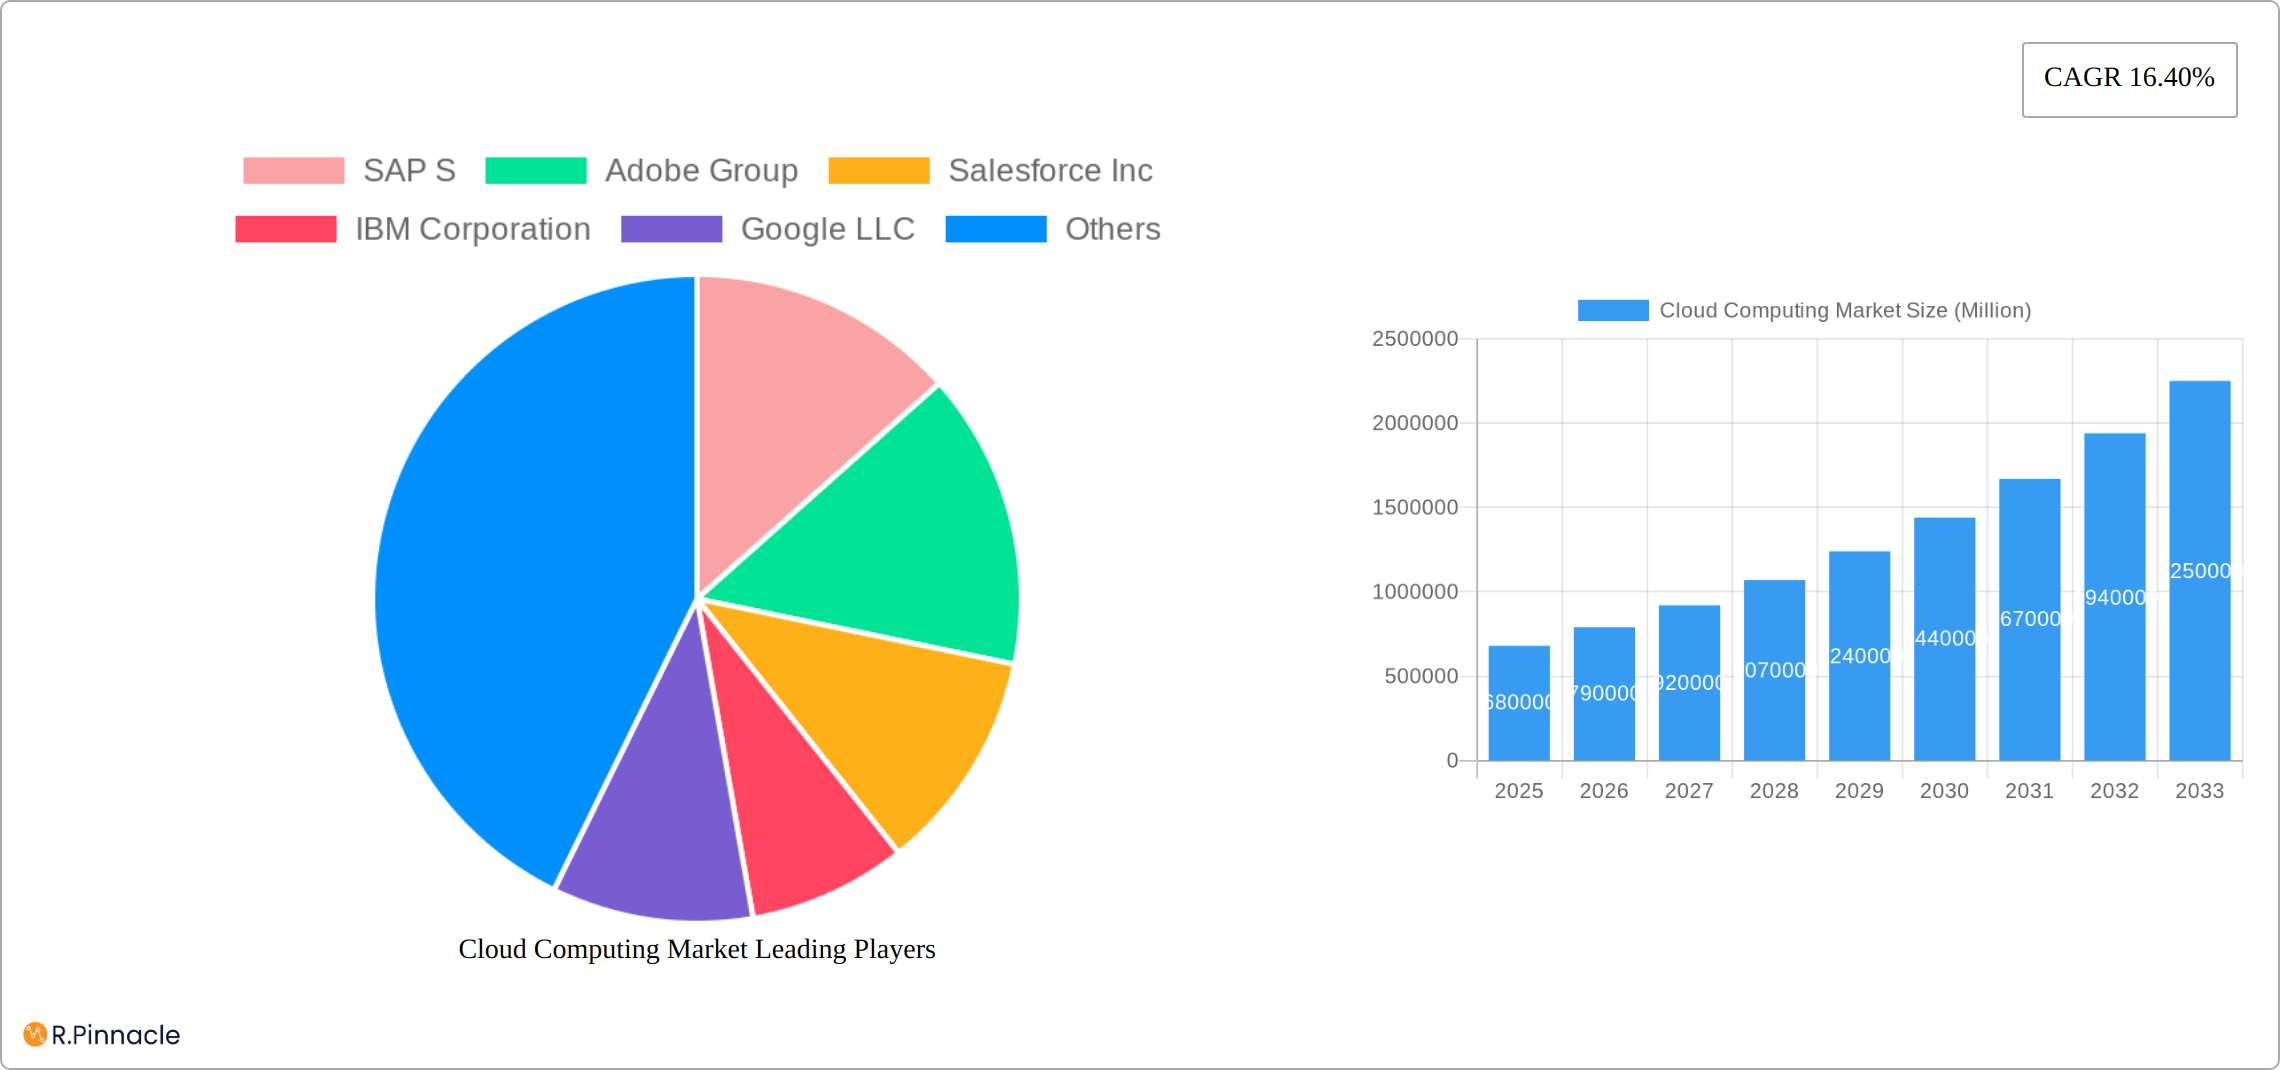
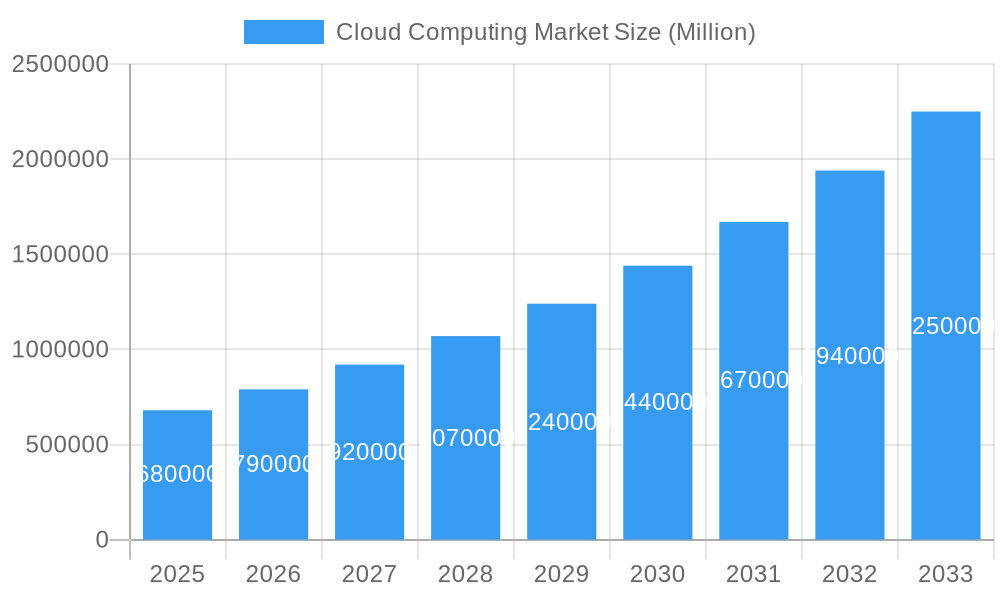
The global cloud computing market, valued at $0.68 trillion in 2025, is projected to experience robust growth, driven by increasing digital transformation initiatives across diverse sectors and the rising adoption of cloud-based solutions for enhanced scalability, flexibility, and cost-effectiveness. A compound annual growth rate (CAGR) of 16.40% from 2025 to 2033 signifies a substantial expansion, with the market expected to surpass $2.5 trillion by 2033. This growth is fueled by several key factors. Firstly, the increasing demand for data storage and processing capabilities across industries, particularly in sectors like IT & Telecom, BFSI, and Retail & Consumer Goods, is a significant driver. Secondly, the continuous innovation in cloud technologies, such as advancements in Artificial Intelligence (AI), Machine Learning (ML), and the Internet of Things (IoT), expands the applications and capabilities of cloud computing, furthering its adoption. Finally, the growing preference for subscription-based services and the strategic shift toward hybrid and multi-cloud environments contributes to the overall market expansion.
Cloud Computing Market Market Size (In Billion)
Significant regional variations exist within the cloud computing market. North America, currently holding a substantial market share, is expected to maintain its leading position due to the high concentration of technology companies and early adoption of cloud technologies. However, the Asia-Pacific region is predicted to demonstrate the fastest growth rate, driven by rapidly expanding digital economies in countries like China and India. Europe is also expected to witness significant growth, propelled by increasing investments in digital infrastructure and the burgeoning adoption of cloud-based solutions across various sectors. Market segmentation by computing type (IaaS, SaaS, PaaS) reveals the dominance of SaaS, owing to its accessibility and ease of use. However, IaaS and PaaS are anticipated to exhibit substantial growth, reflecting the increasing requirements for infrastructure and platform management flexibility. Key players such as Amazon Web Services (AWS), Microsoft Azure, Google Cloud Platform (GCP), Salesforce, and others are actively competing, driving innovation and price competitiveness within the market. This competitive landscape fosters continuous improvement in services and offerings, further bolstering the market's expansion.
Cloud Computing Market Company Market Share
This comprehensive report provides an in-depth analysis of the global cloud computing market, offering invaluable insights for industry professionals, investors, and strategic decision-makers. With a study period spanning 2019-2033, a base year of 2025, and a forecast period of 2025-2033, this report leverages rigorous data analysis to present a clear picture of current market dynamics and future growth trajectories. The market is expected to reach xx Million by 2033, showcasing substantial growth potential.
Cloud Computing Market Structure & Innovation Trends
The cloud computing market exhibits a high degree of concentration, with a few dominant players controlling a significant market share. Amazon Web Services (AWS), Microsoft Azure, and Google Cloud Platform (GCP) lead the pack, followed by other significant players like Alibaba Cloud, Oracle, and IBM. Market share dynamics are continuously shifting due to intense competition and innovation. Mergers and acquisitions (M&A) play a crucial role in shaping the market landscape, with recent deal values exceeding xx Million in several instances.
- Market Concentration: High, with top players holding xx% of market share.
- Innovation Drivers: AI/ML integration, enhanced security features, serverless computing, edge computing, and the rise of hybrid cloud solutions.
- Regulatory Frameworks: Data privacy regulations (GDPR, CCPA) and cybersecurity standards significantly impact market dynamics.
- Product Substitutes: On-premise infrastructure solutions remain a viable alternative, although cloud computing adoption is steadily increasing.
- End-User Demographics: A diverse range of end-user verticals, including IT & Telecom, BFSI, Retail, Manufacturing, Healthcare, and Media & Entertainment, drive market growth.
- M&A Activities: Frequent acquisitions of smaller cloud service providers and specialized technology firms are observed. Significant M&A deals have exceeded xx Million in value in recent years. This trend is expected to continue, driving market consolidation.
Cloud Computing Market Dynamics & Trends
The cloud computing market demonstrates robust growth, driven by several key factors. The increasing adoption of digital transformation initiatives across industries, the need for scalable and cost-effective IT solutions, and the proliferation of mobile devices and IoT applications are major drivers. Technological advancements, such as the rise of AI, machine learning, and serverless computing, further accelerate market expansion. Competitive dynamics are intense, with major players continuously innovating and expanding their service portfolios to capture market share. The market is projected to experience a Compound Annual Growth Rate (CAGR) of xx% during the forecast period, with market penetration expected to reach xx% by 2033.
Dominant Regions & Segments in Cloud Computing Market
North America currently holds the largest share of the global cloud computing market, driven by substantial technological advancements, a robust digital infrastructure, and considerable investments in cloud-based solutions. However, the Asia-Pacific region is experiencing rapid growth, fueled by accelerating digital transformation initiatives, a massive population base, and increasing government support for digital infrastructure development. Europe is also a significant market, with strong adoption across various sectors and a focus on data privacy regulations.
By Deployment Model:
- SaaS (Software as a Service): Remains the dominant market segment due to its user-friendly interface, accessibility, and pay-as-you-go pricing model. Its ease of implementation and scalability contribute to its widespread adoption.
- IaaS (Infrastructure as a Service): Shows substantial growth, driven by its scalability, cost-effectiveness, and ability to provide on-demand computing resources. Businesses leverage IaaS for flexibility and efficient resource allocation.
- PaaS (Platform as a Service): Demonstrates strong potential, fueled by the rising demand for agile application development and deployment. PaaS simplifies the development lifecycle and reduces operational overhead.
- Private Cloud: Continues to be relevant for organizations with stringent security and compliance requirements, offering greater control over data and infrastructure.
- Public Cloud: Remains the most popular deployment model due to its cost-effectiveness, scalability, and accessibility. It enables businesses to quickly deploy applications and scale resources on demand.
- Hybrid Cloud: Gains traction as organizations seek to combine the benefits of public and private cloud environments, optimizing for security, cost, and performance.
By End-user Verticals:
- IT & Telecom: Remains a key adopter and major consumer of cloud services, leveraging cloud solutions for infrastructure management, application development, and service delivery.
- BFSI (Banking, Financial Services, and Insurance): High adoption continues due to stringent security requirements, the need for robust data management, and regulatory compliance. Cloud solutions help improve operational efficiency and enhance customer experience.
- Retail & Consumer Goods: Experiences growing adoption for e-commerce operations, supply chain optimization, customer relationship management (CRM), and personalized marketing initiatives.
- Manufacturing: Increasing adoption focuses on optimizing production processes, enhancing supply chain visibility, and enabling predictive maintenance through data analytics.
- Healthcare: Growing adoption is driven by the need to manage patient data securely and efficiently, improve healthcare delivery, and enable remote diagnostics and telehealth services.
- Media & Entertainment: High adoption persists for content delivery, streaming services, media production, and digital asset management, enabled by the scalability and flexibility of cloud infrastructure.
- Government & Public Sector: Growing adoption is driven by the need for efficient service delivery, improved citizen engagement, and secure data management. Cloud solutions support various government initiatives.
Key drivers for market expansion include favorable economic policies, supportive government initiatives, expanding digital infrastructure, increasing investments in technology, and the growing awareness of cloud's benefits across diverse industries. Furthermore, the increasing need for data-driven decision making and the rise of big data are fueling cloud adoption.
Cloud Computing Market Product Innovations
Recent innovations in cloud computing focus on enhancing scalability, security, and cost-efficiency. The emergence of serverless computing, AI-powered analytics, and edge computing solutions revolutionizes application development and deployment. Furthermore, hybrid cloud solutions are gaining traction, combining the benefits of public and private clouds. These advancements address the evolving needs of enterprises and drive market growth.
Report Scope & Segmentation Analysis
This report segments the cloud computing market by computing type (IaaS, PaaS, SaaS) and by end-user verticals (IT & Telecom, BFSI, Retail & Consumer Goods, Manufacturing, Healthcare, Media & Entertainment). Each segment's market size, growth projections, and competitive dynamics are analyzed in detail. The report projects significant growth across all segments, with SaaS leading in terms of market share, followed by IaaS and PaaS. The Retail and Consumer Goods sector is expected to show the highest growth amongst end-user verticals.
Key Drivers of Cloud Computing Market Growth
Technological advancements, increasing demand for scalability and flexibility, cost optimization, enhanced security features, and supportive government policies are key drivers of market growth. Specific examples include the rise of AI and ML integration in cloud services, the development of serverless computing architectures, and the expanding adoption of hybrid cloud solutions. The growing need for robust data management and disaster recovery solutions also contributes to the market's expansion.
Challenges in the Cloud Computing Market Sector
The cloud computing market faces challenges including data security concerns, vendor lock-in, compliance with stringent data privacy regulations, potential supply chain disruptions, and increasing competition. These factors can impact market growth and necessitate strategic adaptation by cloud providers and enterprises alike. The cost of migrating to the cloud and the complexity of managing cloud environments also remain significant obstacles for some organizations.
Emerging Opportunities in Cloud Computing Market
The increasing adoption of IoT devices, the growth of edge computing, the expansion of AI-powered cloud services, and the exploration of quantum computing present significant and rapidly evolving opportunities. Furthermore, the burgeoning field of serverless computing, the increasing demand for specialized cloud solutions tailored to specific industry needs (e.g., healthcare, finance, and manufacturing), and the growing focus on sustainability in cloud computing create lucrative spaces for innovation and market expansion. The rise of cloud-native applications and microservices architectures further contributes to the dynamic and expansive nature of this market.
Leading Players in the Cloud Computing Market Market
Key Developments in Cloud Computing Market Industry
- April 2023: Alibaba Cloud launched cheaper options for its Elastic Compute Service (ECS) and Object Storage Service (OSS), including a new large language model. The ECS Universal reduces costs by up to 40%, while OSS Reserved Capacity (OSS-RC) reduces storage costs by up to 50%. This directly impacts market competitiveness and pricing strategies.
- November 2022: AWS opened its second infrastructure region in India, enabling enhanced resilience, availability, and lower latency for Indian customers. The projected USD 4.4 Billion investment and 48,000 jobs by 2030 demonstrate significant market expansion in the Asia Pacific region.
Future Outlook for Cloud Computing Market Market
The cloud computing market is poised for continued growth, driven by technological advancements, increasing digital transformation initiatives, and expanding adoption across diverse industries. The convergence of cloud computing with other emerging technologies like AI, IoT, and edge computing will create new opportunities and drive further market expansion. Strategic partnerships, M&A activities, and investments in innovative cloud solutions will shape the future landscape.
Cloud Computing Market Segmentation
-
1. Computing Type
- 1.1. IaaS
- 1.2. SaaS
- 1.3. PaaS
-
2. End-user Verticals
- 2.1. IT and Telecom
- 2.2. BFSI
- 2.3. Retail and Consumer Goods
- 2.4. Manufacturing
- 2.5. Healthcare
- 2.6. Media and Entertainment
Cloud Computing Market Segmentation By Geography
-
1. North America
- 1.1. United States
- 1.2. Canada
-
2. Europe
- 2.1. United Kingdom
- 2.2. Germany
- 2.3. France
- 2.4. Spain
- 2.5. Nordics
- 2.6. Benelux
-
3. Asia
- 3.1. China
- 3.2. India
- 3.3. Japan
- 3.4. South Korea
-
4. Latin America
- 4.1. Brazil
- 4.2. Argentina
- 4.3. Rest of South America
-
5. Middle East and Africa
- 5.1. GCC
- 5.2. South Africa
- 5.3. Rest of Middle East and Africa
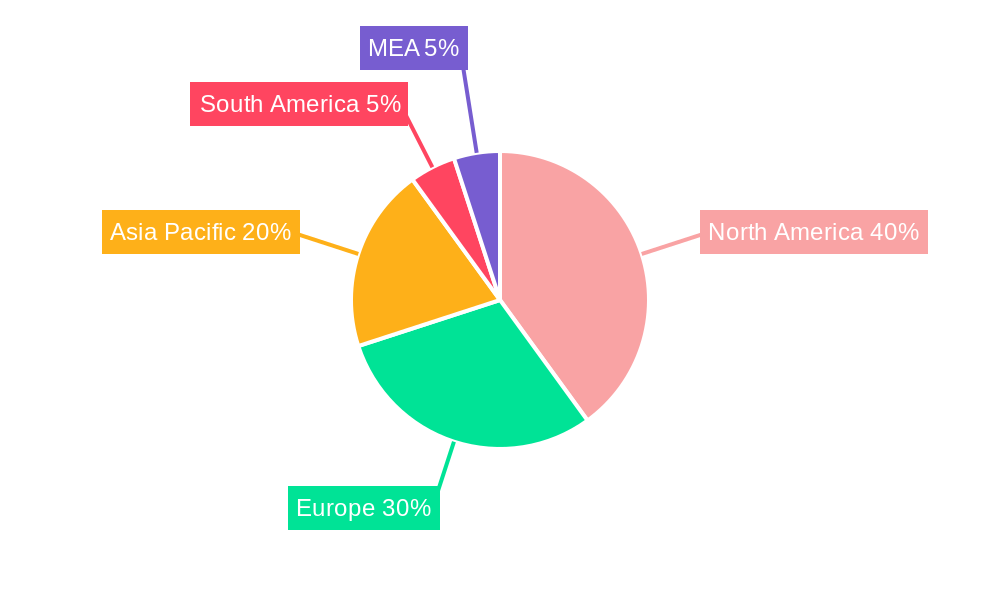
Cloud Computing Market Regional Market Share
Geographic Coverage of Cloud Computing Market
Cloud Computing Market REPORT HIGHLIGHTS
| Aspects | Details |
|---|---|
| Study Period | 2020-2034 |
| Base Year | 2025 |
| Estimated Year | 2026 |
| Forecast Period | 2026-2034 |
| Historical Period | 2020-2025 |
| Growth Rate | CAGR of 16.40% from 2020-2034 |
| Segmentation |
|
Table of Contents
- 1. Introduction
- 1.1. Research Scope
- 1.2. Market Segmentation
- 1.3. Research Methodology
- 1.4. Definitions and Assumptions
- 2. Executive Summary
- 2.1. Introduction
- 3. Market Dynamics
- 3.1. Introduction
- 3.2. Market Drivers
- 3.2.1. Robust Shift Towards Digital Transformation Across the World; Post- Pandemic Remote Work-Related Policies Positively Impacting the Cloud Market
- 3.3. Market Restrains
- 3.3.1. High Cost of Content Creation
- 3.4. Market Trends
- 3.4.1. Business Integration with Cloud Boosting Digitalization Across Industries
- 4. Market Factor Analysis
- 4.1. Porters Five Forces
- 4.2. Supply/Value Chain
- 4.3. PESTEL analysis
- 4.4. Market Entropy
- 4.5. Patent/Trademark Analysis
- 5. Global Cloud Computing Market Analysis, Insights and Forecast, 2020-2032
- 5.1. Market Analysis, Insights and Forecast - by Computing Type
- 5.1.1. IaaS
- 5.1.2. SaaS
- 5.1.3. PaaS
- 5.2. Market Analysis, Insights and Forecast - by End-user Verticals
- 5.2.1. IT and Telecom
- 5.2.2. BFSI
- 5.2.3. Retail and Consumer Goods
- 5.2.4. Manufacturing
- 5.2.5. Healthcare
- 5.2.6. Media and Entertainment
- 5.3. Market Analysis, Insights and Forecast - by Region
- 5.3.1. North America
- 5.3.2. Europe
- 5.3.3. Asia
- 5.3.4. Latin America
- 5.3.5. Middle East and Africa
- 5.1. Market Analysis, Insights and Forecast - by Computing Type
- 6. North America Cloud Computing Market Analysis, Insights and Forecast, 2020-2032
- 6.1. Market Analysis, Insights and Forecast - by Computing Type
- 6.1.1. IaaS
- 6.1.2. SaaS
- 6.1.3. PaaS
- 6.2. Market Analysis, Insights and Forecast - by End-user Verticals
- 6.2.1. IT and Telecom
- 6.2.2. BFSI
- 6.2.3. Retail and Consumer Goods
- 6.2.4. Manufacturing
- 6.2.5. Healthcare
- 6.2.6. Media and Entertainment
- 6.1. Market Analysis, Insights and Forecast - by Computing Type
- 7. Europe Cloud Computing Market Analysis, Insights and Forecast, 2020-2032
- 7.1. Market Analysis, Insights and Forecast - by Computing Type
- 7.1.1. IaaS
- 7.1.2. SaaS
- 7.1.3. PaaS
- 7.2. Market Analysis, Insights and Forecast - by End-user Verticals
- 7.2.1. IT and Telecom
- 7.2.2. BFSI
- 7.2.3. Retail and Consumer Goods
- 7.2.4. Manufacturing
- 7.2.5. Healthcare
- 7.2.6. Media and Entertainment
- 7.1. Market Analysis, Insights and Forecast - by Computing Type
- 8. Asia Cloud Computing Market Analysis, Insights and Forecast, 2020-2032
- 8.1. Market Analysis, Insights and Forecast - by Computing Type
- 8.1.1. IaaS
- 8.1.2. SaaS
- 8.1.3. PaaS
- 8.2. Market Analysis, Insights and Forecast - by End-user Verticals
- 8.2.1. IT and Telecom
- 8.2.2. BFSI
- 8.2.3. Retail and Consumer Goods
- 8.2.4. Manufacturing
- 8.2.5. Healthcare
- 8.2.6. Media and Entertainment
- 8.1. Market Analysis, Insights and Forecast - by Computing Type
- 9. Latin America Cloud Computing Market Analysis, Insights and Forecast, 2020-2032
- 9.1. Market Analysis, Insights and Forecast - by Computing Type
- 9.1.1. IaaS
- 9.1.2. SaaS
- 9.1.3. PaaS
- 9.2. Market Analysis, Insights and Forecast - by End-user Verticals
- 9.2.1. IT and Telecom
- 9.2.2. BFSI
- 9.2.3. Retail and Consumer Goods
- 9.2.4. Manufacturing
- 9.2.5. Healthcare
- 9.2.6. Media and Entertainment
- 9.1. Market Analysis, Insights and Forecast - by Computing Type
- 10. Middle East and Africa Cloud Computing Market Analysis, Insights and Forecast, 2020-2032
- 10.1. Market Analysis, Insights and Forecast - by Computing Type
- 10.1.1. IaaS
- 10.1.2. SaaS
- 10.1.3. PaaS
- 10.2. Market Analysis, Insights and Forecast - by End-user Verticals
- 10.2.1. IT and Telecom
- 10.2.2. BFSI
- 10.2.3. Retail and Consumer Goods
- 10.2.4. Manufacturing
- 10.2.5. Healthcare
- 10.2.6. Media and Entertainment
- 10.1. Market Analysis, Insights and Forecast - by Computing Type
- 11. Competitive Analysis
- 11.1. Global Market Share Analysis 2025
- 11.2. Company Profiles
- 11.2.1 SAP S
- 11.2.1.1. Overview
- 11.2.1.2. Products
- 11.2.1.3. SWOT Analysis
- 11.2.1.4. Recent Developments
- 11.2.1.5. Financials (Based on Availability)
- 11.2.2 Adobe Group
- 11.2.2.1. Overview
- 11.2.2.2. Products
- 11.2.2.3. SWOT Analysis
- 11.2.2.4. Recent Developments
- 11.2.2.5. Financials (Based on Availability)
- 11.2.3 Salesforce Inc
- 11.2.3.1. Overview
- 11.2.3.2. Products
- 11.2.3.3. SWOT Analysis
- 11.2.3.4. Recent Developments
- 11.2.3.5. Financials (Based on Availability)
- 11.2.4 IBM Corporation
- 11.2.4.1. Overview
- 11.2.4.2. Products
- 11.2.4.3. SWOT Analysis
- 11.2.4.4. Recent Developments
- 11.2.4.5. Financials (Based on Availability)
- 11.2.5 Google LLC
- 11.2.5.1. Overview
- 11.2.5.2. Products
- 11.2.5.3. SWOT Analysis
- 11.2.5.4. Recent Developments
- 11.2.5.5. Financials (Based on Availability)
- 11.2.6 SAS
- 11.2.6.1. Overview
- 11.2.6.2. Products
- 11.2.6.3. SWOT Analysis
- 11.2.6.4. Recent Developments
- 11.2.6.5. Financials (Based on Availability)
- 11.2.7 Alibaba Cloud
- 11.2.7.1. Overview
- 11.2.7.2. Products
- 11.2.7.3. SWOT Analysis
- 11.2.7.4. Recent Developments
- 11.2.7.5. Financials (Based on Availability)
- 11.2.8 Microsoft Corporation
- 11.2.8.1. Overview
- 11.2.8.2. Products
- 11.2.8.3. SWOT Analysis
- 11.2.8.4. Recent Developments
- 11.2.8.5. Financials (Based on Availability)
- 11.2.9 DXC Group
- 11.2.9.1. Overview
- 11.2.9.2. Products
- 11.2.9.3. SWOT Analysis
- 11.2.9.4. Recent Developments
- 11.2.9.5. Financials (Based on Availability)
- 11.2.10 Oracle Corporation
- 11.2.10.1. Overview
- 11.2.10.2. Products
- 11.2.10.3. SWOT Analysis
- 11.2.10.4. Recent Developments
- 11.2.10.5. Financials (Based on Availability)
- 11.2.11 Amazon com Inc (AWS)
- 11.2.11.1. Overview
- 11.2.11.2. Products
- 11.2.11.3. SWOT Analysis
- 11.2.11.4. Recent Developments
- 11.2.11.5. Financials (Based on Availability)
- 11.2.1 SAP S
List of Figures
- Figure 1: Global Cloud Computing Market Revenue Breakdown (Million, %) by Region 2025 & 2033
- Figure 2: Global Cloud Computing Market Volume Breakdown (K Unit, %) by Region 2025 & 2033
- Figure 3: North America Cloud Computing Market Revenue (Million), by Computing Type 2025 & 2033
- Figure 4: North America Cloud Computing Market Volume (K Unit), by Computing Type 2025 & 2033
- Figure 5: North America Cloud Computing Market Revenue Share (%), by Computing Type 2025 & 2033
- Figure 6: North America Cloud Computing Market Volume Share (%), by Computing Type 2025 & 2033
- Figure 7: North America Cloud Computing Market Revenue (Million), by End-user Verticals 2025 & 2033
- Figure 8: North America Cloud Computing Market Volume (K Unit), by End-user Verticals 2025 & 2033
- Figure 9: North America Cloud Computing Market Revenue Share (%), by End-user Verticals 2025 & 2033
- Figure 10: North America Cloud Computing Market Volume Share (%), by End-user Verticals 2025 & 2033
- Figure 11: North America Cloud Computing Market Revenue (Million), by Country 2025 & 2033
- Figure 12: North America Cloud Computing Market Volume (K Unit), by Country 2025 & 2033
- Figure 13: North America Cloud Computing Market Revenue Share (%), by Country 2025 & 2033
- Figure 14: North America Cloud Computing Market Volume Share (%), by Country 2025 & 2033
- Figure 15: Europe Cloud Computing Market Revenue (Million), by Computing Type 2025 & 2033
- Figure 16: Europe Cloud Computing Market Volume (K Unit), by Computing Type 2025 & 2033
- Figure 17: Europe Cloud Computing Market Revenue Share (%), by Computing Type 2025 & 2033
- Figure 18: Europe Cloud Computing Market Volume Share (%), by Computing Type 2025 & 2033
- Figure 19: Europe Cloud Computing Market Revenue (Million), by End-user Verticals 2025 & 2033
- Figure 20: Europe Cloud Computing Market Volume (K Unit), by End-user Verticals 2025 & 2033
- Figure 21: Europe Cloud Computing Market Revenue Share (%), by End-user Verticals 2025 & 2033
- Figure 22: Europe Cloud Computing Market Volume Share (%), by End-user Verticals 2025 & 2033
- Figure 23: Europe Cloud Computing Market Revenue (Million), by Country 2025 & 2033
- Figure 24: Europe Cloud Computing Market Volume (K Unit), by Country 2025 & 2033
- Figure 25: Europe Cloud Computing Market Revenue Share (%), by Country 2025 & 2033
- Figure 26: Europe Cloud Computing Market Volume Share (%), by Country 2025 & 2033
- Figure 27: Asia Cloud Computing Market Revenue (Million), by Computing Type 2025 & 2033
- Figure 28: Asia Cloud Computing Market Volume (K Unit), by Computing Type 2025 & 2033
- Figure 29: Asia Cloud Computing Market Revenue Share (%), by Computing Type 2025 & 2033
- Figure 30: Asia Cloud Computing Market Volume Share (%), by Computing Type 2025 & 2033
- Figure 31: Asia Cloud Computing Market Revenue (Million), by End-user Verticals 2025 & 2033
- Figure 32: Asia Cloud Computing Market Volume (K Unit), by End-user Verticals 2025 & 2033
- Figure 33: Asia Cloud Computing Market Revenue Share (%), by End-user Verticals 2025 & 2033
- Figure 34: Asia Cloud Computing Market Volume Share (%), by End-user Verticals 2025 & 2033
- Figure 35: Asia Cloud Computing Market Revenue (Million), by Country 2025 & 2033
- Figure 36: Asia Cloud Computing Market Volume (K Unit), by Country 2025 & 2033
- Figure 37: Asia Cloud Computing Market Revenue Share (%), by Country 2025 & 2033
- Figure 38: Asia Cloud Computing Market Volume Share (%), by Country 2025 & 2033
- Figure 39: Latin America Cloud Computing Market Revenue (Million), by Computing Type 2025 & 2033
- Figure 40: Latin America Cloud Computing Market Volume (K Unit), by Computing Type 2025 & 2033
- Figure 41: Latin America Cloud Computing Market Revenue Share (%), by Computing Type 2025 & 2033
- Figure 42: Latin America Cloud Computing Market Volume Share (%), by Computing Type 2025 & 2033
- Figure 43: Latin America Cloud Computing Market Revenue (Million), by End-user Verticals 2025 & 2033
- Figure 44: Latin America Cloud Computing Market Volume (K Unit), by End-user Verticals 2025 & 2033
- Figure 45: Latin America Cloud Computing Market Revenue Share (%), by End-user Verticals 2025 & 2033
- Figure 46: Latin America Cloud Computing Market Volume Share (%), by End-user Verticals 2025 & 2033
- Figure 47: Latin America Cloud Computing Market Revenue (Million), by Country 2025 & 2033
- Figure 48: Latin America Cloud Computing Market Volume (K Unit), by Country 2025 & 2033
- Figure 49: Latin America Cloud Computing Market Revenue Share (%), by Country 2025 & 2033
- Figure 50: Latin America Cloud Computing Market Volume Share (%), by Country 2025 & 2033
- Figure 51: Middle East and Africa Cloud Computing Market Revenue (Million), by Computing Type 2025 & 2033
- Figure 52: Middle East and Africa Cloud Computing Market Volume (K Unit), by Computing Type 2025 & 2033
- Figure 53: Middle East and Africa Cloud Computing Market Revenue Share (%), by Computing Type 2025 & 2033
- Figure 54: Middle East and Africa Cloud Computing Market Volume Share (%), by Computing Type 2025 & 2033
- Figure 55: Middle East and Africa Cloud Computing Market Revenue (Million), by End-user Verticals 2025 & 2033
- Figure 56: Middle East and Africa Cloud Computing Market Volume (K Unit), by End-user Verticals 2025 & 2033
- Figure 57: Middle East and Africa Cloud Computing Market Revenue Share (%), by End-user Verticals 2025 & 2033
- Figure 58: Middle East and Africa Cloud Computing Market Volume Share (%), by End-user Verticals 2025 & 2033
- Figure 59: Middle East and Africa Cloud Computing Market Revenue (Million), by Country 2025 & 2033
- Figure 60: Middle East and Africa Cloud Computing Market Volume (K Unit), by Country 2025 & 2033
- Figure 61: Middle East and Africa Cloud Computing Market Revenue Share (%), by Country 2025 & 2033
- Figure 62: Middle East and Africa Cloud Computing Market Volume Share (%), by Country 2025 & 2033
List of Tables
- Table 1: Global Cloud Computing Market Revenue Million Forecast, by Computing Type 2020 & 2033
- Table 2: Global Cloud Computing Market Volume K Unit Forecast, by Computing Type 2020 & 2033
- Table 3: Global Cloud Computing Market Revenue Million Forecast, by End-user Verticals 2020 & 2033
- Table 4: Global Cloud Computing Market Volume K Unit Forecast, by End-user Verticals 2020 & 2033
- Table 5: Global Cloud Computing Market Revenue Million Forecast, by Region 2020 & 2033
- Table 6: Global Cloud Computing Market Volume K Unit Forecast, by Region 2020 & 2033
- Table 7: Global Cloud Computing Market Revenue Million Forecast, by Computing Type 2020 & 2033
- Table 8: Global Cloud Computing Market Volume K Unit Forecast, by Computing Type 2020 & 2033
- Table 9: Global Cloud Computing Market Revenue Million Forecast, by End-user Verticals 2020 & 2033
- Table 10: Global Cloud Computing Market Volume K Unit Forecast, by End-user Verticals 2020 & 2033
- Table 11: Global Cloud Computing Market Revenue Million Forecast, by Country 2020 & 2033
- Table 12: Global Cloud Computing Market Volume K Unit Forecast, by Country 2020 & 2033
- Table 13: United States Cloud Computing Market Revenue (Million) Forecast, by Application 2020 & 2033
- Table 14: United States Cloud Computing Market Volume (K Unit) Forecast, by Application 2020 & 2033
- Table 15: Canada Cloud Computing Market Revenue (Million) Forecast, by Application 2020 & 2033
- Table 16: Canada Cloud Computing Market Volume (K Unit) Forecast, by Application 2020 & 2033
- Table 17: Global Cloud Computing Market Revenue Million Forecast, by Computing Type 2020 & 2033
- Table 18: Global Cloud Computing Market Volume K Unit Forecast, by Computing Type 2020 & 2033
- Table 19: Global Cloud Computing Market Revenue Million Forecast, by End-user Verticals 2020 & 2033
- Table 20: Global Cloud Computing Market Volume K Unit Forecast, by End-user Verticals 2020 & 2033
- Table 21: Global Cloud Computing Market Revenue Million Forecast, by Country 2020 & 2033
- Table 22: Global Cloud Computing Market Volume K Unit Forecast, by Country 2020 & 2033
- Table 23: United Kingdom Cloud Computing Market Revenue (Million) Forecast, by Application 2020 & 2033
- Table 24: United Kingdom Cloud Computing Market Volume (K Unit) Forecast, by Application 2020 & 2033
- Table 25: Germany Cloud Computing Market Revenue (Million) Forecast, by Application 2020 & 2033
- Table 26: Germany Cloud Computing Market Volume (K Unit) Forecast, by Application 2020 & 2033
- Table 27: France Cloud Computing Market Revenue (Million) Forecast, by Application 2020 & 2033
- Table 28: France Cloud Computing Market Volume (K Unit) Forecast, by Application 2020 & 2033
- Table 29: Spain Cloud Computing Market Revenue (Million) Forecast, by Application 2020 & 2033
- Table 30: Spain Cloud Computing Market Volume (K Unit) Forecast, by Application 2020 & 2033
- Table 31: Nordics Cloud Computing Market Revenue (Million) Forecast, by Application 2020 & 2033
- Table 32: Nordics Cloud Computing Market Volume (K Unit) Forecast, by Application 2020 & 2033
- Table 33: Benelux Cloud Computing Market Revenue (Million) Forecast, by Application 2020 & 2033
- Table 34: Benelux Cloud Computing Market Volume (K Unit) Forecast, by Application 2020 & 2033
- Table 35: Global Cloud Computing Market Revenue Million Forecast, by Computing Type 2020 & 2033
- Table 36: Global Cloud Computing Market Volume K Unit Forecast, by Computing Type 2020 & 2033
- Table 37: Global Cloud Computing Market Revenue Million Forecast, by End-user Verticals 2020 & 2033
- Table 38: Global Cloud Computing Market Volume K Unit Forecast, by End-user Verticals 2020 & 2033
- Table 39: Global Cloud Computing Market Revenue Million Forecast, by Country 2020 & 2033
- Table 40: Global Cloud Computing Market Volume K Unit Forecast, by Country 2020 & 2033
- Table 41: China Cloud Computing Market Revenue (Million) Forecast, by Application 2020 & 2033
- Table 42: China Cloud Computing Market Volume (K Unit) Forecast, by Application 2020 & 2033
- Table 43: India Cloud Computing Market Revenue (Million) Forecast, by Application 2020 & 2033
- Table 44: India Cloud Computing Market Volume (K Unit) Forecast, by Application 2020 & 2033
- Table 45: Japan Cloud Computing Market Revenue (Million) Forecast, by Application 2020 & 2033
- Table 46: Japan Cloud Computing Market Volume (K Unit) Forecast, by Application 2020 & 2033
- Table 47: South Korea Cloud Computing Market Revenue (Million) Forecast, by Application 2020 & 2033
- Table 48: South Korea Cloud Computing Market Volume (K Unit) Forecast, by Application 2020 & 2033
- Table 49: Global Cloud Computing Market Revenue Million Forecast, by Computing Type 2020 & 2033
- Table 50: Global Cloud Computing Market Volume K Unit Forecast, by Computing Type 2020 & 2033
- Table 51: Global Cloud Computing Market Revenue Million Forecast, by End-user Verticals 2020 & 2033
- Table 52: Global Cloud Computing Market Volume K Unit Forecast, by End-user Verticals 2020 & 2033
- Table 53: Global Cloud Computing Market Revenue Million Forecast, by Country 2020 & 2033
- Table 54: Global Cloud Computing Market Volume K Unit Forecast, by Country 2020 & 2033
- Table 55: Brazil Cloud Computing Market Revenue (Million) Forecast, by Application 2020 & 2033
- Table 56: Brazil Cloud Computing Market Volume (K Unit) Forecast, by Application 2020 & 2033
- Table 57: Argentina Cloud Computing Market Revenue (Million) Forecast, by Application 2020 & 2033
- Table 58: Argentina Cloud Computing Market Volume (K Unit) Forecast, by Application 2020 & 2033
- Table 59: Rest of South America Cloud Computing Market Revenue (Million) Forecast, by Application 2020 & 2033
- Table 60: Rest of South America Cloud Computing Market Volume (K Unit) Forecast, by Application 2020 & 2033
- Table 61: Global Cloud Computing Market Revenue Million Forecast, by Computing Type 2020 & 2033
- Table 62: Global Cloud Computing Market Volume K Unit Forecast, by Computing Type 2020 & 2033
- Table 63: Global Cloud Computing Market Revenue Million Forecast, by End-user Verticals 2020 & 2033
- Table 64: Global Cloud Computing Market Volume K Unit Forecast, by End-user Verticals 2020 & 2033
- Table 65: Global Cloud Computing Market Revenue Million Forecast, by Country 2020 & 2033
- Table 66: Global Cloud Computing Market Volume K Unit Forecast, by Country 2020 & 2033
- Table 67: GCC Cloud Computing Market Revenue (Million) Forecast, by Application 2020 & 2033
- Table 68: GCC Cloud Computing Market Volume (K Unit) Forecast, by Application 2020 & 2033
- Table 69: South Africa Cloud Computing Market Revenue (Million) Forecast, by Application 2020 & 2033
- Table 70: South Africa Cloud Computing Market Volume (K Unit) Forecast, by Application 2020 & 2033
- Table 71: Rest of Middle East and Africa Cloud Computing Market Revenue (Million) Forecast, by Application 2020 & 2033
- Table 72: Rest of Middle East and Africa Cloud Computing Market Volume (K Unit) Forecast, by Application 2020 & 2033
Frequently Asked Questions
1. What is the projected Compound Annual Growth Rate (CAGR) of the Cloud Computing Market?
The projected CAGR is approximately 16.40%.
2. Which companies are prominent players in the Cloud Computing Market?
Key companies in the market include SAP S, Adobe Group, Salesforce Inc, IBM Corporation, Google LLC, SAS, Alibaba Cloud, Microsoft Corporation, DXC Group, Oracle Corporation, Amazon com Inc (AWS).
3. What are the main segments of the Cloud Computing Market?
The market segments include Computing Type, End-user Verticals.
4. Can you provide details about the market size?
The market size is estimated to be USD 0.68 Million as of 2022.
5. What are some drivers contributing to market growth?
Robust Shift Towards Digital Transformation Across the World; Post- Pandemic Remote Work-Related Policies Positively Impacting the Cloud Market.
6. What are the notable trends driving market growth?
Business Integration with Cloud Boosting Digitalization Across Industries.
7. Are there any restraints impacting market growth?
High Cost of Content Creation.
8. Can you provide examples of recent developments in the market?
April 2023 - Alibaba Cloud unveiled cheaper options for its Elastic Compute Service and Object Storage Service and a large language model to keep pace with the demand for cloud services. The new ECS Universal is claimed to offer the same stability as ECS while reducing costs by up to 40%, and is suited for running web applications and websites, enterprise office applications, and offline data analysis. The OSS Reserved Capacity (OSS-RC) would let its customers reserve storage capacity in a specific cloud region for one year, reducing capacity cost by up to 50%.
9. What pricing options are available for accessing the report?
Pricing options include single-user, multi-user, and enterprise licenses priced at USD 4750, USD 5250, and USD 8750 respectively.
10. Is the market size provided in terms of value or volume?
The market size is provided in terms of value, measured in Million and volume, measured in K Unit.
11. Are there any specific market keywords associated with the report?
Yes, the market keyword associated with the report is "Cloud Computing Market," which aids in identifying and referencing the specific market segment covered.
12. How do I determine which pricing option suits my needs best?
The pricing options vary based on user requirements and access needs. Individual users may opt for single-user licenses, while businesses requiring broader access may choose multi-user or enterprise licenses for cost-effective access to the report.
13. Are there any additional resources or data provided in the Cloud Computing Market report?
While the report offers comprehensive insights, it's advisable to review the specific contents or supplementary materials provided to ascertain if additional resources or data are available.
14. How can I stay updated on further developments or reports in the Cloud Computing Market?
To stay informed about further developments, trends, and reports in the Cloud Computing Market, consider subscribing to industry newsletters, following relevant companies and organizations, or regularly checking reputable industry news sources and publications.
Methodology
Step 1 - Identification of Relevant Samples Size from Population Database


Step 2 - Approaches for Defining Global Market Size (Value, Volume* & Price*)

Note*: In applicable scenarios
Step 3 - Data Sources
Primary Research
- Web Analytics
- Survey Reports
- Research Institute
- Latest Research Reports
- Opinion Leaders
Secondary Research
- Annual Reports
- White Paper
- Latest Press Release
- Industry Association
- Paid Database
- Investor Presentations

Step 4 - Data Triangulation
Involves using different sources of information in order to increase the validity of a study
These sources are likely to be stakeholders in a program - participants, other researchers, program staff, other community members, and so on.
Then we put all data in single framework & apply various statistical tools to find out the dynamic on the market.
During the analysis stage, feedback from the stakeholder groups would be compared to determine areas of agreement as well as areas of divergence