Key Insights
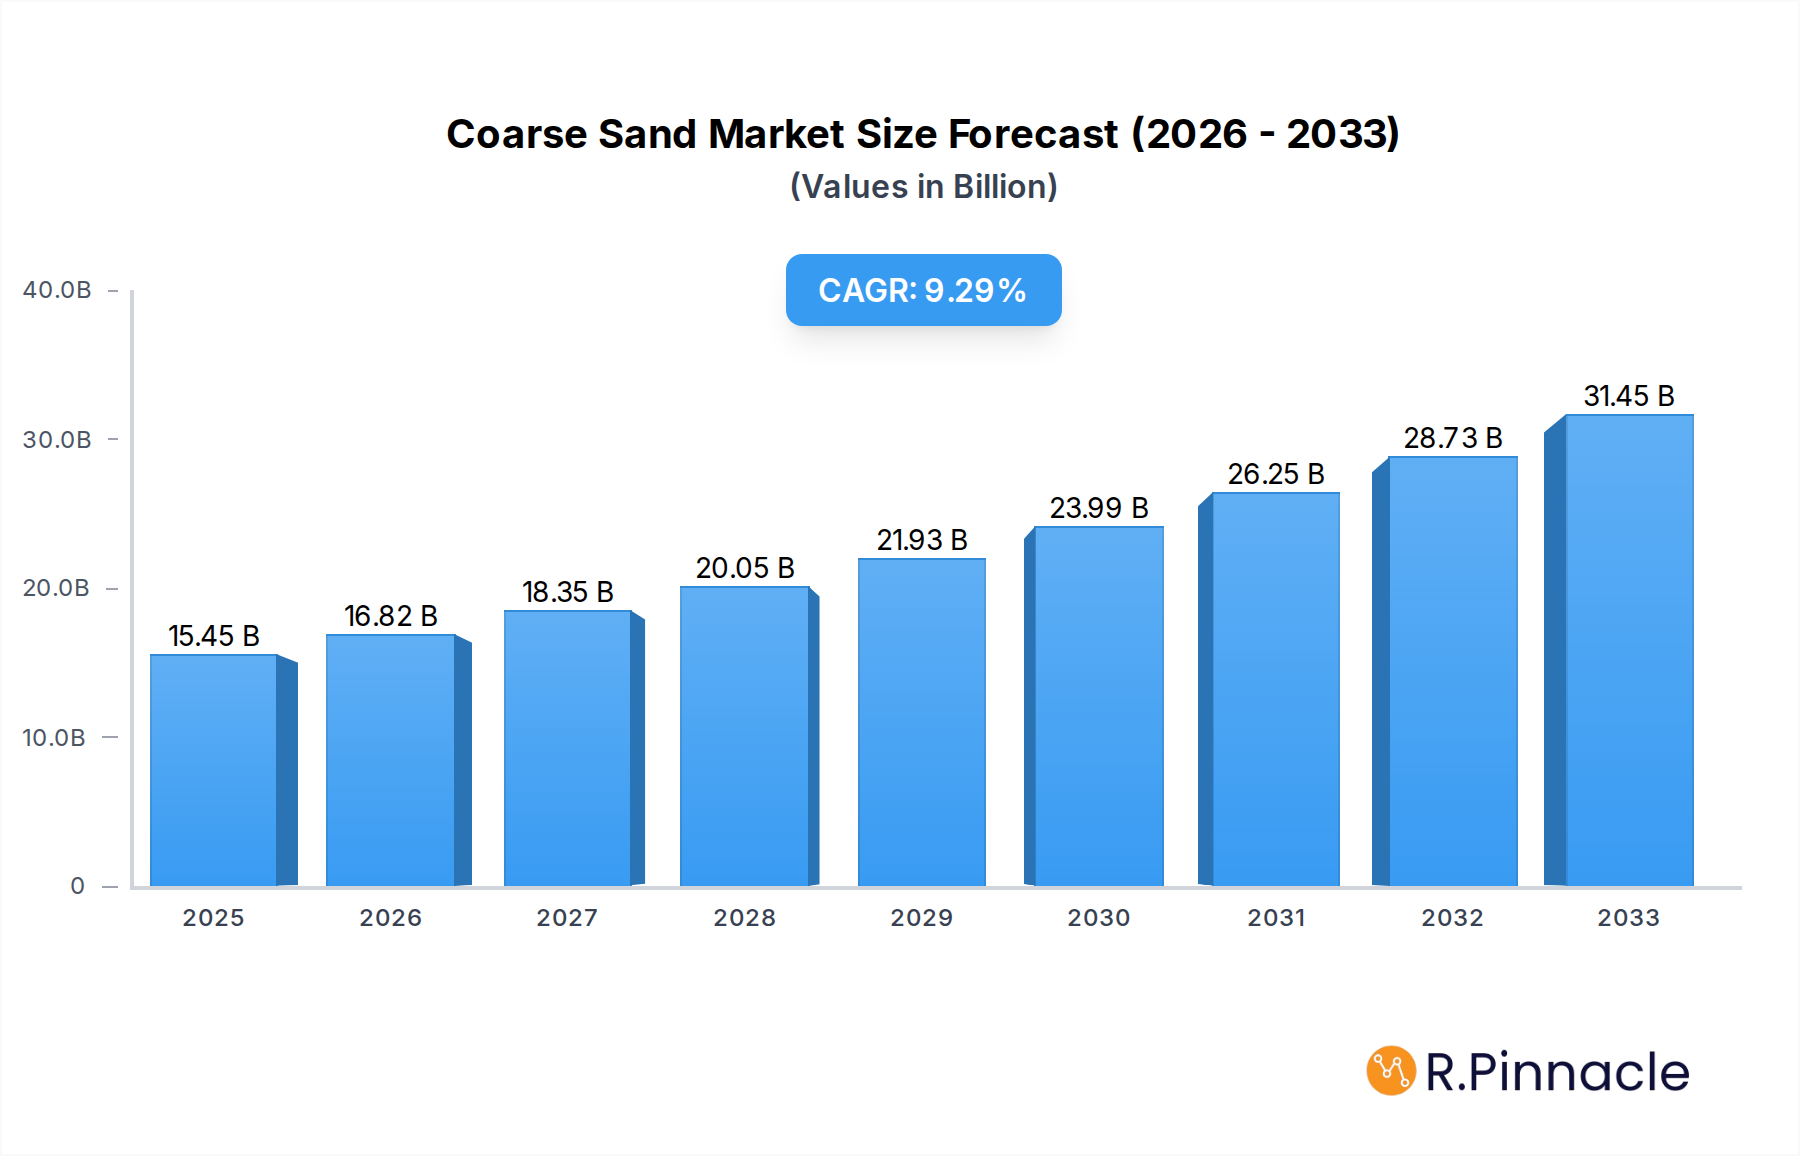
The global coarse sand market is poised for robust expansion, projected to reach a significant valuation of 15450 million by 2025, driven by a compelling compound annual growth rate (CAGR) of 9.2% throughout the forecast period of 2025-2033. This growth is underpinned by the indispensable role of coarse sand as a fundamental component across a wide spectrum of construction applications. Its primary uses in screed, render, and concrete formulations highlight its integral nature in both residential and commercial building projects. The increasing pace of urbanization, coupled with substantial investments in infrastructure development globally, particularly in emerging economies, is a key catalyst for sustained demand. Furthermore, the rising focus on sustainable construction practices, which often involve the use of durable and reliable materials like coarse sand, contributes to its market prominence. The market is segmented by particle size, with both 0.5-1mm and above 1mm categories catering to diverse project specifications.

Coarse Sand Market Size (In Billion)
The market's trajectory is further influenced by emerging trends such as the adoption of advanced construction techniques and the increasing utilization of locally sourced aggregates to optimize logistics and costs. However, potential restraints include the environmental impact associated with sand extraction and the regulatory landscape governing its sourcing and transportation. Price volatility of raw materials and the availability of substitutes in certain niche applications could also present challenges. Despite these potential hurdles, the inherent demand for coarse sand in essential construction activities, driven by a growing global population and economic development, ensures a positive outlook. Companies such as Tarmac, Vitax, and Day Aggregates are key players contributing to the market's supply chain and innovation, catering to diverse regional demands across North America, Europe, Asia Pacific, and other significant markets.
Coarse Sand Company Market Share
Coarse Sand Market: Comprehensive Industry Analysis & Future Projections (2019-2033)
This in-depth report offers a meticulous examination of the global Coarse Sand market, providing critical insights for stakeholders involved in its supply, demand, and application. Leveraging a robust study period from 2019 to 2033, with a base year of 2025 and an estimated year of 2025, this analysis delves into historical trends, current market dynamics, and future projections. We cover key segments including Applications like Screed, Render, and Concrete, and Types such as 0.5-1mm and Above 1mm. This report is designed to equip industry professionals with actionable data and strategic guidance to navigate the evolving Coarse Sand landscape.
Coarse Sand Market Structure & Innovation Trends
The Coarse Sand market exhibits a moderately concentrated structure, with key players like Tarmac, Vitax, and Day Aggregates holding significant market share, estimated at over 25% collectively. Innovation is primarily driven by advancements in processing technologies aimed at improving particle size distribution and cleanliness, leading to enhanced performance in concrete and render applications. Regulatory frameworks, particularly concerning environmental impact and extraction permits, play a crucial role in market access and operational costs. While direct product substitutes are limited, alternative aggregates like crushed stone can offer similar functionalities in specific applications, albeit with differing performance characteristics. End-user demographics predominantly comprise construction companies, civil engineering firms, and landscaping professionals. Mergers and acquisitions are a strategic tool for market consolidation, with an estimated total M&A deal value of over xx million in the historical period. Understanding these structural elements is vital for strategic market entry and expansion.
Coarse Sand Market Dynamics & Trends
The global Coarse Sand market is experiencing robust growth, propelled by the insatiable demand from the construction and infrastructure sectors. Fueled by increasing urbanization and significant government investments in public works, the market is poised for sustained expansion. Technological advancements in extraction and processing techniques are enhancing the quality and consistency of coarse sand, making it a preferred material for high-performance concrete and specialized construction applications. Consumer preferences are shifting towards materials that offer durability, longevity, and environmental sustainability, with a growing emphasis on recycled aggregates. Competitive dynamics are characterized by a blend of large, established suppliers and regional players, each vying for market share through competitive pricing, product quality, and efficient distribution networks. The Compound Annual Growth Rate (CAGR) for the Coarse Sand market is projected to be around 4.5%, indicating a healthy upward trajectory. Market penetration is expected to deepen as developing economies continue their infrastructure development, further driving demand for essential construction materials like coarse sand.
Dominant Regions & Segments in Coarse Sand
Asia Pacific stands as the dominant region in the Coarse Sand market, driven by rapid infrastructure development in countries like China and India, coupled with favorable economic policies promoting construction activities. Within this region, China alone accounts for over 30% of the global demand. The 'Concrete' application segment emerges as the leading application, contributing over 50% to the overall market revenue, owing to its widespread use in residential, commercial, and industrial construction projects. The 'Above 1mm' type segment also commands a significant share, preferred for its superior strength and load-bearing capabilities in structural applications. Key drivers for regional dominance include government initiatives for urban renewal and infrastructure upgrades, a burgeoning population necessitating new housing, and significant foreign direct investment in the construction sector. Furthermore, the availability of natural sand deposits and supportive regulatory environments in these leading regions contribute to their market leadership.
Coarse Sand Product Innovations
Product innovations in the Coarse Sand sector are primarily focused on enhancing material quality and sustainability. Developments include advanced washing and screening techniques to achieve specific particle size distributions and reduce impurities, leading to improved workability and strength in concrete mixes. The integration of recycled aggregates derived from construction and demolition waste represents a significant sustainability-driven innovation, offering an environmentally friendly alternative. These advancements provide a competitive advantage by meeting the increasing demand for high-performance, eco-conscious building materials, aligning with global trends in green construction.
Report Scope & Segmentation Analysis
This report comprehensively analyzes the Coarse Sand market across key segments. The 'Screed' application segment, projected to grow at a CAGR of 3.8%, is vital for creating smooth floor bases and levelling compounds. 'Render' applications, with an estimated market size of over xx million, are crucial for wall finishing and protection. The dominant 'Concrete' segment, estimated at over xx million, underpins most construction projects due to its versatility and strength. 'Others' applications, encompassing landscaping and industrial uses, are expected to see moderate growth. In terms of type, '0.5-1mm' sand is preferred for finer finishes, while 'Above 1mm' sand is essential for structural integrity in concrete.
Key Drivers of Coarse Sand Growth
The growth of the Coarse Sand market is significantly propelled by several key factors. Accelerating global infrastructure development, particularly in emerging economies, drives demand for construction materials. Increased urbanization necessitates the construction of residential, commercial, and industrial buildings. Government initiatives focused on housing projects and public infrastructure upgrades further stimulate market expansion. Technological advancements in extraction and processing enhance the quality and availability of coarse sand, making it a more efficient and reliable material for diverse construction needs, thereby fostering consistent market growth.
Challenges in the Coarse Sand Sector
The Coarse Sand sector faces several significant challenges that impact its growth trajectory. Stringent environmental regulations regarding sand extraction and transportation can increase operational costs and limit supply. Supply chain disruptions, often exacerbated by logistical complexities and the localized nature of sand deposits, can lead to price volatility and availability issues. Intense competition from alternative materials and a fragmented market structure can also put pressure on profit margins. Furthermore, fluctuating construction industry demand, dependent on economic cycles, poses a perennial challenge.
Emerging Opportunities in Coarse Sand
Emerging opportunities in the Coarse Sand market lie in the increasing adoption of sustainable construction practices. The development and widespread use of recycled coarse sand aggregates present a significant avenue for growth, catering to the rising demand for eco-friendly building materials. Furthermore, advancements in beneficiation technologies that enhance the quality of lower-grade sand deposits can unlock new supply sources and expand market reach. Growth in prefabricated construction and modular building techniques also creates opportunities for specialized coarse sand products with consistent quality.
Leading Players in the Coarse Sand Market
- Tarmac
- Vitax
- Day Aggregates
- Mainland Aggregates
- J Gard & Sons
- Chalk Down Lime
- Charles Watson (Ironmongers)
- Ashbrook Roofing Supplies
- Lawsons (Whetstone)
- Walton Landscapes Supplies
- A.W. Mobbs
Key Developments in Coarse Sand Industry
- 2023: Introduction of enhanced dust suppression techniques in sand processing operations by multiple leading companies to meet stricter environmental standards.
- 2022: Increased investment in automated screening and grading machinery to improve the consistency of coarse sand particle sizes for high-performance concrete applications.
- 2021: Growing adoption of GPS-enabled tracking for aggregate delivery fleets, optimizing logistics and reducing delivery times.
- 2020: Pilot programs initiated for the utilization of processed construction and demolition waste as a source of recycled coarse sand aggregates.
- 2019: Significant capital expenditure by major players on upgrading washing plants to enhance water efficiency and reduce environmental discharge.
Future Outlook for Coarse Sand Market
The future outlook for the Coarse Sand market remains exceptionally positive, driven by ongoing global urbanization and substantial investments in infrastructure projects. The increasing demand for sustainable building materials will likely spur further innovation in recycled aggregate production and advanced processing techniques. Emerging economies are expected to be key growth accelerators, as they continue to develop their construction sectors. Strategic partnerships and potential consolidation among key players are anticipated, aiming to enhance operational efficiencies and market reach, ensuring sustained market expansion in the coming years.
Coarse Sand Segmentation
-
1. Application
- 1.1. Screed
- 1.2. Render
- 1.3. Concrete
- 1.4. Others
-
2. Type
- 2.1. 0.5-1mm
- 2.2. Above 1mm
Coarse Sand Segmentation By Geography
-
1. North America
- 1.1. United States
- 1.2. Canada
- 1.3. Mexico
-
2. South America
- 2.1. Brazil
- 2.2. Argentina
- 2.3. Rest of South America
-
3. Europe
- 3.1. United Kingdom
- 3.2. Germany
- 3.3. France
- 3.4. Italy
- 3.5. Spain
- 3.6. Russia
- 3.7. Benelux
- 3.8. Nordics
- 3.9. Rest of Europe
-
4. Middle East & Africa
- 4.1. Turkey
- 4.2. Israel
- 4.3. GCC
- 4.4. North Africa
- 4.5. South Africa
- 4.6. Rest of Middle East & Africa
-
5. Asia Pacific
- 5.1. China
- 5.2. India
- 5.3. Japan
- 5.4. South Korea
- 5.5. ASEAN
- 5.6. Oceania
- 5.7. Rest of Asia Pacific
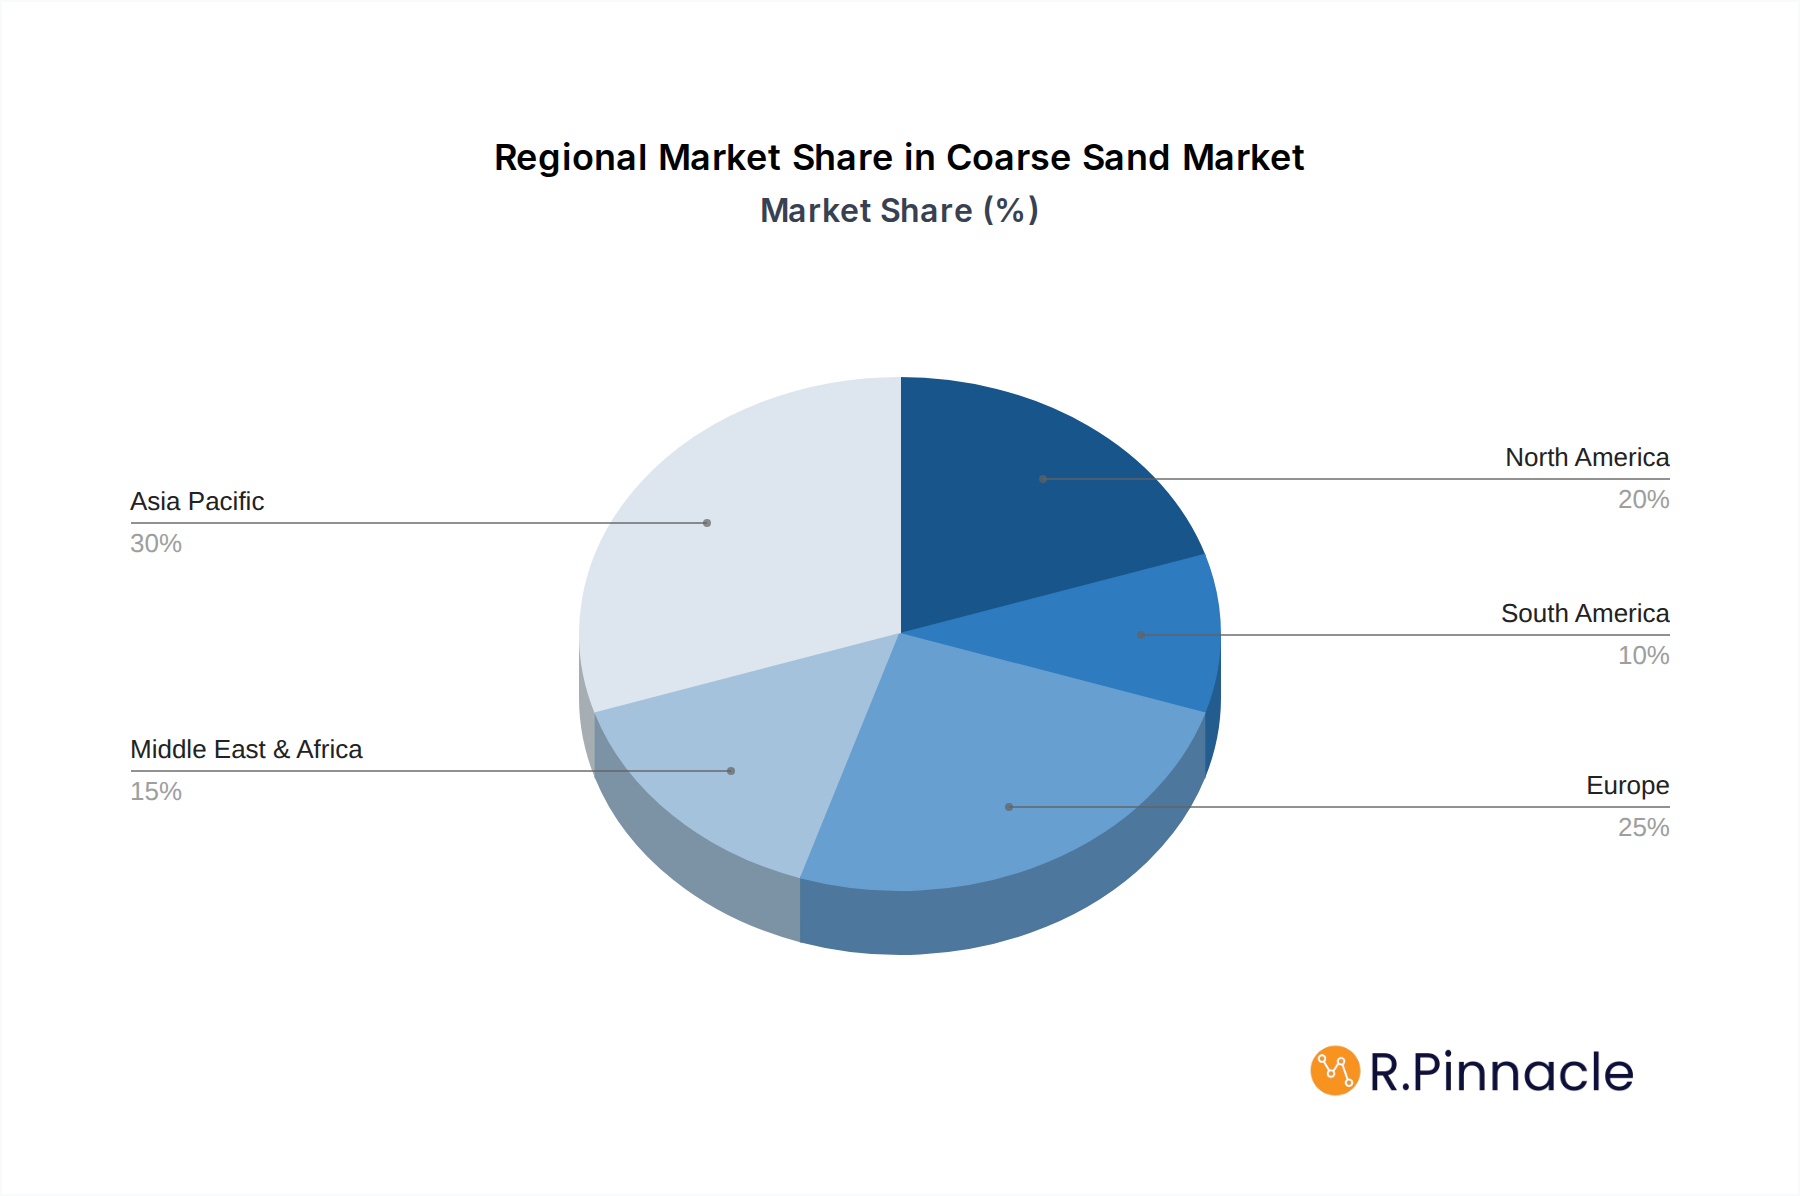
Coarse Sand Regional Market Share
Geographic Coverage of Coarse Sand
Coarse Sand REPORT HIGHLIGHTS
| Aspects | Details |
|---|---|
| Study Period | 2020-2034 |
| Base Year | 2025 |
| Estimated Year | 2026 |
| Forecast Period | 2026-2034 |
| Historical Period | 2020-2025 |
| Growth Rate | CAGR of 9.2% from 2020-2034 |
| Segmentation |
|
Table of Contents
- 1. Introduction
- 1.1. Research Scope
- 1.2. Market Segmentation
- 1.3. Research Methodology
- 1.4. Definitions and Assumptions
- 2. Executive Summary
- 2.1. Introduction
- 3. Market Dynamics
- 3.1. Introduction
- 3.2. Market Drivers
- 3.3. Market Restrains
- 3.4. Market Trends
- 4. Market Factor Analysis
- 4.1. Porters Five Forces
- 4.2. Supply/Value Chain
- 4.3. PESTEL analysis
- 4.4. Market Entropy
- 4.5. Patent/Trademark Analysis
- 5. Global Coarse Sand Analysis, Insights and Forecast, 2020-2032
- 5.1. Market Analysis, Insights and Forecast - by Application
- 5.1.1. Screed
- 5.1.2. Render
- 5.1.3. Concrete
- 5.1.4. Others
- 5.2. Market Analysis, Insights and Forecast - by Type
- 5.2.1. 0.5-1mm
- 5.2.2. Above 1mm
- 5.3. Market Analysis, Insights and Forecast - by Region
- 5.3.1. North America
- 5.3.2. South America
- 5.3.3. Europe
- 5.3.4. Middle East & Africa
- 5.3.5. Asia Pacific
- 5.1. Market Analysis, Insights and Forecast - by Application
- 6. North America Coarse Sand Analysis, Insights and Forecast, 2020-2032
- 6.1. Market Analysis, Insights and Forecast - by Application
- 6.1.1. Screed
- 6.1.2. Render
- 6.1.3. Concrete
- 6.1.4. Others
- 6.2. Market Analysis, Insights and Forecast - by Type
- 6.2.1. 0.5-1mm
- 6.2.2. Above 1mm
- 6.1. Market Analysis, Insights and Forecast - by Application
- 7. South America Coarse Sand Analysis, Insights and Forecast, 2020-2032
- 7.1. Market Analysis, Insights and Forecast - by Application
- 7.1.1. Screed
- 7.1.2. Render
- 7.1.3. Concrete
- 7.1.4. Others
- 7.2. Market Analysis, Insights and Forecast - by Type
- 7.2.1. 0.5-1mm
- 7.2.2. Above 1mm
- 7.1. Market Analysis, Insights and Forecast - by Application
- 8. Europe Coarse Sand Analysis, Insights and Forecast, 2020-2032
- 8.1. Market Analysis, Insights and Forecast - by Application
- 8.1.1. Screed
- 8.1.2. Render
- 8.1.3. Concrete
- 8.1.4. Others
- 8.2. Market Analysis, Insights and Forecast - by Type
- 8.2.1. 0.5-1mm
- 8.2.2. Above 1mm
- 8.1. Market Analysis, Insights and Forecast - by Application
- 9. Middle East & Africa Coarse Sand Analysis, Insights and Forecast, 2020-2032
- 9.1. Market Analysis, Insights and Forecast - by Application
- 9.1.1. Screed
- 9.1.2. Render
- 9.1.3. Concrete
- 9.1.4. Others
- 9.2. Market Analysis, Insights and Forecast - by Type
- 9.2.1. 0.5-1mm
- 9.2.2. Above 1mm
- 9.1. Market Analysis, Insights and Forecast - by Application
- 10. Asia Pacific Coarse Sand Analysis, Insights and Forecast, 2020-2032
- 10.1. Market Analysis, Insights and Forecast - by Application
- 10.1.1. Screed
- 10.1.2. Render
- 10.1.3. Concrete
- 10.1.4. Others
- 10.2. Market Analysis, Insights and Forecast - by Type
- 10.2.1. 0.5-1mm
- 10.2.2. Above 1mm
- 10.1. Market Analysis, Insights and Forecast - by Application
- 11. Competitive Analysis
- 11.1. Global Market Share Analysis 2025
- 11.2. Company Profiles
- 11.2.1 Tarmac
- 11.2.1.1. Overview
- 11.2.1.2. Products
- 11.2.1.3. SWOT Analysis
- 11.2.1.4. Recent Developments
- 11.2.1.5. Financials (Based on Availability)
- 11.2.2 Vitax
- 11.2.2.1. Overview
- 11.2.2.2. Products
- 11.2.2.3. SWOT Analysis
- 11.2.2.4. Recent Developments
- 11.2.2.5. Financials (Based on Availability)
- 11.2.3 Day Aggregates
- 11.2.3.1. Overview
- 11.2.3.2. Products
- 11.2.3.3. SWOT Analysis
- 11.2.3.4. Recent Developments
- 11.2.3.5. Financials (Based on Availability)
- 11.2.4 Mainland Aggregates
- 11.2.4.1. Overview
- 11.2.4.2. Products
- 11.2.4.3. SWOT Analysis
- 11.2.4.4. Recent Developments
- 11.2.4.5. Financials (Based on Availability)
- 11.2.5 J Gard & Sons
- 11.2.5.1. Overview
- 11.2.5.2. Products
- 11.2.5.3. SWOT Analysis
- 11.2.5.4. Recent Developments
- 11.2.5.5. Financials (Based on Availability)
- 11.2.6 Chalk Down Lime
- 11.2.6.1. Overview
- 11.2.6.2. Products
- 11.2.6.3. SWOT Analysis
- 11.2.6.4. Recent Developments
- 11.2.6.5. Financials (Based on Availability)
- 11.2.7 Charles Watson (Ironmongers)
- 11.2.7.1. Overview
- 11.2.7.2. Products
- 11.2.7.3. SWOT Analysis
- 11.2.7.4. Recent Developments
- 11.2.7.5. Financials (Based on Availability)
- 11.2.8 Ashbrook Roofing Supplies
- 11.2.8.1. Overview
- 11.2.8.2. Products
- 11.2.8.3. SWOT Analysis
- 11.2.8.4. Recent Developments
- 11.2.8.5. Financials (Based on Availability)
- 11.2.9 Lawsons (Whetstone)
- 11.2.9.1. Overview
- 11.2.9.2. Products
- 11.2.9.3. SWOT Analysis
- 11.2.9.4. Recent Developments
- 11.2.9.5. Financials (Based on Availability)
- 11.2.10 Walton Landscapes Supplies
- 11.2.10.1. Overview
- 11.2.10.2. Products
- 11.2.10.3. SWOT Analysis
- 11.2.10.4. Recent Developments
- 11.2.10.5. Financials (Based on Availability)
- 11.2.11 A.W. Mobbs
- 11.2.11.1. Overview
- 11.2.11.2. Products
- 11.2.11.3. SWOT Analysis
- 11.2.11.4. Recent Developments
- 11.2.11.5. Financials (Based on Availability)
- 11.2.1 Tarmac
List of Figures
- Figure 1: Global Coarse Sand Revenue Breakdown (million, %) by Region 2025 & 2033
- Figure 2: North America Coarse Sand Revenue (million), by Application 2025 & 2033
- Figure 3: North America Coarse Sand Revenue Share (%), by Application 2025 & 2033
- Figure 4: North America Coarse Sand Revenue (million), by Type 2025 & 2033
- Figure 5: North America Coarse Sand Revenue Share (%), by Type 2025 & 2033
- Figure 6: North America Coarse Sand Revenue (million), by Country 2025 & 2033
- Figure 7: North America Coarse Sand Revenue Share (%), by Country 2025 & 2033
- Figure 8: South America Coarse Sand Revenue (million), by Application 2025 & 2033
- Figure 9: South America Coarse Sand Revenue Share (%), by Application 2025 & 2033
- Figure 10: South America Coarse Sand Revenue (million), by Type 2025 & 2033
- Figure 11: South America Coarse Sand Revenue Share (%), by Type 2025 & 2033
- Figure 12: South America Coarse Sand Revenue (million), by Country 2025 & 2033
- Figure 13: South America Coarse Sand Revenue Share (%), by Country 2025 & 2033
- Figure 14: Europe Coarse Sand Revenue (million), by Application 2025 & 2033
- Figure 15: Europe Coarse Sand Revenue Share (%), by Application 2025 & 2033
- Figure 16: Europe Coarse Sand Revenue (million), by Type 2025 & 2033
- Figure 17: Europe Coarse Sand Revenue Share (%), by Type 2025 & 2033
- Figure 18: Europe Coarse Sand Revenue (million), by Country 2025 & 2033
- Figure 19: Europe Coarse Sand Revenue Share (%), by Country 2025 & 2033
- Figure 20: Middle East & Africa Coarse Sand Revenue (million), by Application 2025 & 2033
- Figure 21: Middle East & Africa Coarse Sand Revenue Share (%), by Application 2025 & 2033
- Figure 22: Middle East & Africa Coarse Sand Revenue (million), by Type 2025 & 2033
- Figure 23: Middle East & Africa Coarse Sand Revenue Share (%), by Type 2025 & 2033
- Figure 24: Middle East & Africa Coarse Sand Revenue (million), by Country 2025 & 2033
- Figure 25: Middle East & Africa Coarse Sand Revenue Share (%), by Country 2025 & 2033
- Figure 26: Asia Pacific Coarse Sand Revenue (million), by Application 2025 & 2033
- Figure 27: Asia Pacific Coarse Sand Revenue Share (%), by Application 2025 & 2033
- Figure 28: Asia Pacific Coarse Sand Revenue (million), by Type 2025 & 2033
- Figure 29: Asia Pacific Coarse Sand Revenue Share (%), by Type 2025 & 2033
- Figure 30: Asia Pacific Coarse Sand Revenue (million), by Country 2025 & 2033
- Figure 31: Asia Pacific Coarse Sand Revenue Share (%), by Country 2025 & 2033
List of Tables
- Table 1: Global Coarse Sand Revenue million Forecast, by Application 2020 & 2033
- Table 2: Global Coarse Sand Revenue million Forecast, by Type 2020 & 2033
- Table 3: Global Coarse Sand Revenue million Forecast, by Region 2020 & 2033
- Table 4: Global Coarse Sand Revenue million Forecast, by Application 2020 & 2033
- Table 5: Global Coarse Sand Revenue million Forecast, by Type 2020 & 2033
- Table 6: Global Coarse Sand Revenue million Forecast, by Country 2020 & 2033
- Table 7: United States Coarse Sand Revenue (million) Forecast, by Application 2020 & 2033
- Table 8: Canada Coarse Sand Revenue (million) Forecast, by Application 2020 & 2033
- Table 9: Mexico Coarse Sand Revenue (million) Forecast, by Application 2020 & 2033
- Table 10: Global Coarse Sand Revenue million Forecast, by Application 2020 & 2033
- Table 11: Global Coarse Sand Revenue million Forecast, by Type 2020 & 2033
- Table 12: Global Coarse Sand Revenue million Forecast, by Country 2020 & 2033
- Table 13: Brazil Coarse Sand Revenue (million) Forecast, by Application 2020 & 2033
- Table 14: Argentina Coarse Sand Revenue (million) Forecast, by Application 2020 & 2033
- Table 15: Rest of South America Coarse Sand Revenue (million) Forecast, by Application 2020 & 2033
- Table 16: Global Coarse Sand Revenue million Forecast, by Application 2020 & 2033
- Table 17: Global Coarse Sand Revenue million Forecast, by Type 2020 & 2033
- Table 18: Global Coarse Sand Revenue million Forecast, by Country 2020 & 2033
- Table 19: United Kingdom Coarse Sand Revenue (million) Forecast, by Application 2020 & 2033
- Table 20: Germany Coarse Sand Revenue (million) Forecast, by Application 2020 & 2033
- Table 21: France Coarse Sand Revenue (million) Forecast, by Application 2020 & 2033
- Table 22: Italy Coarse Sand Revenue (million) Forecast, by Application 2020 & 2033
- Table 23: Spain Coarse Sand Revenue (million) Forecast, by Application 2020 & 2033
- Table 24: Russia Coarse Sand Revenue (million) Forecast, by Application 2020 & 2033
- Table 25: Benelux Coarse Sand Revenue (million) Forecast, by Application 2020 & 2033
- Table 26: Nordics Coarse Sand Revenue (million) Forecast, by Application 2020 & 2033
- Table 27: Rest of Europe Coarse Sand Revenue (million) Forecast, by Application 2020 & 2033
- Table 28: Global Coarse Sand Revenue million Forecast, by Application 2020 & 2033
- Table 29: Global Coarse Sand Revenue million Forecast, by Type 2020 & 2033
- Table 30: Global Coarse Sand Revenue million Forecast, by Country 2020 & 2033
- Table 31: Turkey Coarse Sand Revenue (million) Forecast, by Application 2020 & 2033
- Table 32: Israel Coarse Sand Revenue (million) Forecast, by Application 2020 & 2033
- Table 33: GCC Coarse Sand Revenue (million) Forecast, by Application 2020 & 2033
- Table 34: North Africa Coarse Sand Revenue (million) Forecast, by Application 2020 & 2033
- Table 35: South Africa Coarse Sand Revenue (million) Forecast, by Application 2020 & 2033
- Table 36: Rest of Middle East & Africa Coarse Sand Revenue (million) Forecast, by Application 2020 & 2033
- Table 37: Global Coarse Sand Revenue million Forecast, by Application 2020 & 2033
- Table 38: Global Coarse Sand Revenue million Forecast, by Type 2020 & 2033
- Table 39: Global Coarse Sand Revenue million Forecast, by Country 2020 & 2033
- Table 40: China Coarse Sand Revenue (million) Forecast, by Application 2020 & 2033
- Table 41: India Coarse Sand Revenue (million) Forecast, by Application 2020 & 2033
- Table 42: Japan Coarse Sand Revenue (million) Forecast, by Application 2020 & 2033
- Table 43: South Korea Coarse Sand Revenue (million) Forecast, by Application 2020 & 2033
- Table 44: ASEAN Coarse Sand Revenue (million) Forecast, by Application 2020 & 2033
- Table 45: Oceania Coarse Sand Revenue (million) Forecast, by Application 2020 & 2033
- Table 46: Rest of Asia Pacific Coarse Sand Revenue (million) Forecast, by Application 2020 & 2033
Frequently Asked Questions
1. What is the projected Compound Annual Growth Rate (CAGR) of the Coarse Sand?
The projected CAGR is approximately 9.2%.
2. Which companies are prominent players in the Coarse Sand?
Key companies in the market include Tarmac, Vitax, Day Aggregates, Mainland Aggregates, J Gard & Sons, Chalk Down Lime, Charles Watson (Ironmongers), Ashbrook Roofing Supplies, Lawsons (Whetstone), Walton Landscapes Supplies, A.W. Mobbs.
3. What are the main segments of the Coarse Sand?
The market segments include Application, Type.
4. Can you provide details about the market size?
The market size is estimated to be USD 15450 million as of 2022.
5. What are some drivers contributing to market growth?
N/A
6. What are the notable trends driving market growth?
N/A
7. Are there any restraints impacting market growth?
N/A
8. Can you provide examples of recent developments in the market?
N/A
9. What pricing options are available for accessing the report?
Pricing options include single-user, multi-user, and enterprise licenses priced at USD 2900.00, USD 4350.00, and USD 5800.00 respectively.
10. Is the market size provided in terms of value or volume?
The market size is provided in terms of value, measured in million.
11. Are there any specific market keywords associated with the report?
Yes, the market keyword associated with the report is "Coarse Sand," which aids in identifying and referencing the specific market segment covered.
12. How do I determine which pricing option suits my needs best?
The pricing options vary based on user requirements and access needs. Individual users may opt for single-user licenses, while businesses requiring broader access may choose multi-user or enterprise licenses for cost-effective access to the report.
13. Are there any additional resources or data provided in the Coarse Sand report?
While the report offers comprehensive insights, it's advisable to review the specific contents or supplementary materials provided to ascertain if additional resources or data are available.
14. How can I stay updated on further developments or reports in the Coarse Sand?
To stay informed about further developments, trends, and reports in the Coarse Sand, consider subscribing to industry newsletters, following relevant companies and organizations, or regularly checking reputable industry news sources and publications.
Methodology
Step 1 - Identification of Relevant Samples Size from Population Database


Step 2 - Approaches for Defining Global Market Size (Value, Volume* & Price*)

Note*: In applicable scenarios
Step 3 - Data Sources
Primary Research
- Web Analytics
- Survey Reports
- Research Institute
- Latest Research Reports
- Opinion Leaders
Secondary Research
- Annual Reports
- White Paper
- Latest Press Release
- Industry Association
- Paid Database
- Investor Presentations

Step 4 - Data Triangulation
Involves using different sources of information in order to increase the validity of a study
These sources are likely to be stakeholders in a program - participants, other researchers, program staff, other community members, and so on.
Then we put all data in single framework & apply various statistical tools to find out the dynamic on the market.
During the analysis stage, feedback from the stakeholder groups would be compared to determine areas of agreement as well as areas of divergence

