Key Insights
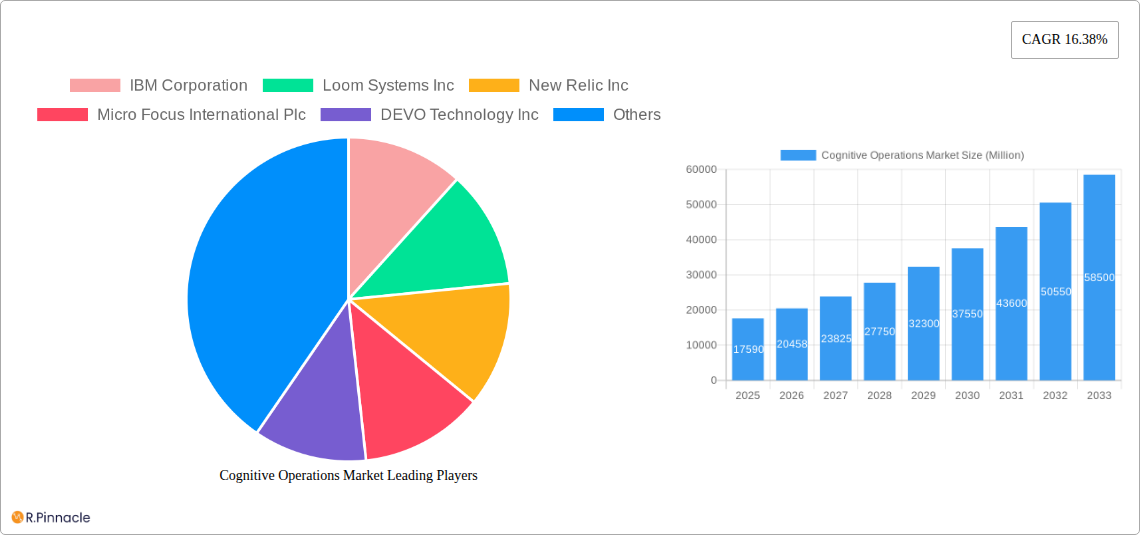
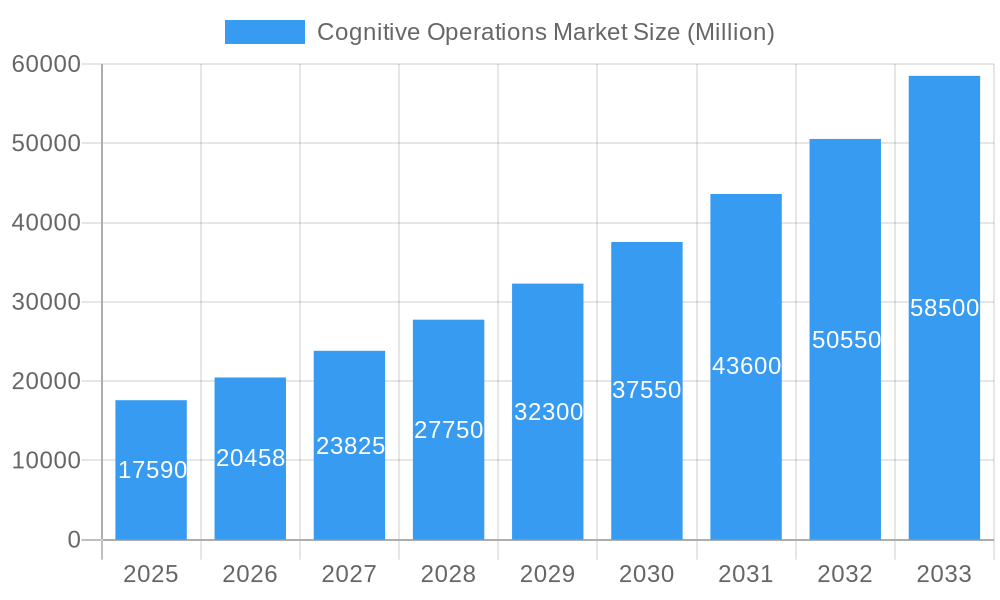
The Cognitive Operations market is experiencing robust growth, projected to reach $17.59 billion in 2025 and maintain a Compound Annual Growth Rate (CAGR) of 16.38% from 2025 to 2033. This expansion is fueled by several key drivers. The increasing complexity of IT infrastructure, coupled with the growing volume of operational data, necessitates intelligent automation and predictive analytics. Businesses are increasingly adopting cloud-based solutions for improved scalability, agility, and cost optimization, further driving market growth. Furthermore, the rising demand for enhanced security and application performance management, especially within sectors like BFSI, Healthcare & Life Sciences, and IT & Telecom, is significantly contributing to market expansion. The shift towards proactive IT management, enabled by cognitive operations, allows organizations to anticipate and resolve issues before they impact business operations, thus minimizing downtime and maximizing operational efficiency. This proactive approach is becoming increasingly crucial in today's digitally driven business environment.
Cognitive Operations Market Market Size (In Billion)
The market segmentation reveals diverse opportunities. Cloud-based deployment modes are gaining significant traction due to their inherent flexibility and cost-effectiveness. Large enterprises are currently leading adoption, however, the increasing digitalization among Small and Medium-Sized Enterprises (SMEs) presents a significant untapped market potential. Application-wise, IT Operations Analytics, Application Performance Management, and Security Analytics are currently dominant segments, but the increasing adoption of Infrastructure Management and other emerging applications, fueled by AI and machine learning advancements, are poised for considerable future growth. Geographically, North America is expected to maintain a leading market share due to early adoption and the presence of major technology players. However, Asia Pacific is projected to witness rapid growth due to increasing digital transformation initiatives and expanding IT infrastructure across the region. Key players like IBM, Splunk, and Dynatrace are strategically positioning themselves to capitalize on these market dynamics through innovation and acquisitions.
Cognitive Operations Market Company Market Share
Cognitive Operations Market Report: A Comprehensive Analysis (2019-2033)
This in-depth report provides a comprehensive analysis of the Cognitive Operations Market, offering invaluable insights for industry professionals, investors, and strategic decision-makers. With a detailed study period spanning from 2019 to 2033, including a base year of 2025 and forecast period of 2025-2033, this report leverages extensive market research to deliver actionable intelligence on market size, segmentation, growth drivers, challenges, and future opportunities. The market is projected to reach xx Million by 2033, exhibiting a CAGR of xx% during the forecast period.
Cognitive Operations Market Structure & Innovation Trends
This section analyzes the competitive landscape, innovation drivers, and regulatory factors shaping the Cognitive Operations Market. The market exhibits a moderately concentrated structure, with key players like IBM Corporation, Loom Systems Inc, New Relic Inc, and Splunk Inc holding significant market share. However, the emergence of innovative startups and the increasing adoption of cloud-based solutions are fostering competition.
- Market Concentration: The top 5 players account for approximately xx% of the global market share in 2025. This is expected to slightly decrease to xx% by 2033 due to increased competition.
- Innovation Drivers: Advancements in AI, machine learning, and big data analytics are driving innovation, leading to the development of more sophisticated cognitive operations solutions. The demand for improved operational efficiency and reduced costs further fuels innovation.
- Regulatory Frameworks: Government regulations regarding data privacy and security are influencing market dynamics, necessitating compliance with standards like GDPR and CCPA.
- Product Substitutes: Traditional IT operations management tools are facing increasing substitution by cognitive operations solutions due to their superior capabilities in automation and predictive analysis.
- End-User Demographics: Large enterprises are currently the dominant segment, but the adoption rate among SMEs is growing steadily.
- M&A Activities: The market has witnessed several significant M&A activities in recent years, with deal values totaling approximately xx Million in 2024. These acquisitions are driven by companies' efforts to expand their product portfolios and enhance their market position.
Cognitive Operations Market Dynamics & Trends
The Cognitive Operations Market is experiencing robust growth driven by several key factors. The increasing volume and complexity of data, coupled with the need for real-time insights and automation, are pushing organizations to adopt cognitive solutions. Technological disruptions such as the rise of AI and the increasing adoption of cloud computing are accelerating market growth. Consumer preferences for enhanced user experience and seamless service delivery are further driving demand. Intense competition among vendors is leading to innovation and price optimization, making cognitive operations solutions more accessible.
Dominant Regions & Segments in Cognitive Operations Market
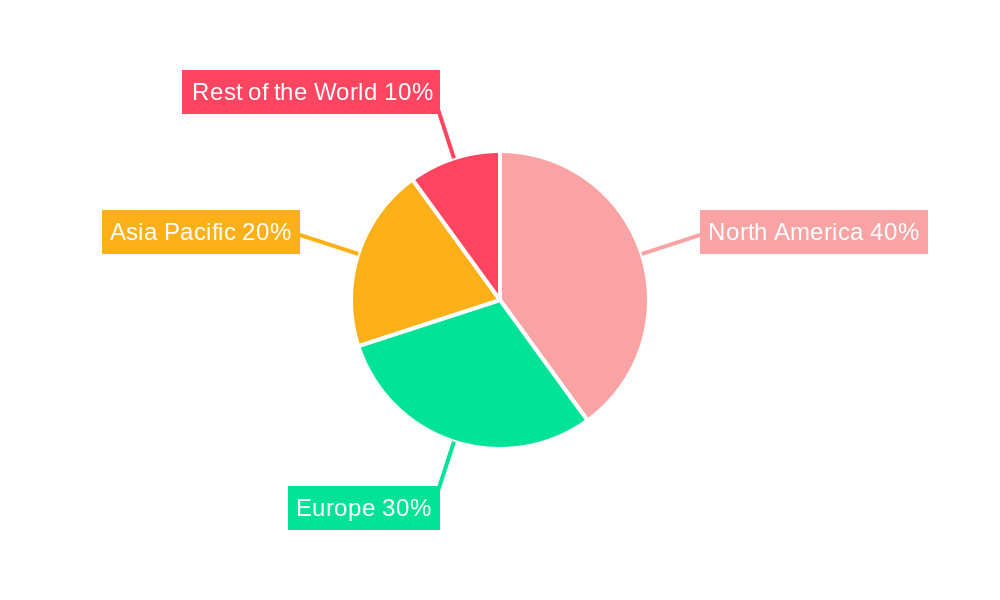
North America currently dominates the Cognitive Operations Market, driven by high technology adoption rates and a strong presence of leading vendors. However, the Asia-Pacific region is expected to experience significant growth in the coming years due to increasing digitalization and rising IT spending.
- Leading Regions: North America (xx% market share in 2025), followed by Europe and Asia-Pacific.
- Dominant Segments:
- Component: Solutions segment holds a larger market share compared to Services, driven by the increasing demand for sophisticated software tools.
- Deployment Mode: Cloud deployment is gaining traction due to its scalability and cost-effectiveness, surpassing On-Premises deployments.
- Enterprise Size: Large Enterprises dominate the market due to their higher IT budgets and complex operational needs. However, SMEs are showing increased adoption.
- Application: IT Operations Analytics and Application Performance Management are the most widely adopted applications, followed by Network Analytics and Security Analytics. Infrastructure Management is also gaining momentum.
- Industry Vertical: BFSI and IT & Telecom sectors are early adopters, but Healthcare & Life Sciences and Retail & E-commerce are emerging as significant growth markets.
Key drivers include supportive government policies, robust IT infrastructure, and the presence of key players in specific regions.
Cognitive Operations Market Product Innovations
Recent product innovations are focused on enhancing the capabilities of cognitive operations solutions by integrating AI, Machine Learning, and advanced analytics. This leads to improved automation, predictive maintenance, and proactive problem-solving capabilities. New applications are emerging across different industry verticals, expanding the market reach and driving further growth. Key competitive advantages include superior analytics capabilities, ease of integration with existing systems, and robust security features.
Report Scope & Segmentation Analysis
This report covers the Cognitive Operations Market segmented by Component (Solutions, Services), Deployment Mode (Cloud, On-Premise), Enterprise Size (Large Enterprises, SMEs), Application (IT Operations Analytics, Application Performance Management, Network Analytics, Security Analytics, Infrastructure Management, Other Applications), and Industry Vertical (BFSI, Healthcare & Life Sciences, IT & Telecom, Retail & E-commerce, Other Industry Verticals). Each segment's growth projection, market size, and competitive dynamics are analyzed in detail. For instance, the Cloud deployment segment is predicted to witness faster growth than On-Premise due to its flexibility and cost-effectiveness. Similarly, the IT Operations Analytics application is expected to maintain a dominant market share.
Key Drivers of Cognitive Operations Market Growth
The Cognitive Operations Market is driven by the increasing need for improved operational efficiency, reduced costs, and enhanced security. Technological advancements, especially in AI and machine learning, are critical enablers. Furthermore, the growing adoption of cloud computing and the rising volume of data are contributing to the market’s growth. Supportive government policies and increasing investments in digital transformation initiatives across various industries further fuel market expansion.
Challenges in the Cognitive Operations Market Sector
Challenges include the high initial investment costs associated with implementing cognitive operations solutions, integration complexities with existing IT infrastructure, and the need for skilled personnel. Data security and privacy concerns, along with the potential for vendor lock-in, pose further challenges. Competitive pressures among vendors also impact pricing and market share.
Emerging Opportunities in Cognitive Operations Market
Emerging opportunities lie in expanding into new industry verticals, particularly in sectors like manufacturing and energy. The development of specialized cognitive solutions for specific operational needs presents significant growth potential. Integration with IoT devices and the use of edge computing are emerging trends that are shaping future market opportunities. The increasing focus on sustainability and operational resilience presents further avenues for growth.
Leading Players in the Cognitive Operations Market Market
- IBM Corporation
- Loom Systems Inc
- New Relic Inc
- Micro Focus International Plc
- DEVO Technology Inc
- Broadcom Inc
- ScienceLogic Inc
- CloudFabrix Software Inc
- BMC Software Inc
- Correlata Solutions Inc
- Servicenow Inc
- Interlink Software Services Ltd
- VMware Inc
- Splunk Inc
- Dynatrace LLC
- HCL Technologies Limited
Key Developments in Cognitive Operations Market Industry
- March 2023: TCS launched its Cognitive Plant Operations Adviser, leveraging AI and machine learning for improved manufacturing efficiency and resilience.
- October 2022: Saudi Telecom Company (STC) partnered with Ericsson to implement AI-based cognitive software solutions for enhanced network optimization and improved subscriber experience.
Future Outlook for Cognitive Operations Market Market
The Cognitive Operations Market is poised for substantial growth in the coming years, driven by continuous technological advancements, increasing adoption across various industries, and the rising need for efficient and resilient operations. Strategic partnerships, product innovations, and expansion into emerging markets will be key factors in shaping the future of this dynamic market. The market's potential is immense, particularly in leveraging AI for predictive maintenance and proactive problem resolution.
Cognitive Operations Market Segmentation
-
1. Component
- 1.1. Solutions
- 1.2. Services
-
2. Deployment Mode
- 2.1. Cloud
- 2.2. On-Premises
-
3. Enterprise Size
- 3.1. Large Enterprises
- 3.2. Small and Medium-Sized Enterprises
-
4. Application
- 4.1. IT Operations Analytics
- 4.2. Application Performance Management
- 4.3. Network Analytics
- 4.4. Security Analytics
- 4.5. Infrastructure Management
- 4.6. Other Applications
-
5. Industry Vertical
- 5.1. BFSI
- 5.2. Healthcare & Life Sciences
- 5.3. IT & Telecom
- 5.4. Retail & E-commerce
- 5.5. Other Industry Verticals
Cognitive Operations Market Segmentation By Geography
- 1. North America
- 2. Europe
- 3. Asia Pacific
- 4. Rest of the World
Cognitive Operations Market Regional Market Share
Geographic Coverage of Cognitive Operations Market
Cognitive Operations Market REPORT HIGHLIGHTS
| Aspects | Details |
|---|---|
| Study Period | 2020-2034 |
| Base Year | 2025 |
| Estimated Year | 2026 |
| Forecast Period | 2026-2034 |
| Historical Period | 2020-2025 |
| Growth Rate | CAGR of 16.38% from 2020-2034 |
| Segmentation |
|
Table of Contents
- 1. Introduction
- 1.1. Research Scope
- 1.2. Market Segmentation
- 1.3. Research Objective
- 1.4. Definitions and Assumptions
- 2. Executive Summary
- 2.1. Market Snapshot
- 3. Market Dynamics
- 3.1. Market Drivers
- 3.2. Market Restrains
- 3.3. Market Trends
- 3.4. Market Opportunities
- 4. Market Factor Analysis
- 4.1. Porters Five Forces
- 4.1.1. Bargaining Power of Suppliers
- 4.1.2. Bargaining Power of Buyers
- 4.1.3. Threat of New Entrants
- 4.1.4. Threat of Substitutes
- 4.1.5. Competitive Rivalry
- 4.2. PESTEL analysis
- 4.3. BCG Analysis
- 4.3.1. Stars (High Growth, High Market Share)
- 4.3.2. Cash Cows (Low Growth, High Market Share)
- 4.3.3. Question Mark (High Growth, Low Market Share)
- 4.3.4. Dogs (Low Growth, Low Market Share)
- 4.4. Ansoff Matrix Analysis
- 4.5. Supply Chain Analysis
- 4.6. Regulatory Landscape
- 4.7. Current Market Potential and Opportunity Assessment (TAM–SAM–SOM Framework)
- 4.8. PRI Analyst Note
- 4.1. Porters Five Forces
- 5. Market Analysis, Insights and Forecast 2021-2033
- 5.1. Market Analysis, Insights and Forecast - by Component
- 5.1.1. Solutions
- 5.1.2. Services
- 5.2. Market Analysis, Insights and Forecast - by Deployment Mode
- 5.2.1. Cloud
- 5.2.2. On-Premises
- 5.3. Market Analysis, Insights and Forecast - by Enterprise Size
- 5.3.1. Large Enterprises
- 5.3.2. Small and Medium-Sized Enterprises
- 5.4. Market Analysis, Insights and Forecast - by Application
- 5.4.1. IT Operations Analytics
- 5.4.2. Application Performance Management
- 5.4.3. Network Analytics
- 5.4.4. Security Analytics
- 5.4.5. Infrastructure Management
- 5.4.6. Other Applications
- 5.5. Market Analysis, Insights and Forecast - by Industry Vertical
- 5.5.1. BFSI
- 5.5.2. Healthcare & Life Sciences
- 5.5.3. IT & Telecom
- 5.5.4. Retail & E-commerce
- 5.5.5. Other Industry Verticals
- 5.6. Market Analysis, Insights and Forecast - by Region
- 5.6.1. North America
- 5.6.2. Europe
- 5.6.3. Asia Pacific
- 5.6.4. Rest of the World
- 5.1. Market Analysis, Insights and Forecast - by Component
- 6. Global Cognitive Operations Market Analysis, Insights and Forecast, 2021-2033
- 6.1. Market Analysis, Insights and Forecast - by Component
- 6.1.1. Solutions
- 6.1.2. Services
- 6.2. Market Analysis, Insights and Forecast - by Deployment Mode
- 6.2.1. Cloud
- 6.2.2. On-Premises
- 6.3. Market Analysis, Insights and Forecast - by Enterprise Size
- 6.3.1. Large Enterprises
- 6.3.2. Small and Medium-Sized Enterprises
- 6.4. Market Analysis, Insights and Forecast - by Application
- 6.4.1. IT Operations Analytics
- 6.4.2. Application Performance Management
- 6.4.3. Network Analytics
- 6.4.4. Security Analytics
- 6.4.5. Infrastructure Management
- 6.4.6. Other Applications
- 6.5. Market Analysis, Insights and Forecast - by Industry Vertical
- 6.5.1. BFSI
- 6.5.2. Healthcare & Life Sciences
- 6.5.3. IT & Telecom
- 6.5.4. Retail & E-commerce
- 6.5.5. Other Industry Verticals
- 6.1. Market Analysis, Insights and Forecast - by Component
- 7. North America Cognitive Operations Market Analysis, Insights and Forecast, 2020-2032
- 7.1. Market Analysis, Insights and Forecast - by Component
- 7.1.1. Solutions
- 7.1.2. Services
- 7.2. Market Analysis, Insights and Forecast - by Deployment Mode
- 7.2.1. Cloud
- 7.2.2. On-Premises
- 7.3. Market Analysis, Insights and Forecast - by Enterprise Size
- 7.3.1. Large Enterprises
- 7.3.2. Small and Medium-Sized Enterprises
- 7.4. Market Analysis, Insights and Forecast - by Application
- 7.4.1. IT Operations Analytics
- 7.4.2. Application Performance Management
- 7.4.3. Network Analytics
- 7.4.4. Security Analytics
- 7.4.5. Infrastructure Management
- 7.4.6. Other Applications
- 7.5. Market Analysis, Insights and Forecast - by Industry Vertical
- 7.5.1. BFSI
- 7.5.2. Healthcare & Life Sciences
- 7.5.3. IT & Telecom
- 7.5.4. Retail & E-commerce
- 7.5.5. Other Industry Verticals
- 7.1. Market Analysis, Insights and Forecast - by Component
- 8. Europe Cognitive Operations Market Analysis, Insights and Forecast, 2020-2032
- 8.1. Market Analysis, Insights and Forecast - by Component
- 8.1.1. Solutions
- 8.1.2. Services
- 8.2. Market Analysis, Insights and Forecast - by Deployment Mode
- 8.2.1. Cloud
- 8.2.2. On-Premises
- 8.3. Market Analysis, Insights and Forecast - by Enterprise Size
- 8.3.1. Large Enterprises
- 8.3.2. Small and Medium-Sized Enterprises
- 8.4. Market Analysis, Insights and Forecast - by Application
- 8.4.1. IT Operations Analytics
- 8.4.2. Application Performance Management
- 8.4.3. Network Analytics
- 8.4.4. Security Analytics
- 8.4.5. Infrastructure Management
- 8.4.6. Other Applications
- 8.5. Market Analysis, Insights and Forecast - by Industry Vertical
- 8.5.1. BFSI
- 8.5.2. Healthcare & Life Sciences
- 8.5.3. IT & Telecom
- 8.5.4. Retail & E-commerce
- 8.5.5. Other Industry Verticals
- 8.1. Market Analysis, Insights and Forecast - by Component
- 9. Asia Pacific Cognitive Operations Market Analysis, Insights and Forecast, 2020-2032
- 9.1. Market Analysis, Insights and Forecast - by Component
- 9.1.1. Solutions
- 9.1.2. Services
- 9.2. Market Analysis, Insights and Forecast - by Deployment Mode
- 9.2.1. Cloud
- 9.2.2. On-Premises
- 9.3. Market Analysis, Insights and Forecast - by Enterprise Size
- 9.3.1. Large Enterprises
- 9.3.2. Small and Medium-Sized Enterprises
- 9.4. Market Analysis, Insights and Forecast - by Application
- 9.4.1. IT Operations Analytics
- 9.4.2. Application Performance Management
- 9.4.3. Network Analytics
- 9.4.4. Security Analytics
- 9.4.5. Infrastructure Management
- 9.4.6. Other Applications
- 9.5. Market Analysis, Insights and Forecast - by Industry Vertical
- 9.5.1. BFSI
- 9.5.2. Healthcare & Life Sciences
- 9.5.3. IT & Telecom
- 9.5.4. Retail & E-commerce
- 9.5.5. Other Industry Verticals
- 9.1. Market Analysis, Insights and Forecast - by Component
- 10. Rest of the World Cognitive Operations Market Analysis, Insights and Forecast, 2020-2032
- 10.1. Market Analysis, Insights and Forecast - by Component
- 10.1.1. Solutions
- 10.1.2. Services
- 10.2. Market Analysis, Insights and Forecast - by Deployment Mode
- 10.2.1. Cloud
- 10.2.2. On-Premises
- 10.3. Market Analysis, Insights and Forecast - by Enterprise Size
- 10.3.1. Large Enterprises
- 10.3.2. Small and Medium-Sized Enterprises
- 10.4. Market Analysis, Insights and Forecast - by Application
- 10.4.1. IT Operations Analytics
- 10.4.2. Application Performance Management
- 10.4.3. Network Analytics
- 10.4.4. Security Analytics
- 10.4.5. Infrastructure Management
- 10.4.6. Other Applications
- 10.5. Market Analysis, Insights and Forecast - by Industry Vertical
- 10.5.1. BFSI
- 10.5.2. Healthcare & Life Sciences
- 10.5.3. IT & Telecom
- 10.5.4. Retail & E-commerce
- 10.5.5. Other Industry Verticals
- 10.1. Market Analysis, Insights and Forecast - by Component
- 11. Competitive Analysis
- 11.1. Company Profiles
- 11.1.1 IBM Corporation
- 11.1.1.1. Company Overview
- 11.1.1.2. Products
- 11.1.1.3. Company Financials
- 11.1.1.4. SWOT Analysis
- 11.1.2 Loom Systems Inc
- 11.1.2.1. Company Overview
- 11.1.2.2. Products
- 11.1.2.3. Company Financials
- 11.1.2.4. SWOT Analysis
- 11.1.3 New Relic Inc
- 11.1.3.1. Company Overview
- 11.1.3.2. Products
- 11.1.3.3. Company Financials
- 11.1.3.4. SWOT Analysis
- 11.1.4 Micro Focus International Plc
- 11.1.4.1. Company Overview
- 11.1.4.2. Products
- 11.1.4.3. Company Financials
- 11.1.4.4. SWOT Analysis
- 11.1.5 DEVO Technology Inc
- 11.1.5.1. Company Overview
- 11.1.5.2. Products
- 11.1.5.3. Company Financials
- 11.1.5.4. SWOT Analysis
- 11.1.6 Broadcom Inc
- 11.1.6.1. Company Overview
- 11.1.6.2. Products
- 11.1.6.3. Company Financials
- 11.1.6.4. SWOT Analysis
- 11.1.7 ScienceLogic Inc
- 11.1.7.1. Company Overview
- 11.1.7.2. Products
- 11.1.7.3. Company Financials
- 11.1.7.4. SWOT Analysis
- 11.1.8 CloudFabrix Software Inc
- 11.1.8.1. Company Overview
- 11.1.8.2. Products
- 11.1.8.3. Company Financials
- 11.1.8.4. SWOT Analysis
- 11.1.9 BMC Software Inc
- 11.1.9.1. Company Overview
- 11.1.9.2. Products
- 11.1.9.3. Company Financials
- 11.1.9.4. SWOT Analysis
- 11.1.10 Correlata Solutions Inc
- 11.1.10.1. Company Overview
- 11.1.10.2. Products
- 11.1.10.3. Company Financials
- 11.1.10.4. SWOT Analysis
- 11.1.11 Servicenow Inc
- 11.1.11.1. Company Overview
- 11.1.11.2. Products
- 11.1.11.3. Company Financials
- 11.1.11.4. SWOT Analysis
- 11.1.12 Interlink Software Services Ltd
- 11.1.12.1. Company Overview
- 11.1.12.2. Products
- 11.1.12.3. Company Financials
- 11.1.12.4. SWOT Analysis
- 11.1.13 VMware Inc
- 11.1.13.1. Company Overview
- 11.1.13.2. Products
- 11.1.13.3. Company Financials
- 11.1.13.4. SWOT Analysis
- 11.1.14 Splunk Inc
- 11.1.14.1. Company Overview
- 11.1.14.2. Products
- 11.1.14.3. Company Financials
- 11.1.14.4. SWOT Analysis
- 11.1.15 Dynatrace LLC
- 11.1.15.1. Company Overview
- 11.1.15.2. Products
- 11.1.15.3. Company Financials
- 11.1.15.4. SWOT Analysis
- 11.1.16 HCL Technologies Limited
- 11.1.16.1. Company Overview
- 11.1.16.2. Products
- 11.1.16.3. Company Financials
- 11.1.16.4. SWOT Analysis
- 11.1.1 IBM Corporation
- 11.2. Market Entropy
- 11.2.1 Company's Key Areas Served
- 11.2.2 Recent Developments
- 11.3. Company Market Share Analysis 2025
- 11.3.1 Top 5 Companies Market Share Analysis
- 11.3.2 Top 3 Companies Market Share Analysis
- 11.4. List of Potential Customers
- 12. Research Methodology
List of Figures
- Figure 1: Global Cognitive Operations Market Revenue Breakdown (Million, %) by Region 2025 & 2033
- Figure 2: North America Cognitive Operations Market Revenue (Million), by Component 2025 & 2033
- Figure 3: North America Cognitive Operations Market Revenue Share (%), by Component 2025 & 2033
- Figure 4: North America Cognitive Operations Market Revenue (Million), by Deployment Mode 2025 & 2033
- Figure 5: North America Cognitive Operations Market Revenue Share (%), by Deployment Mode 2025 & 2033
- Figure 6: North America Cognitive Operations Market Revenue (Million), by Enterprise Size 2025 & 2033
- Figure 7: North America Cognitive Operations Market Revenue Share (%), by Enterprise Size 2025 & 2033
- Figure 8: North America Cognitive Operations Market Revenue (Million), by Application 2025 & 2033
- Figure 9: North America Cognitive Operations Market Revenue Share (%), by Application 2025 & 2033
- Figure 10: North America Cognitive Operations Market Revenue (Million), by Industry Vertical 2025 & 2033
- Figure 11: North America Cognitive Operations Market Revenue Share (%), by Industry Vertical 2025 & 2033
- Figure 12: North America Cognitive Operations Market Revenue (Million), by Country 2025 & 2033
- Figure 13: North America Cognitive Operations Market Revenue Share (%), by Country 2025 & 2033
- Figure 14: Europe Cognitive Operations Market Revenue (Million), by Component 2025 & 2033
- Figure 15: Europe Cognitive Operations Market Revenue Share (%), by Component 2025 & 2033
- Figure 16: Europe Cognitive Operations Market Revenue (Million), by Deployment Mode 2025 & 2033
- Figure 17: Europe Cognitive Operations Market Revenue Share (%), by Deployment Mode 2025 & 2033
- Figure 18: Europe Cognitive Operations Market Revenue (Million), by Enterprise Size 2025 & 2033
- Figure 19: Europe Cognitive Operations Market Revenue Share (%), by Enterprise Size 2025 & 2033
- Figure 20: Europe Cognitive Operations Market Revenue (Million), by Application 2025 & 2033
- Figure 21: Europe Cognitive Operations Market Revenue Share (%), by Application 2025 & 2033
- Figure 22: Europe Cognitive Operations Market Revenue (Million), by Industry Vertical 2025 & 2033
- Figure 23: Europe Cognitive Operations Market Revenue Share (%), by Industry Vertical 2025 & 2033
- Figure 24: Europe Cognitive Operations Market Revenue (Million), by Country 2025 & 2033
- Figure 25: Europe Cognitive Operations Market Revenue Share (%), by Country 2025 & 2033
- Figure 26: Asia Pacific Cognitive Operations Market Revenue (Million), by Component 2025 & 2033
- Figure 27: Asia Pacific Cognitive Operations Market Revenue Share (%), by Component 2025 & 2033
- Figure 28: Asia Pacific Cognitive Operations Market Revenue (Million), by Deployment Mode 2025 & 2033
- Figure 29: Asia Pacific Cognitive Operations Market Revenue Share (%), by Deployment Mode 2025 & 2033
- Figure 30: Asia Pacific Cognitive Operations Market Revenue (Million), by Enterprise Size 2025 & 2033
- Figure 31: Asia Pacific Cognitive Operations Market Revenue Share (%), by Enterprise Size 2025 & 2033
- Figure 32: Asia Pacific Cognitive Operations Market Revenue (Million), by Application 2025 & 2033
- Figure 33: Asia Pacific Cognitive Operations Market Revenue Share (%), by Application 2025 & 2033
- Figure 34: Asia Pacific Cognitive Operations Market Revenue (Million), by Industry Vertical 2025 & 2033
- Figure 35: Asia Pacific Cognitive Operations Market Revenue Share (%), by Industry Vertical 2025 & 2033
- Figure 36: Asia Pacific Cognitive Operations Market Revenue (Million), by Country 2025 & 2033
- Figure 37: Asia Pacific Cognitive Operations Market Revenue Share (%), by Country 2025 & 2033
- Figure 38: Rest of the World Cognitive Operations Market Revenue (Million), by Component 2025 & 2033
- Figure 39: Rest of the World Cognitive Operations Market Revenue Share (%), by Component 2025 & 2033
- Figure 40: Rest of the World Cognitive Operations Market Revenue (Million), by Deployment Mode 2025 & 2033
- Figure 41: Rest of the World Cognitive Operations Market Revenue Share (%), by Deployment Mode 2025 & 2033
- Figure 42: Rest of the World Cognitive Operations Market Revenue (Million), by Enterprise Size 2025 & 2033
- Figure 43: Rest of the World Cognitive Operations Market Revenue Share (%), by Enterprise Size 2025 & 2033
- Figure 44: Rest of the World Cognitive Operations Market Revenue (Million), by Application 2025 & 2033
- Figure 45: Rest of the World Cognitive Operations Market Revenue Share (%), by Application 2025 & 2033
- Figure 46: Rest of the World Cognitive Operations Market Revenue (Million), by Industry Vertical 2025 & 2033
- Figure 47: Rest of the World Cognitive Operations Market Revenue Share (%), by Industry Vertical 2025 & 2033
- Figure 48: Rest of the World Cognitive Operations Market Revenue (Million), by Country 2025 & 2033
- Figure 49: Rest of the World Cognitive Operations Market Revenue Share (%), by Country 2025 & 2033
List of Tables
- Table 1: Global Cognitive Operations Market Revenue Million Forecast, by Component 2020 & 2033
- Table 2: Global Cognitive Operations Market Revenue Million Forecast, by Deployment Mode 2020 & 2033
- Table 3: Global Cognitive Operations Market Revenue Million Forecast, by Enterprise Size 2020 & 2033
- Table 4: Global Cognitive Operations Market Revenue Million Forecast, by Application 2020 & 2033
- Table 5: Global Cognitive Operations Market Revenue Million Forecast, by Industry Vertical 2020 & 2033
- Table 6: Global Cognitive Operations Market Revenue Million Forecast, by Region 2020 & 2033
- Table 7: Global Cognitive Operations Market Revenue Million Forecast, by Component 2020 & 2033
- Table 8: Global Cognitive Operations Market Revenue Million Forecast, by Deployment Mode 2020 & 2033
- Table 9: Global Cognitive Operations Market Revenue Million Forecast, by Enterprise Size 2020 & 2033
- Table 10: Global Cognitive Operations Market Revenue Million Forecast, by Application 2020 & 2033
- Table 11: Global Cognitive Operations Market Revenue Million Forecast, by Industry Vertical 2020 & 2033
- Table 12: Global Cognitive Operations Market Revenue Million Forecast, by Country 2020 & 2033
- Table 13: Global Cognitive Operations Market Revenue Million Forecast, by Component 2020 & 2033
- Table 14: Global Cognitive Operations Market Revenue Million Forecast, by Deployment Mode 2020 & 2033
- Table 15: Global Cognitive Operations Market Revenue Million Forecast, by Enterprise Size 2020 & 2033
- Table 16: Global Cognitive Operations Market Revenue Million Forecast, by Application 2020 & 2033
- Table 17: Global Cognitive Operations Market Revenue Million Forecast, by Industry Vertical 2020 & 2033
- Table 18: Global Cognitive Operations Market Revenue Million Forecast, by Country 2020 & 2033
- Table 19: Global Cognitive Operations Market Revenue Million Forecast, by Component 2020 & 2033
- Table 20: Global Cognitive Operations Market Revenue Million Forecast, by Deployment Mode 2020 & 2033
- Table 21: Global Cognitive Operations Market Revenue Million Forecast, by Enterprise Size 2020 & 2033
- Table 22: Global Cognitive Operations Market Revenue Million Forecast, by Application 2020 & 2033
- Table 23: Global Cognitive Operations Market Revenue Million Forecast, by Industry Vertical 2020 & 2033
- Table 24: Global Cognitive Operations Market Revenue Million Forecast, by Country 2020 & 2033
- Table 25: Global Cognitive Operations Market Revenue Million Forecast, by Component 2020 & 2033
- Table 26: Global Cognitive Operations Market Revenue Million Forecast, by Deployment Mode 2020 & 2033
- Table 27: Global Cognitive Operations Market Revenue Million Forecast, by Enterprise Size 2020 & 2033
- Table 28: Global Cognitive Operations Market Revenue Million Forecast, by Application 2020 & 2033
- Table 29: Global Cognitive Operations Market Revenue Million Forecast, by Industry Vertical 2020 & 2033
- Table 30: Global Cognitive Operations Market Revenue Million Forecast, by Country 2020 & 2033
Frequently Asked Questions
1. What is the projected Compound Annual Growth Rate (CAGR) of the Cognitive Operations Market?
The projected CAGR is approximately 16.38%.
2. Which companies are prominent players in the Cognitive Operations Market?
Key companies in the market include IBM Corporation, Loom Systems Inc, New Relic Inc, Micro Focus International Plc, DEVO Technology Inc, Broadcom Inc, ScienceLogic Inc, CloudFabrix Software Inc, BMC Software Inc, Correlata Solutions Inc, Servicenow Inc, Interlink Software Services Ltd, VMware Inc, Splunk Inc, Dynatrace LLC, HCL Technologies Limited.
3. What are the main segments of the Cognitive Operations Market?
The market segments include Component, Deployment Mode, Enterprise Size , Application, Industry Vertical.
4. Can you provide details about the market size?
The market size is estimated to be USD 17.59 Million as of 2022.
5. What are some drivers contributing to market growth?
Growing Focus Toward Selection of Cloud-Based Cognitive IT Operations Solutions; Rising Demand for Monitoring the Complex IT Environment.
6. What are the notable trends driving market growth?
IT and Telecommunication Segment to Grow Significantly.
7. Are there any restraints impacting market growth?
Integration of Cognitive Operations Capabilities With the Present Systems; Dearth of Skills and Expertise.
8. Can you provide examples of recent developments in the market?
March 2023: TCS Cognitive Plant Operations Adviser launched for industries in manufacturing, oil and gas, and consumer packaged goods to transform manufacturing by utilizing machine learning and artificial intelligence to make it more intelligent, flexible, and resilient. The TCS Cognitive Plant Operations Adviser connects with Microsoft Azure private mobile edge computing (PMEC) for waste reduction, increased equipment uptime, and eliminating safety problems. For quick and independent decision-making, it gives plant operators insights and data.
9. What pricing options are available for accessing the report?
Pricing options include single-user, multi-user, and enterprise licenses priced at USD 4750, USD 5250, and USD 8750 respectively.
10. Is the market size provided in terms of value or volume?
The market size is provided in terms of value, measured in Million.
11. Are there any specific market keywords associated with the report?
Yes, the market keyword associated with the report is "Cognitive Operations Market," which aids in identifying and referencing the specific market segment covered.
12. How do I determine which pricing option suits my needs best?
The pricing options vary based on user requirements and access needs. Individual users may opt for single-user licenses, while businesses requiring broader access may choose multi-user or enterprise licenses for cost-effective access to the report.
13. Are there any additional resources or data provided in the Cognitive Operations Market report?
While the report offers comprehensive insights, it's advisable to review the specific contents or supplementary materials provided to ascertain if additional resources or data are available.
14. How can I stay updated on further developments or reports in the Cognitive Operations Market?
To stay informed about further developments, trends, and reports in the Cognitive Operations Market, consider subscribing to industry newsletters, following relevant companies and organizations, or regularly checking reputable industry news sources and publications.
Methodology
Step 1 - Identification of Relevant Samples Size from Population Database


Step 2 - Approaches for Defining Global Market Size (Value, Volume* & Price*)

Note*: In applicable scenarios
Step 3 - Data Sources
Primary Research
- Web Analytics
- Survey Reports
- Research Institute
- Latest Research Reports
- Opinion Leaders
Secondary Research
- Annual Reports
- White Paper
- Latest Press Release
- Industry Association
- Paid Database
- Investor Presentations

Step 4 - Data Triangulation
Involves using different sources of information in order to increase the validity of a study
These sources are likely to be stakeholders in a program - participants, other researchers, program staff, other community members, and so on.
Then we put all data in single framework & apply various statistical tools to find out the dynamic on the market.
During the analysis stage, feedback from the stakeholder groups would be compared to determine areas of agreement as well as areas of divergence

