

Key Insights
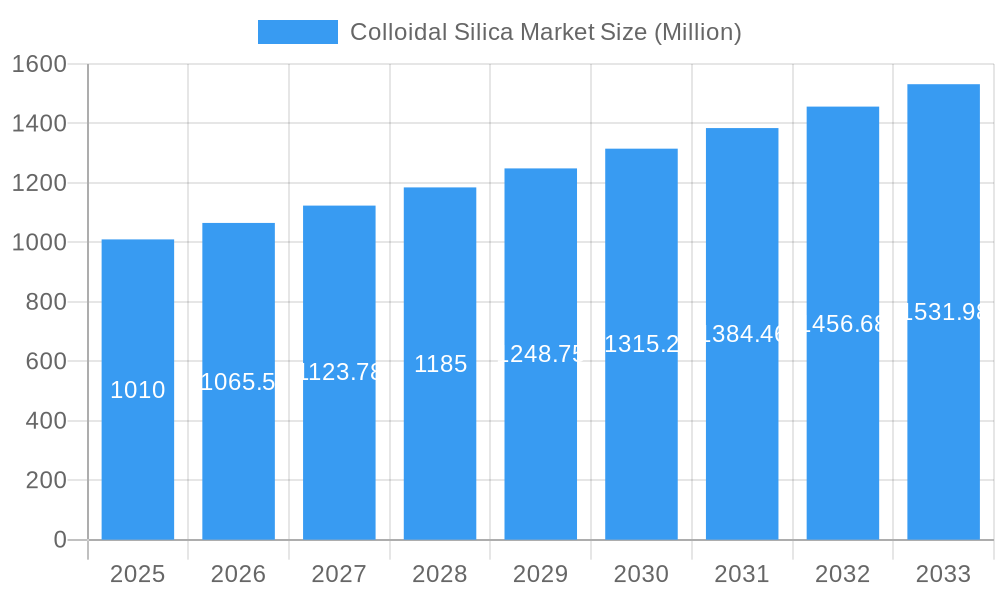
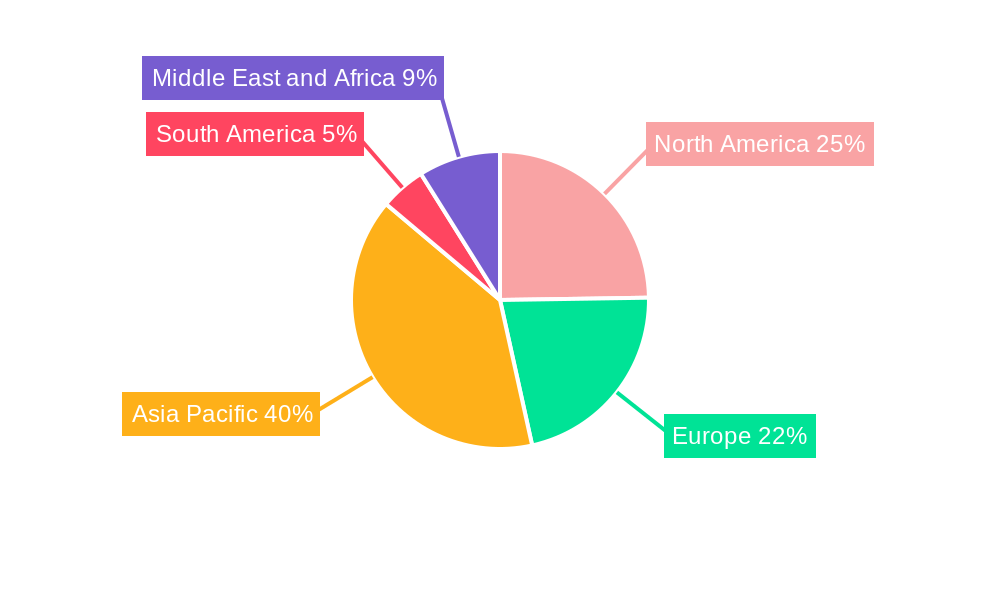
The colloidal silica market, valued at approximately $1.01 billion in 2025, is projected to experience robust growth with a compound annual growth rate (CAGR) exceeding 5% from 2025 to 2033. This expansion is driven by several key factors. The increasing demand for high-performance materials across diverse end-use industries like construction (for concrete admixtures and improved strength), paints and coatings (enhancing rheology and durability), and electronics (in semiconductor manufacturing and advanced packaging) is a significant catalyst. Furthermore, the growing adoption of sustainable and eco-friendly materials is fueling the demand for colloidal silica, as it offers advantages in terms of reduced environmental impact compared to some alternatives. Technological advancements leading to improved product quality and functionalities further contribute to market growth. Regional variations are expected, with Asia Pacific, particularly China and India, anticipated to lead the market due to substantial infrastructural development and expanding manufacturing sectors. North America and Europe will also contribute significantly, driven by strong demand from established industries.
Colloidal Silica Market Market Size (In Billion)
However, market growth might be tempered by certain restraints. Fluctuations in raw material prices (like silica sand) and the availability of raw materials, along with stringent environmental regulations in certain regions, can pose challenges. Competitive dynamics within the market, involving established players and emerging regional manufacturers, will also influence pricing and market share distribution. The market is segmented by end-user industries, with pulp and paper, paints and coatings, and chemicals representing major application areas. Companies such as Ecolab, Cabot Corporation, and Evonik are prominent players, leveraging their technological expertise and global reach to capture significant market share. The forecast period (2025-2033) anticipates continued growth, driven by sustained demand and innovation within the colloidal silica industry.
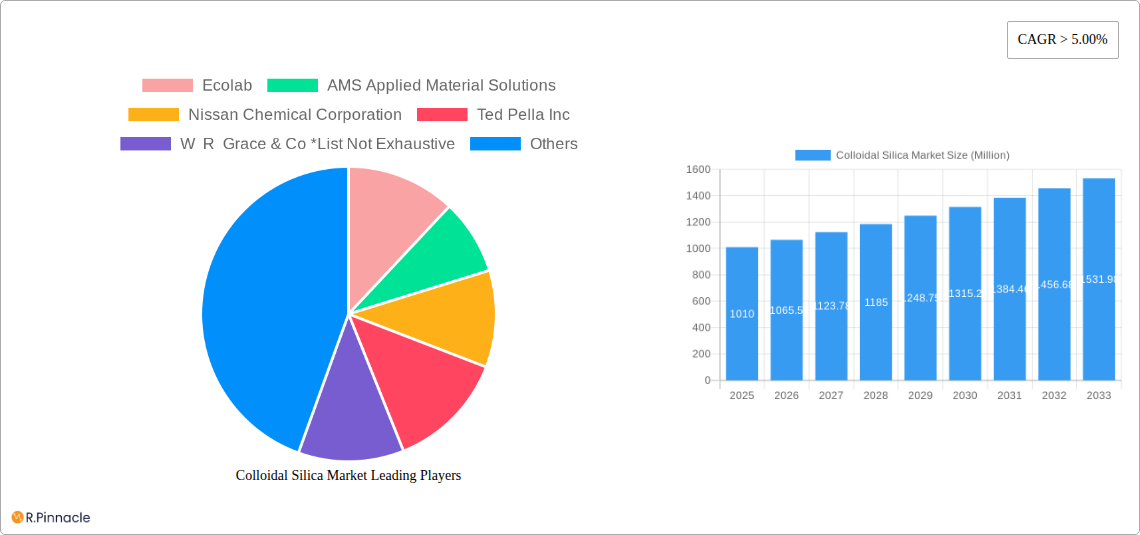
Colloidal Silica Market Company Market Share
This comprehensive report provides an in-depth analysis of the global Colloidal Silica market, offering actionable insights for industry professionals, investors, and strategic decision-makers. Covering the period from 2019 to 2033, with a focus on 2025, this report meticulously examines market dynamics, competitive landscapes, and future growth potential.
Colloidal Silica Market Structure & Innovation Trends
This section analyzes the Colloidal Silica market's structure, identifying key trends and drivers shaping its evolution. We delve into market concentration, assessing the market share held by major players like Ecolab, AMS Applied Material Solutions, Nissan Chemical Corporation, Ted Pella Inc, W R Grace & Co, Cabot Corporation, Nyacol, FUSO CHEMICAL CO LTD, Nouryon, CWK Chemiewerk Bad Kstritz GmbH, Linyi Kehan Silicon Products Co LTD, Sterling Chemicals, Jinan Yinfeng Silicon Products Co Ltd, Akasel, and Evonik (list not exhaustive). The report also examines innovation drivers, including advancements in synthesis techniques and applications, and explores the impact of regulatory frameworks and product substitutes on market dynamics. We analyze mergers and acquisitions (M&A) activities, including deal values and their influence on market consolidation. The influence of end-user demographics on market demand is also carefully considered.
- Market Concentration: xx% of the market is controlled by the top 5 players.
- M&A Activity: Total M&A deal value in the last 5 years: $xx Million. Average deal size: $xx Million.
- Innovation Drivers: Focus on sustainable production methods and high-performance applications.
- Regulatory Impact: Analysis of environmental regulations and their effect on market growth.
Colloidal Silica Market Dynamics & Trends
This section explores the key dynamics and trends driving the Colloidal Silica market's growth. We analyze market growth drivers, including increasing demand from key end-user industries (e.g., construction, electronics), technological disruptions impacting manufacturing processes, evolving consumer preferences toward sustainable products, and the competitive dynamics shaping market share. The report includes detailed analysis of the Compound Annual Growth Rate (CAGR) and market penetration rates for key segments. Further research is also provided on the market's sensitivity to macroeconomic factors and potential future disruptions.
- CAGR (2025-2033): xx%
- Market Penetration: xx% in key regions.
Dominant Regions & Segments in Colloidal Silica Market
This section identifies the leading regions and segments within the Colloidal Silica market. A detailed analysis of each end-user industry is provided: Pulp and Paper, Paints and Coatings, Chemicals, Construction, Metals and Metallurgy, Electronics and Semiconductors, and Other End-user Industries. Key drivers for growth within each segment are highlighted, such as economic policies, infrastructure development, and technological advancements. The report also provides a thorough dominance analysis to pinpoint the most influential regions and their contributing factors.
- Leading Region: Asia-Pacific (due to high construction activity and electronics manufacturing).
- Key Drivers (Construction): Growing infrastructure spending, urbanization, and government initiatives.
- Key Drivers (Electronics): Demand for advanced semiconductor manufacturing and high-precision applications.
- Dominant Segment: Construction (due to its large and growing market size).
Colloidal Silica Market Product Innovations
This section summarizes recent product developments, applications, and competitive advantages in the Colloidal Silica market. The focus is on technological trends driving innovation, market fit of new products, and the resulting impact on market competition. Analysis of material properties, manufacturing processes and product performance are also covered.
Report Scope & Segmentation Analysis
This report segments the Colloidal Silica market by end-user industry: Pulp and Paper, Paints and Coatings, Chemicals, Construction, Metals and Metallurgy, Electronics and Semiconductors, and Other End-user Industries. Each segment's growth projections, market size, and competitive dynamics are carefully examined. The analysis includes assessment of current market share, key players in each segment and future opportunities.
Key Drivers of Colloidal Silica Market Growth
This section outlines the key drivers stimulating growth in the Colloidal Silica market. We examine technological advancements, economic factors, and regulatory influences, providing specific examples to illustrate their impact. The focus here is on long-term trends that consistently push the market forward.
Challenges in the Colloidal Silica Market Sector
This section discusses the challenges and restraints hindering the Colloidal Silica market's growth. We identify regulatory hurdles, supply chain issues, and competitive pressures, quantifying their impact on market expansion. The analysis focuses on both immediate and long-term obstacles.
Emerging Opportunities in Colloidal Silica Market
This section highlights emerging trends and opportunities within the Colloidal Silica market. We focus on new markets, technologies, and evolving consumer preferences, presenting actionable prospects for market expansion and growth.
Leading Players in the Colloidal Silica Market Market
- Ecolab
- AMS Applied Material Solutions
- Nissan Chemical Corporation
- Ted Pella Inc
- W R Grace & Co
- Cabot Corporation
- Nyacol
- FUSO CHEMICAL CO LTD
- Nouryon
- CWK Chemiewerk Bad Kstritz GmbH
- Linyi Kehan Silicon Products Co LTD
- Sterling Chemicals
- Jinan Yinfeng Silicon Products Co Ltd
- Akasel
- Evonik
Key Developments in Colloidal Silica Market Industry
- November 2021: Nouryon announced increased production capacity at its Green Bay facility, targeting packaging and construction markets (completion expected in second half of 2022).
- June 2020: W. R. Grace & Co. opened a new colloidal silica plant in Germany, enhancing its EMEA market reach.
Future Outlook for Colloidal Silica Market Market
This section summarizes the growth accelerators expected to shape the future of the Colloidal Silica market. We focus on future market potential and strategic opportunities for businesses operating within this sector. The analysis considers emerging technologies, evolving applications and potential market shifts. The projected market value for 2033 is estimated at $xx Million.
Colloidal Silica Market Segmentation
-
1. End-user Industry
- 1.1. Pulp and Paper
- 1.2. Paints and Coatings
- 1.3. Chemicals
- 1.4. Construction
- 1.5. Metals and Metallurgy
- 1.6. Electronics and Semiconductors
- 1.7. Other End-user Industries
Colloidal Silica Market Segmentation By Geography
-
1. Asia Pacific
- 1.1. China
- 1.2. India
- 1.3. Japan
- 1.4. South Korea
- 1.5. Rest of Asia Pacific
-
2. North America
- 2.1. United States
- 2.2. Canada
- 2.3. Mexico
-
3. Europe
- 3.1. Germany
- 3.2. United Kingdom
- 3.3. Italy
- 3.4. France
- 3.5. Rest of Europe
-
4. South America
- 4.1. Brazil
- 4.2. Argentina
- 4.3. Rest of South America
-
5. Middle East and Africa
- 5.1. Saudi Arabia
- 5.2. South Africa
- 5.3. Rest of Middle East and Africa
Colloidal Silica Market Regional Market Share
Geographic Coverage of Colloidal Silica Market
Colloidal Silica Market REPORT HIGHLIGHTS
| Aspects | Details |
|---|---|
| Study Period | 2020-2034 |
| Base Year | 2025 |
| Estimated Year | 2026 |
| Forecast Period | 2026-2034 |
| Historical Period | 2020-2025 |
| Growth Rate | CAGR of > 5.00% from 2020-2034 |
| Segmentation |
|
Table of Contents
- 1. Introduction
- 1.1. Research Scope
- 1.2. Market Segmentation
- 1.3. Research Objective
- 1.4. Definitions and Assumptions
- 2. Executive Summary
- 2.1. Market Snapshot
- 3. Market Dynamics
- 3.1. Market Drivers
- 3.2. Market Restrains
- 3.3. Market Trends
- 3.4. Market Opportunities
- 4. Market Factor Analysis
- 4.1. Porters Five Forces
- 4.1.1. Bargaining Power of Suppliers
- 4.1.2. Bargaining Power of Buyers
- 4.1.3. Threat of New Entrants
- 4.1.4. Threat of Substitutes
- 4.1.5. Competitive Rivalry
- 4.2. PESTEL analysis
- 4.3. BCG Analysis
- 4.3.1. Stars (High Growth, High Market Share)
- 4.3.2. Cash Cows (Low Growth, High Market Share)
- 4.3.3. Question Mark (High Growth, Low Market Share)
- 4.3.4. Dogs (Low Growth, Low Market Share)
- 4.4. Ansoff Matrix Analysis
- 4.5. Supply Chain Analysis
- 4.6. Regulatory Landscape
- 4.7. Current Market Potential and Opportunity Assessment (TAM–SAM–SOM Framework)
- 4.8. PRI Analyst Note
- 4.1. Porters Five Forces
- 5. Market Analysis, Insights and Forecast 2021-2033
- 5.1. Market Analysis, Insights and Forecast - by End-user Industry
- 5.1.1. Pulp and Paper
- 5.1.2. Paints and Coatings
- 5.1.3. Chemicals
- 5.1.4. Construction
- 5.1.5. Metals and Metallurgy
- 5.1.6. Electronics and Semiconductors
- 5.1.7. Other End-user Industries
- 5.2. Market Analysis, Insights and Forecast - by Region
- 5.2.1. Asia Pacific
- 5.2.2. North America
- 5.2.3. Europe
- 5.2.4. South America
- 5.2.5. Middle East and Africa
- 5.1. Market Analysis, Insights and Forecast - by End-user Industry
- 6. Global Colloidal Silica Market Analysis, Insights and Forecast, 2021-2033
- 6.1. Market Analysis, Insights and Forecast - by End-user Industry
- 6.1.1. Pulp and Paper
- 6.1.2. Paints and Coatings
- 6.1.3. Chemicals
- 6.1.4. Construction
- 6.1.5. Metals and Metallurgy
- 6.1.6. Electronics and Semiconductors
- 6.1.7. Other End-user Industries
- 6.1. Market Analysis, Insights and Forecast - by End-user Industry
- 7. Asia Pacific Colloidal Silica Market Analysis, Insights and Forecast, 2020-2032
- 7.1. Market Analysis, Insights and Forecast - by End-user Industry
- 7.1.1. Pulp and Paper
- 7.1.2. Paints and Coatings
- 7.1.3. Chemicals
- 7.1.4. Construction
- 7.1.5. Metals and Metallurgy
- 7.1.6. Electronics and Semiconductors
- 7.1.7. Other End-user Industries
- 7.1. Market Analysis, Insights and Forecast - by End-user Industry
- 8. North America Colloidal Silica Market Analysis, Insights and Forecast, 2020-2032
- 8.1. Market Analysis, Insights and Forecast - by End-user Industry
- 8.1.1. Pulp and Paper
- 8.1.2. Paints and Coatings
- 8.1.3. Chemicals
- 8.1.4. Construction
- 8.1.5. Metals and Metallurgy
- 8.1.6. Electronics and Semiconductors
- 8.1.7. Other End-user Industries
- 8.1. Market Analysis, Insights and Forecast - by End-user Industry
- 9. Europe Colloidal Silica Market Analysis, Insights and Forecast, 2020-2032
- 9.1. Market Analysis, Insights and Forecast - by End-user Industry
- 9.1.1. Pulp and Paper
- 9.1.2. Paints and Coatings
- 9.1.3. Chemicals
- 9.1.4. Construction
- 9.1.5. Metals and Metallurgy
- 9.1.6. Electronics and Semiconductors
- 9.1.7. Other End-user Industries
- 9.1. Market Analysis, Insights and Forecast - by End-user Industry
- 10. South America Colloidal Silica Market Analysis, Insights and Forecast, 2020-2032
- 10.1. Market Analysis, Insights and Forecast - by End-user Industry
- 10.1.1. Pulp and Paper
- 10.1.2. Paints and Coatings
- 10.1.3. Chemicals
- 10.1.4. Construction
- 10.1.5. Metals and Metallurgy
- 10.1.6. Electronics and Semiconductors
- 10.1.7. Other End-user Industries
- 10.1. Market Analysis, Insights and Forecast - by End-user Industry
- 11. Middle East and Africa Colloidal Silica Market Analysis, Insights and Forecast, 2020-2032
- 11.1. Market Analysis, Insights and Forecast - by End-user Industry
- 11.1.1. Pulp and Paper
- 11.1.2. Paints and Coatings
- 11.1.3. Chemicals
- 11.1.4. Construction
- 11.1.5. Metals and Metallurgy
- 11.1.6. Electronics and Semiconductors
- 11.1.7. Other End-user Industries
- 11.1. Market Analysis, Insights and Forecast - by End-user Industry
- 12. Competitive Analysis
- 12.1. Company Profiles
- 12.1.1 Ecolab
- 12.1.1.1. Company Overview
- 12.1.1.2. Products
- 12.1.1.3. Company Financials
- 12.1.1.4. SWOT Analysis
- 12.1.2 AMS Applied Material Solutions
- 12.1.2.1. Company Overview
- 12.1.2.2. Products
- 12.1.2.3. Company Financials
- 12.1.2.4. SWOT Analysis
- 12.1.3 Nissan Chemical Corporation
- 12.1.3.1. Company Overview
- 12.1.3.2. Products
- 12.1.3.3. Company Financials
- 12.1.3.4. SWOT Analysis
- 12.1.4 Ted Pella Inc
- 12.1.4.1. Company Overview
- 12.1.4.2. Products
- 12.1.4.3. Company Financials
- 12.1.4.4. SWOT Analysis
- 12.1.5 W R Grace & Co *List Not Exhaustive
- 12.1.5.1. Company Overview
- 12.1.5.2. Products
- 12.1.5.3. Company Financials
- 12.1.5.4. SWOT Analysis
- 12.1.6 Cabot Corporation
- 12.1.6.1. Company Overview
- 12.1.6.2. Products
- 12.1.6.3. Company Financials
- 12.1.6.4. SWOT Analysis
- 12.1.7 Nyacol
- 12.1.7.1. Company Overview
- 12.1.7.2. Products
- 12.1.7.3. Company Financials
- 12.1.7.4. SWOT Analysis
- 12.1.8 FUSO CHEMICAL CO LTD
- 12.1.8.1. Company Overview
- 12.1.8.2. Products
- 12.1.8.3. Company Financials
- 12.1.8.4. SWOT Analysis
- 12.1.9 Nouryan
- 12.1.9.1. Company Overview
- 12.1.9.2. Products
- 12.1.9.3. Company Financials
- 12.1.9.4. SWOT Analysis
- 12.1.10 CWK Chemiewerk Bad Kstritz GmbH
- 12.1.10.1. Company Overview
- 12.1.10.2. Products
- 12.1.10.3. Company Financials
- 12.1.10.4. SWOT Analysis
- 12.1.11 Linyi Kehan Silicon Products Co LTD
- 12.1.11.1. Company Overview
- 12.1.11.2. Products
- 12.1.11.3. Company Financials
- 12.1.11.4. SWOT Analysis
- 12.1.12 Sterling Chemicals
- 12.1.12.1. Company Overview
- 12.1.12.2. Products
- 12.1.12.3. Company Financials
- 12.1.12.4. SWOT Analysis
- 12.1.13 Jinan Yinfeng Silicon Products Co Ltd
- 12.1.13.1. Company Overview
- 12.1.13.2. Products
- 12.1.13.3. Company Financials
- 12.1.13.4. SWOT Analysis
- 12.1.14 Akasel
- 12.1.14.1. Company Overview
- 12.1.14.2. Products
- 12.1.14.3. Company Financials
- 12.1.14.4. SWOT Analysis
- 12.1.15 Evonik
- 12.1.15.1. Company Overview
- 12.1.15.2. Products
- 12.1.15.3. Company Financials
- 12.1.15.4. SWOT Analysis
- 12.1.1 Ecolab
- 12.2. Market Entropy
- 12.2.1 Company's Key Areas Served
- 12.2.2 Recent Developments
- 12.3. Company Market Share Analysis 2025
- 12.3.1 Top 5 Companies Market Share Analysis
- 12.3.2 Top 3 Companies Market Share Analysis
- 12.4. List of Potential Customers
- 13. Research Methodology
List of Figures
- Figure 1: Global Colloidal Silica Market Revenue Breakdown (Million, %) by Region 2025 & 2033
- Figure 2: Global Colloidal Silica Market Volume Breakdown (K Tons, %) by Region 2025 & 2033
- Figure 3: Asia Pacific Colloidal Silica Market Revenue (Million), by End-user Industry 2025 & 2033
- Figure 4: Asia Pacific Colloidal Silica Market Volume (K Tons), by End-user Industry 2025 & 2033
- Figure 5: Asia Pacific Colloidal Silica Market Revenue Share (%), by End-user Industry 2025 & 2033
- Figure 6: Asia Pacific Colloidal Silica Market Volume Share (%), by End-user Industry 2025 & 2033
- Figure 7: Asia Pacific Colloidal Silica Market Revenue (Million), by Country 2025 & 2033
- Figure 8: Asia Pacific Colloidal Silica Market Volume (K Tons), by Country 2025 & 2033
- Figure 9: Asia Pacific Colloidal Silica Market Revenue Share (%), by Country 2025 & 2033
- Figure 10: Asia Pacific Colloidal Silica Market Volume Share (%), by Country 2025 & 2033
- Figure 11: North America Colloidal Silica Market Revenue (Million), by End-user Industry 2025 & 2033
- Figure 12: North America Colloidal Silica Market Volume (K Tons), by End-user Industry 2025 & 2033
- Figure 13: North America Colloidal Silica Market Revenue Share (%), by End-user Industry 2025 & 2033
- Figure 14: North America Colloidal Silica Market Volume Share (%), by End-user Industry 2025 & 2033
- Figure 15: North America Colloidal Silica Market Revenue (Million), by Country 2025 & 2033
- Figure 16: North America Colloidal Silica Market Volume (K Tons), by Country 2025 & 2033
- Figure 17: North America Colloidal Silica Market Revenue Share (%), by Country 2025 & 2033
- Figure 18: North America Colloidal Silica Market Volume Share (%), by Country 2025 & 2033
- Figure 19: Europe Colloidal Silica Market Revenue (Million), by End-user Industry 2025 & 2033
- Figure 20: Europe Colloidal Silica Market Volume (K Tons), by End-user Industry 2025 & 2033
- Figure 21: Europe Colloidal Silica Market Revenue Share (%), by End-user Industry 2025 & 2033
- Figure 22: Europe Colloidal Silica Market Volume Share (%), by End-user Industry 2025 & 2033
- Figure 23: Europe Colloidal Silica Market Revenue (Million), by Country 2025 & 2033
- Figure 24: Europe Colloidal Silica Market Volume (K Tons), by Country 2025 & 2033
- Figure 25: Europe Colloidal Silica Market Revenue Share (%), by Country 2025 & 2033
- Figure 26: Europe Colloidal Silica Market Volume Share (%), by Country 2025 & 2033
- Figure 27: South America Colloidal Silica Market Revenue (Million), by End-user Industry 2025 & 2033
- Figure 28: South America Colloidal Silica Market Volume (K Tons), by End-user Industry 2025 & 2033
- Figure 29: South America Colloidal Silica Market Revenue Share (%), by End-user Industry 2025 & 2033
- Figure 30: South America Colloidal Silica Market Volume Share (%), by End-user Industry 2025 & 2033
- Figure 31: South America Colloidal Silica Market Revenue (Million), by Country 2025 & 2033
- Figure 32: South America Colloidal Silica Market Volume (K Tons), by Country 2025 & 2033
- Figure 33: South America Colloidal Silica Market Revenue Share (%), by Country 2025 & 2033
- Figure 34: South America Colloidal Silica Market Volume Share (%), by Country 2025 & 2033
- Figure 35: Middle East and Africa Colloidal Silica Market Revenue (Million), by End-user Industry 2025 & 2033
- Figure 36: Middle East and Africa Colloidal Silica Market Volume (K Tons), by End-user Industry 2025 & 2033
- Figure 37: Middle East and Africa Colloidal Silica Market Revenue Share (%), by End-user Industry 2025 & 2033
- Figure 38: Middle East and Africa Colloidal Silica Market Volume Share (%), by End-user Industry 2025 & 2033
- Figure 39: Middle East and Africa Colloidal Silica Market Revenue (Million), by Country 2025 & 2033
- Figure 40: Middle East and Africa Colloidal Silica Market Volume (K Tons), by Country 2025 & 2033
- Figure 41: Middle East and Africa Colloidal Silica Market Revenue Share (%), by Country 2025 & 2033
- Figure 42: Middle East and Africa Colloidal Silica Market Volume Share (%), by Country 2025 & 2033
List of Tables
- Table 1: Global Colloidal Silica Market Revenue Million Forecast, by End-user Industry 2020 & 2033
- Table 2: Global Colloidal Silica Market Volume K Tons Forecast, by End-user Industry 2020 & 2033
- Table 3: Global Colloidal Silica Market Revenue Million Forecast, by Region 2020 & 2033
- Table 4: Global Colloidal Silica Market Volume K Tons Forecast, by Region 2020 & 2033
- Table 5: Global Colloidal Silica Market Revenue Million Forecast, by End-user Industry 2020 & 2033
- Table 6: Global Colloidal Silica Market Volume K Tons Forecast, by End-user Industry 2020 & 2033
- Table 7: Global Colloidal Silica Market Revenue Million Forecast, by Country 2020 & 2033
- Table 8: Global Colloidal Silica Market Volume K Tons Forecast, by Country 2020 & 2033
- Table 9: China Colloidal Silica Market Revenue (Million) Forecast, by Application 2020 & 2033
- Table 10: China Colloidal Silica Market Volume (K Tons) Forecast, by Application 2020 & 2033
- Table 11: India Colloidal Silica Market Revenue (Million) Forecast, by Application 2020 & 2033
- Table 12: India Colloidal Silica Market Volume (K Tons) Forecast, by Application 2020 & 2033
- Table 13: Japan Colloidal Silica Market Revenue (Million) Forecast, by Application 2020 & 2033
- Table 14: Japan Colloidal Silica Market Volume (K Tons) Forecast, by Application 2020 & 2033
- Table 15: South Korea Colloidal Silica Market Revenue (Million) Forecast, by Application 2020 & 2033
- Table 16: South Korea Colloidal Silica Market Volume (K Tons) Forecast, by Application 2020 & 2033
- Table 17: Rest of Asia Pacific Colloidal Silica Market Revenue (Million) Forecast, by Application 2020 & 2033
- Table 18: Rest of Asia Pacific Colloidal Silica Market Volume (K Tons) Forecast, by Application 2020 & 2033
- Table 19: Global Colloidal Silica Market Revenue Million Forecast, by End-user Industry 2020 & 2033
- Table 20: Global Colloidal Silica Market Volume K Tons Forecast, by End-user Industry 2020 & 2033
- Table 21: Global Colloidal Silica Market Revenue Million Forecast, by Country 2020 & 2033
- Table 22: Global Colloidal Silica Market Volume K Tons Forecast, by Country 2020 & 2033
- Table 23: United States Colloidal Silica Market Revenue (Million) Forecast, by Application 2020 & 2033
- Table 24: United States Colloidal Silica Market Volume (K Tons) Forecast, by Application 2020 & 2033
- Table 25: Canada Colloidal Silica Market Revenue (Million) Forecast, by Application 2020 & 2033
- Table 26: Canada Colloidal Silica Market Volume (K Tons) Forecast, by Application 2020 & 2033
- Table 27: Mexico Colloidal Silica Market Revenue (Million) Forecast, by Application 2020 & 2033
- Table 28: Mexico Colloidal Silica Market Volume (K Tons) Forecast, by Application 2020 & 2033
- Table 29: Global Colloidal Silica Market Revenue Million Forecast, by End-user Industry 2020 & 2033
- Table 30: Global Colloidal Silica Market Volume K Tons Forecast, by End-user Industry 2020 & 2033
- Table 31: Global Colloidal Silica Market Revenue Million Forecast, by Country 2020 & 2033
- Table 32: Global Colloidal Silica Market Volume K Tons Forecast, by Country 2020 & 2033
- Table 33: Germany Colloidal Silica Market Revenue (Million) Forecast, by Application 2020 & 2033
- Table 34: Germany Colloidal Silica Market Volume (K Tons) Forecast, by Application 2020 & 2033
- Table 35: United Kingdom Colloidal Silica Market Revenue (Million) Forecast, by Application 2020 & 2033
- Table 36: United Kingdom Colloidal Silica Market Volume (K Tons) Forecast, by Application 2020 & 2033
- Table 37: Italy Colloidal Silica Market Revenue (Million) Forecast, by Application 2020 & 2033
- Table 38: Italy Colloidal Silica Market Volume (K Tons) Forecast, by Application 2020 & 2033
- Table 39: France Colloidal Silica Market Revenue (Million) Forecast, by Application 2020 & 2033
- Table 40: France Colloidal Silica Market Volume (K Tons) Forecast, by Application 2020 & 2033
- Table 41: Rest of Europe Colloidal Silica Market Revenue (Million) Forecast, by Application 2020 & 2033
- Table 42: Rest of Europe Colloidal Silica Market Volume (K Tons) Forecast, by Application 2020 & 2033
- Table 43: Global Colloidal Silica Market Revenue Million Forecast, by End-user Industry 2020 & 2033
- Table 44: Global Colloidal Silica Market Volume K Tons Forecast, by End-user Industry 2020 & 2033
- Table 45: Global Colloidal Silica Market Revenue Million Forecast, by Country 2020 & 2033
- Table 46: Global Colloidal Silica Market Volume K Tons Forecast, by Country 2020 & 2033
- Table 47: Brazil Colloidal Silica Market Revenue (Million) Forecast, by Application 2020 & 2033
- Table 48: Brazil Colloidal Silica Market Volume (K Tons) Forecast, by Application 2020 & 2033
- Table 49: Argentina Colloidal Silica Market Revenue (Million) Forecast, by Application 2020 & 2033
- Table 50: Argentina Colloidal Silica Market Volume (K Tons) Forecast, by Application 2020 & 2033
- Table 51: Rest of South America Colloidal Silica Market Revenue (Million) Forecast, by Application 2020 & 2033
- Table 52: Rest of South America Colloidal Silica Market Volume (K Tons) Forecast, by Application 2020 & 2033
- Table 53: Global Colloidal Silica Market Revenue Million Forecast, by End-user Industry 2020 & 2033
- Table 54: Global Colloidal Silica Market Volume K Tons Forecast, by End-user Industry 2020 & 2033
- Table 55: Global Colloidal Silica Market Revenue Million Forecast, by Country 2020 & 2033
- Table 56: Global Colloidal Silica Market Volume K Tons Forecast, by Country 2020 & 2033
- Table 57: Saudi Arabia Colloidal Silica Market Revenue (Million) Forecast, by Application 2020 & 2033
- Table 58: Saudi Arabia Colloidal Silica Market Volume (K Tons) Forecast, by Application 2020 & 2033
- Table 59: South Africa Colloidal Silica Market Revenue (Million) Forecast, by Application 2020 & 2033
- Table 60: South Africa Colloidal Silica Market Volume (K Tons) Forecast, by Application 2020 & 2033
- Table 61: Rest of Middle East and Africa Colloidal Silica Market Revenue (Million) Forecast, by Application 2020 & 2033
- Table 62: Rest of Middle East and Africa Colloidal Silica Market Volume (K Tons) Forecast, by Application 2020 & 2033
Frequently Asked Questions
1. What is the projected Compound Annual Growth Rate (CAGR) of the Colloidal Silica Market?
The projected CAGR is approximately > 5.00%.
2. Which companies are prominent players in the Colloidal Silica Market?
Key companies in the market include Ecolab, AMS Applied Material Solutions, Nissan Chemical Corporation, Ted Pella Inc, W R Grace & Co *List Not Exhaustive, Cabot Corporation, Nyacol, FUSO CHEMICAL CO LTD, Nouryan, CWK Chemiewerk Bad Kstritz GmbH, Linyi Kehan Silicon Products Co LTD, Sterling Chemicals, Jinan Yinfeng Silicon Products Co Ltd, Akasel, Evonik.
3. What are the main segments of the Colloidal Silica Market?
The market segments include End-user Industry.
4. Can you provide details about the market size?
The market size is estimated to be USD 1010 Million as of 2022.
5. What are some drivers contributing to market growth?
Rising Demand for Concrete and Cements in the Construction Industry Globally; Increasing Demand for Silicon wafers for Production of Integrated Circuits in Electronic Devices.
6. What are the notable trends driving market growth?
Increasing Usage in the Construction Industry.
7. Are there any restraints impacting market growth?
Slow Drying Properties of Colloidal Silica; Other Restraints.
8. Can you provide examples of recent developments in the market?
In November 2021, Nouryon announced to increase the production capacity of the colloidal silica manufacturing facility, based in Green Bay, Wisconsin, U.S.A. The increased production capacity will help in meeting demands for packaging and construction end markets. The construction is expected to complete in the second half of 2022.
9. What pricing options are available for accessing the report?
Pricing options include single-user, multi-user, and enterprise licenses priced at USD 4750, USD 5250, and USD 8750 respectively.
10. Is the market size provided in terms of value or volume?
The market size is provided in terms of value, measured in Million and volume, measured in K Tons.
11. Are there any specific market keywords associated with the report?
Yes, the market keyword associated with the report is "Colloidal Silica Market," which aids in identifying and referencing the specific market segment covered.
12. How do I determine which pricing option suits my needs best?
The pricing options vary based on user requirements and access needs. Individual users may opt for single-user licenses, while businesses requiring broader access may choose multi-user or enterprise licenses for cost-effective access to the report.
13. Are there any additional resources or data provided in the Colloidal Silica Market report?
While the report offers comprehensive insights, it's advisable to review the specific contents or supplementary materials provided to ascertain if additional resources or data are available.
14. How can I stay updated on further developments or reports in the Colloidal Silica Market?
To stay informed about further developments, trends, and reports in the Colloidal Silica Market, consider subscribing to industry newsletters, following relevant companies and organizations, or regularly checking reputable industry news sources and publications.
Methodology
Step 1 - Identification of Relevant Samples Size from Population Database


Step 2 - Approaches for Defining Global Market Size (Value, Volume* & Price*)

Note*: In applicable scenarios
Step 3 - Data Sources
Primary Research
- Web Analytics
- Survey Reports
- Research Institute
- Latest Research Reports
- Opinion Leaders
Secondary Research
- Annual Reports
- White Paper
- Latest Press Release
- Industry Association
- Paid Database
- Investor Presentations

Step 4 - Data Triangulation
Involves using different sources of information in order to increase the validity of a study
These sources are likely to be stakeholders in a program - participants, other researchers, program staff, other community members, and so on.
Then we put all data in single framework & apply various statistical tools to find out the dynamic on the market.
During the analysis stage, feedback from the stakeholder groups would be compared to determine areas of agreement as well as areas of divergence