
Key Insights
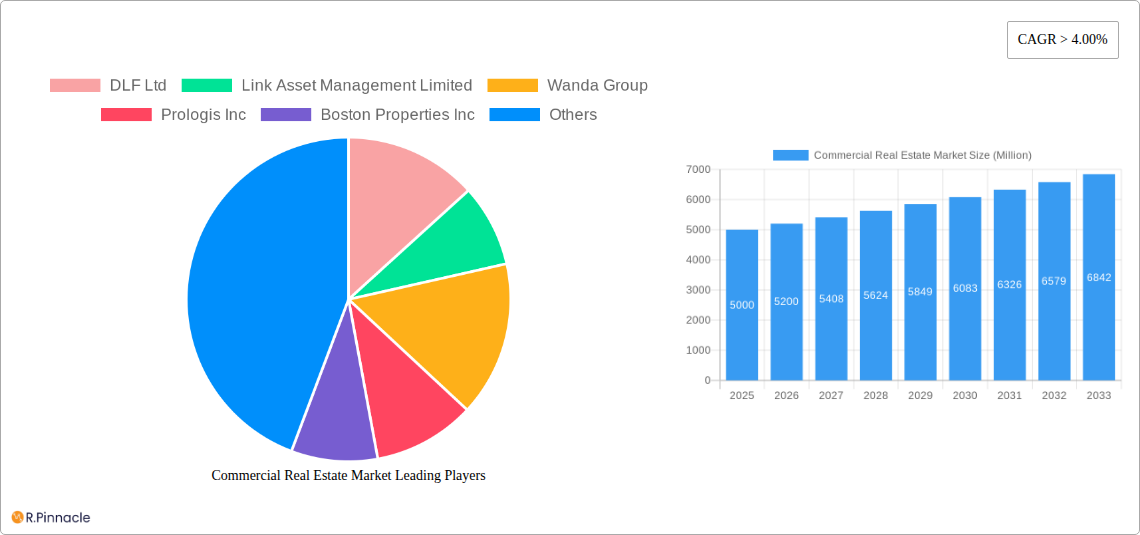
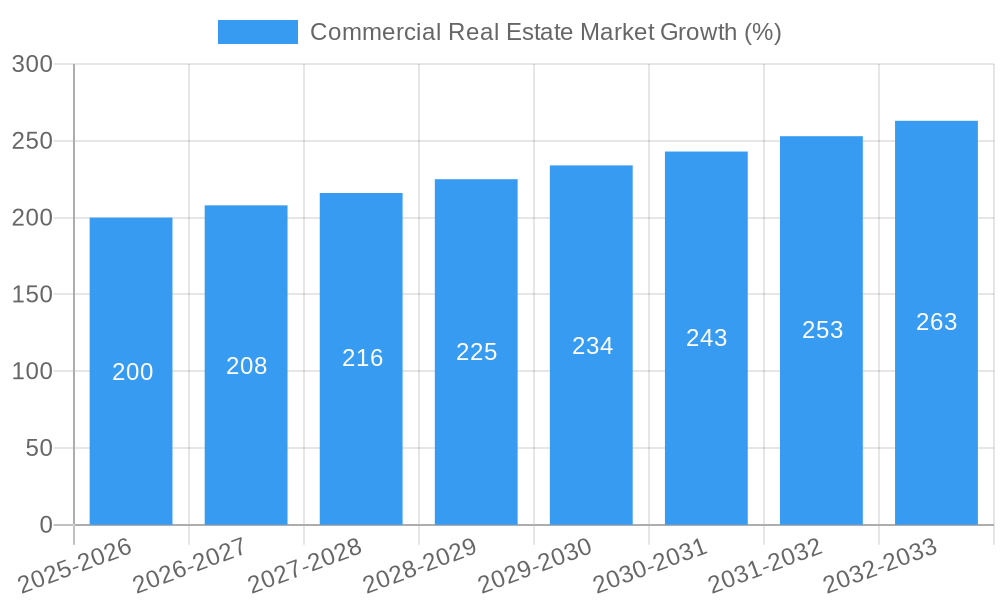
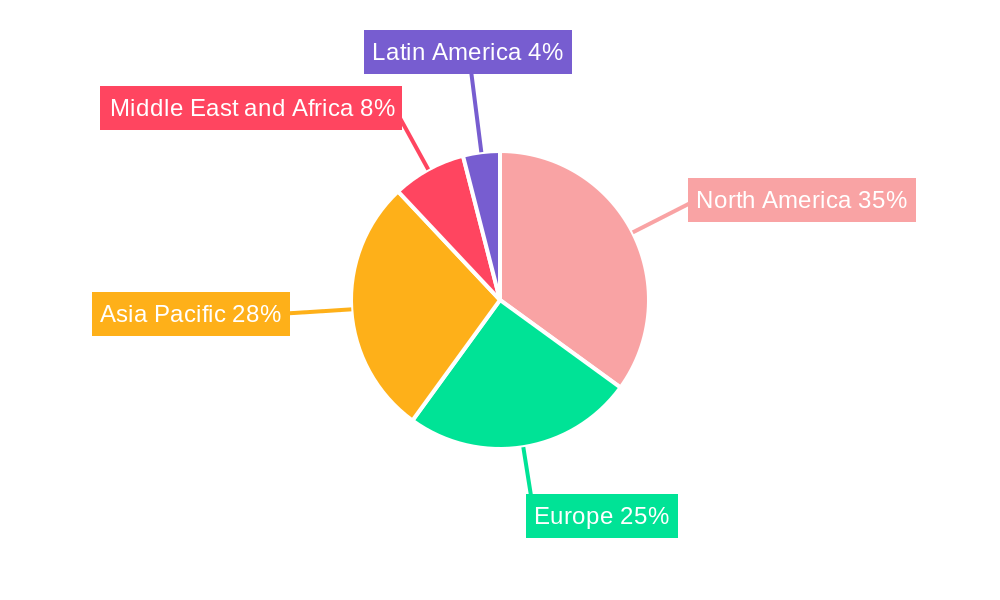
The global commercial real estate (CRE) market exhibits robust growth, fueled by a compound annual growth rate (CAGR) exceeding 4.00% from 2019 to 2033. This expansion is driven by several key factors. Firstly, increasing urbanization and population growth in major cities worldwide are creating consistent demand for office spaces, retail outlets, and logistics facilities. Secondly, the rise of e-commerce is significantly impacting the industrial and logistics sectors, stimulating the construction and leasing of large-scale warehouses and distribution centers. Thirdly, the burgeoning hospitality sector, particularly in rapidly developing economies within Asia-Pacific and the Middle East, contributes to significant investment in hotels and related properties. Finally, government initiatives aimed at improving infrastructure and attracting foreign investment further enhance the market’s attractiveness. Segmentation analysis reveals that the office and retail segments currently dominate the market, while the industrial/logistics sector experiences the fastest growth, driven by the aforementioned e-commerce boom.
However, market growth is not without its challenges. Economic downturns, interest rate fluctuations, and geopolitical instability can significantly impact investor confidence and investment decisions. Furthermore, sustainability concerns and the increasing demand for energy-efficient buildings pose both challenges and opportunities for developers and investors. Despite these restraints, the long-term outlook for the CRE market remains positive. Key players, including DLF Ltd, Prologis Inc., Brookfield Asset Management Inc., and others mentioned, are actively shaping the market through strategic acquisitions, development projects, and innovative approaches to property management. Geographic expansion, particularly in emerging markets of Asia and the Middle East, presents significant growth opportunities. The ongoing shift towards flexible workspaces and a focus on creating sustainable, technology-integrated environments are defining trends that will further shape the future of the commercial real estate landscape.
Commercial Real Estate Market Report: 2019-2033 Forecast
This comprehensive report provides an in-depth analysis of the global Commercial Real Estate Market, offering invaluable insights for investors, industry professionals, and strategic decision-makers. With a detailed study period spanning 2019-2033, a base year of 2025, and a forecast period of 2025-2033, this report meticulously examines market dynamics, growth drivers, and future potential. The report covers key segments including Offices, Retail, Industrial/Logistics, Multi-family, and Hospitality, analyzing market size, growth projections, and competitive landscapes. The analysis includes key players like DLF Ltd, Link Asset Management Limited, Wanda Group, Prologis Inc, Boston Properties Inc, Brookfield Asset Management Inc, Segro, Nakheel PJSC, MaxWell Realty, Onni Contracting Ltd, Simon Property Group LP, Shannon waltchack LLC, ATC IP LLC, and RAK Properties (list not exhaustive).
Commercial Real Estate Market Structure & Innovation Trends
This section analyzes the market's structure, identifying key players and their market share. We explore innovation drivers, regulatory landscapes impacting the sector, the presence of substitute products, end-user demographics, and significant M&A activities. The analysis incorporates data on market concentration, M&A deal values (e.g., M&G Plc's USD 700 Million acquisition), and the impact of these deals on market dynamics. The report also assesses the influence of regulatory frameworks on market growth and innovation.
- Market Concentration: xx% of the market is controlled by the top 5 players.
- M&A Activity: In 2022 alone, over USD xx Million in M&A deals were recorded.
- Innovation Drivers: Technological advancements such as PropTech solutions and sustainable building practices are driving innovation.
- Regulatory Frameworks: Varying zoning regulations and building codes across regions create unique market challenges.
- Product Substitutes: The rise of co-working spaces is impacting the traditional office market.
Commercial Real Estate Market Dynamics & Trends
This in-depth analysis examines market growth drivers, technological disruptions (such as PropTech and Big Data analytics), evolving consumer preferences (demand for sustainable and flexible spaces), and intense competitive dynamics within the sector. Key metrics, including the Compound Annual Growth Rate (CAGR) and market penetration rates for various segments are provided. The report projects a CAGR of xx% for the forecast period (2025-2033). Factors driving the growth are assessed alongside challenges faced by the market. Market penetration of sustainable building practices is also discussed.
Dominant Regions & Segments in Commercial Real Estate Market
This section identifies the leading regions and segments within the Commercial Real Estate Market. Detailed dominance analysis of the leading regions, countries, and segments (Offices, Retail, Industrial/Logistics, Multi-family, Hospitality) is provided.
- Leading Segment: The Industrial/Logistics segment is projected to be the fastest-growing, driven by e-commerce growth.
- Key Drivers (Industrial/Logistics):
- Increased e-commerce activity and supply chain optimization.
- Growth of third-party logistics providers.
- Government initiatives promoting industrial development.
- Detailed Dominance Analysis: Paragraphs detailing the reasons for the dominance of specific regions and segments are included, referencing economic policies, infrastructure, and consumer behavior.
Commercial Real Estate Market Product Innovations
This section summarizes recent product developments, applications, and competitive advantages in the commercial real estate market. The focus is on technological trends, such as the integration of smart building technologies and the use of data analytics for improved asset management, and how these innovations enhance market fit and competitiveness.
Report Scope & Segmentation Analysis
This section details the market segmentation by type: Offices, Retail, Industrial/Logistics, Multi-family, and Hospitality. Each segment is analyzed individually providing growth projections, market sizes (in Millions), and competitive dynamics. For example, the office segment is expected to show a moderate growth rate due to remote work trends, while the industrial segment shows strong potential due to e-commerce growth.
Key Drivers of Commercial Real Estate Market Growth
This section outlines the key factors driving growth in the commercial real estate market, focusing on technological advancements (such as PropTech and BIM), economic factors (like interest rates and GDP growth), and regulatory changes (like zoning laws and tax incentives). Specific examples and quantitative data are provided to support the analysis.
Challenges in the Commercial Real Estate Market Sector
This section addresses significant barriers and restraints facing the commercial real estate sector. These include regulatory hurdles (permitting delays), supply chain disruptions impacting construction, and intense competitive pressures leading to price wars. The report quantifies the impact of these challenges on market growth.
Emerging Opportunities in Commercial Real Estate Market
This section highlights emerging trends and opportunities. These include the rise of sustainable building practices, the growth of co-working spaces, and the expansion into new markets driven by factors like population growth and urbanization.
Leading Players in the Commercial Real Estate Market Market
- DLF Ltd
- Link Asset Management Limited
- Wanda Group
- Prologis Inc
- Boston Properties Inc
- Brookfield Asset Management Inc
- Segro
- Nakheel PJSC
- MaxWell Realty
- Onni Contracting Ltd
- Simon Property Group LP
- Shannon waltchack LLC
- ATC IP LLC
- RAK Properties
Key Developments in Commercial Real Estate Market Industry
- October 2022: M&G Plc's real estate division acquired a prime office building in Yokohama for more than USD 700 Million.
- November 2022: Colliers CAAC acquired a Costa Rican real estate consultancy.
Future Outlook for Commercial Real Estate Market Market
This section summarizes the growth accelerators and strategic opportunities expected to shape the future of the commercial real estate market. The report projects continued growth, driven by technological innovation, evolving consumer preferences, and the expansion into new markets. The focus is on long-term market potential and strategic actions companies can take to capitalize on emerging opportunities.
Commercial Real Estate Market Segmentation
-
1. Type
- 1.1. Offices
- 1.2. Retail
- 1.3. Industrial/Logistics
- 1.4. Multi-family
- 1.5. Hospitality
Commercial Real Estate Market Segmentation By Geography
-
1. Asia Pacific
- 1.1. China
- 1.2. Japan
- 1.3. India
- 1.4. South Korea
- 1.5. Rest of Asia Pacific
-
2. North America
- 2.1. United States
- 2.2. Canada
-
3. Europe
- 3.1. United Kingdom
- 3.2. Germany
- 3.3. France
- 3.4. Russia
- 3.5. Rest of Europe
-
4. Middle East and Africa
- 4.1. Saudi Arabia
- 4.2. United Arab Emirates
- 4.3. Qatar
- 4.4. South Africa
- 4.5. Rest of Middle East and Africa
-
5. Latin America
- 5.1. Brazil
- 5.2. Mexico
- 5.3. Argentina
- 5.4. Colombia
- 5.5. Rest of Latin America
Commercial Real Estate Market REPORT HIGHLIGHTS
| Aspects | Details |
|---|---|
| Study Period | 2019-2033 |
| Base Year | 2024 |
| Estimated Year | 2025 |
| Forecast Period | 2025-2033 |
| Historical Period | 2019-2024 |
| Growth Rate | CAGR of > 4.00% from 2019-2033 |
| Segmentation |
|
Table of Contents
- 1. Introduction
- 1.1. Research Scope
- 1.2. Market Segmentation
- 1.3. Research Methodology
- 1.4. Definitions and Assumptions
- 2. Executive Summary
- 2.1. Introduction
- 3. Market Dynamics
- 3.1. Introduction
- 3.2. Market Drivers
- 3.2.1. 4.; Increase in Aging Population Driving the Market4.; Healthcare and Long-term Care Needs Driving the Market
- 3.3. Market Restrains
- 3.3.1. 4.; High Affordability and Cost of Care Affecting the Market4.; Staffing and Workforce Challenges Affecting the Market
- 3.4. Market Trends
- 3.4.1. Office Markets to Witness Increased Growth
- 4. Market Factor Analysis
- 4.1. Porters Five Forces
- 4.2. Supply/Value Chain
- 4.3. PESTEL analysis
- 4.4. Market Entropy
- 4.5. Patent/Trademark Analysis
- 5. Global Commercial Real Estate Market Analysis, Insights and Forecast, 2019-2031
- 5.1. Market Analysis, Insights and Forecast - by Type
- 5.1.1. Offices
- 5.1.2. Retail
- 5.1.3. Industrial/Logistics
- 5.1.4. Multi-family
- 5.1.5. Hospitality
- 5.2. Market Analysis, Insights and Forecast - by Region
- 5.2.1. Asia Pacific
- 5.2.2. North America
- 5.2.3. Europe
- 5.2.4. Middle East and Africa
- 5.2.5. Latin America
- 5.1. Market Analysis, Insights and Forecast - by Type
- 6. Asia Pacific Commercial Real Estate Market Analysis, Insights and Forecast, 2019-2031
- 6.1. Market Analysis, Insights and Forecast - by Type
- 6.1.1. Offices
- 6.1.2. Retail
- 6.1.3. Industrial/Logistics
- 6.1.4. Multi-family
- 6.1.5. Hospitality
- 6.1. Market Analysis, Insights and Forecast - by Type
- 7. North America Commercial Real Estate Market Analysis, Insights and Forecast, 2019-2031
- 7.1. Market Analysis, Insights and Forecast - by Type
- 7.1.1. Offices
- 7.1.2. Retail
- 7.1.3. Industrial/Logistics
- 7.1.4. Multi-family
- 7.1.5. Hospitality
- 7.1. Market Analysis, Insights and Forecast - by Type
- 8. Europe Commercial Real Estate Market Analysis, Insights and Forecast, 2019-2031
- 8.1. Market Analysis, Insights and Forecast - by Type
- 8.1.1. Offices
- 8.1.2. Retail
- 8.1.3. Industrial/Logistics
- 8.1.4. Multi-family
- 8.1.5. Hospitality
- 8.1. Market Analysis, Insights and Forecast - by Type
- 9. Middle East and Africa Commercial Real Estate Market Analysis, Insights and Forecast, 2019-2031
- 9.1. Market Analysis, Insights and Forecast - by Type
- 9.1.1. Offices
- 9.1.2. Retail
- 9.1.3. Industrial/Logistics
- 9.1.4. Multi-family
- 9.1.5. Hospitality
- 9.1. Market Analysis, Insights and Forecast - by Type
- 10. Latin America Commercial Real Estate Market Analysis, Insights and Forecast, 2019-2031
- 10.1. Market Analysis, Insights and Forecast - by Type
- 10.1.1. Offices
- 10.1.2. Retail
- 10.1.3. Industrial/Logistics
- 10.1.4. Multi-family
- 10.1.5. Hospitality
- 10.1. Market Analysis, Insights and Forecast - by Type
- 11. Asia Pacific Commercial Real Estate Market Analysis, Insights and Forecast, 2019-2031
- 11.1. Market Analysis, Insights and Forecast - By Country/Sub-region
- 11.1.1 China
- 11.1.2 Japan
- 11.1.3 India
- 11.1.4 South Korea
- 11.1.5 Rest of Asia Pacific
- 12. North America Commercial Real Estate Market Analysis, Insights and Forecast, 2019-2031
- 12.1. Market Analysis, Insights and Forecast - By Country/Sub-region
- 12.1.1 United States
- 12.1.2 Canada
- 13. Europe Commercial Real Estate Market Analysis, Insights and Forecast, 2019-2031
- 13.1. Market Analysis, Insights and Forecast - By Country/Sub-region
- 13.1.1 United Kingdom
- 13.1.2 Germany
- 13.1.3 France
- 13.1.4 Russia
- 13.1.5 Rest of Europe
- 14. Middle East and Africa Commercial Real Estate Market Analysis, Insights and Forecast, 2019-2031
- 14.1. Market Analysis, Insights and Forecast - By Country/Sub-region
- 14.1.1 Saudi Arabia
- 14.1.2 United Arab Emirates
- 14.1.3 Qatar
- 14.1.4 South Africa
- 14.1.5 Rest of Middle East and Africa
- 15. Latin America Commercial Real Estate Market Analysis, Insights and Forecast, 2019-2031
- 15.1. Market Analysis, Insights and Forecast - By Country/Sub-region
- 15.1.1 Brazil
- 15.1.2 Mexico
- 15.1.3 Argentina
- 15.1.4 Colombia
- 15.1.5 Rest of Latin America
- 16. Competitive Analysis
- 16.1. Global Market Share Analysis 2024
- 16.2. Company Profiles
- 16.2.1 DLF Ltd
- 16.2.1.1. Overview
- 16.2.1.2. Products
- 16.2.1.3. SWOT Analysis
- 16.2.1.4. Recent Developments
- 16.2.1.5. Financials (Based on Availability)
- 16.2.2 Link Asset Management Limited
- 16.2.2.1. Overview
- 16.2.2.2. Products
- 16.2.2.3. SWOT Analysis
- 16.2.2.4. Recent Developments
- 16.2.2.5. Financials (Based on Availability)
- 16.2.3 Wanda Group
- 16.2.3.1. Overview
- 16.2.3.2. Products
- 16.2.3.3. SWOT Analysis
- 16.2.3.4. Recent Developments
- 16.2.3.5. Financials (Based on Availability)
- 16.2.4 Prologis Inc
- 16.2.4.1. Overview
- 16.2.4.2. Products
- 16.2.4.3. SWOT Analysis
- 16.2.4.4. Recent Developments
- 16.2.4.5. Financials (Based on Availability)
- 16.2.5 Boston Properties Inc
- 16.2.5.1. Overview
- 16.2.5.2. Products
- 16.2.5.3. SWOT Analysis
- 16.2.5.4. Recent Developments
- 16.2.5.5. Financials (Based on Availability)
- 16.2.6 Brookfield Asset Management Inc
- 16.2.6.1. Overview
- 16.2.6.2. Products
- 16.2.6.3. SWOT Analysis
- 16.2.6.4. Recent Developments
- 16.2.6.5. Financials (Based on Availability)
- 16.2.7 Segro
- 16.2.7.1. Overview
- 16.2.7.2. Products
- 16.2.7.3. SWOT Analysis
- 16.2.7.4. Recent Developments
- 16.2.7.5. Financials (Based on Availability)
- 16.2.8 Nakheel PJSC
- 16.2.8.1. Overview
- 16.2.8.2. Products
- 16.2.8.3. SWOT Analysis
- 16.2.8.4. Recent Developments
- 16.2.8.5. Financials (Based on Availability)
- 16.2.9 MaxWell Realty
- 16.2.9.1. Overview
- 16.2.9.2. Products
- 16.2.9.3. SWOT Analysis
- 16.2.9.4. Recent Developments
- 16.2.9.5. Financials (Based on Availability)
- 16.2.10 Onni Contracting Ltd
- 16.2.10.1. Overview
- 16.2.10.2. Products
- 16.2.10.3. SWOT Analysis
- 16.2.10.4. Recent Developments
- 16.2.10.5. Financials (Based on Availability)
- 16.2.11 Simon Property Group LP
- 16.2.11.1. Overview
- 16.2.11.2. Products
- 16.2.11.3. SWOT Analysis
- 16.2.11.4. Recent Developments
- 16.2.11.5. Financials (Based on Availability)
- 16.2.12 Shannon waltchack LLC
- 16.2.12.1. Overview
- 16.2.12.2. Products
- 16.2.12.3. SWOT Analysis
- 16.2.12.4. Recent Developments
- 16.2.12.5. Financials (Based on Availability)
- 16.2.13 ATC IP LLC
- 16.2.13.1. Overview
- 16.2.13.2. Products
- 16.2.13.3. SWOT Analysis
- 16.2.13.4. Recent Developments
- 16.2.13.5. Financials (Based on Availability)
- 16.2.14 RAK Properties**List Not Exhaustive
- 16.2.14.1. Overview
- 16.2.14.2. Products
- 16.2.14.3. SWOT Analysis
- 16.2.14.4. Recent Developments
- 16.2.14.5. Financials (Based on Availability)
- 16.2.1 DLF Ltd
List of Figures
- Figure 1: Global Commercial Real Estate Market Revenue Breakdown (Million, %) by Region 2024 & 2032
- Figure 2: Asia Pacific Commercial Real Estate Market Revenue (Million), by Country 2024 & 2032
- Figure 3: Asia Pacific Commercial Real Estate Market Revenue Share (%), by Country 2024 & 2032
- Figure 4: North America Commercial Real Estate Market Revenue (Million), by Country 2024 & 2032
- Figure 5: North America Commercial Real Estate Market Revenue Share (%), by Country 2024 & 2032
- Figure 6: Europe Commercial Real Estate Market Revenue (Million), by Country 2024 & 2032
- Figure 7: Europe Commercial Real Estate Market Revenue Share (%), by Country 2024 & 2032
- Figure 8: Middle East and Africa Commercial Real Estate Market Revenue (Million), by Country 2024 & 2032
- Figure 9: Middle East and Africa Commercial Real Estate Market Revenue Share (%), by Country 2024 & 2032
- Figure 10: Latin America Commercial Real Estate Market Revenue (Million), by Country 2024 & 2032
- Figure 11: Latin America Commercial Real Estate Market Revenue Share (%), by Country 2024 & 2032
- Figure 12: Asia Pacific Commercial Real Estate Market Revenue (Million), by Type 2024 & 2032
- Figure 13: Asia Pacific Commercial Real Estate Market Revenue Share (%), by Type 2024 & 2032
- Figure 14: Asia Pacific Commercial Real Estate Market Revenue (Million), by Country 2024 & 2032
- Figure 15: Asia Pacific Commercial Real Estate Market Revenue Share (%), by Country 2024 & 2032
- Figure 16: North America Commercial Real Estate Market Revenue (Million), by Type 2024 & 2032
- Figure 17: North America Commercial Real Estate Market Revenue Share (%), by Type 2024 & 2032
- Figure 18: North America Commercial Real Estate Market Revenue (Million), by Country 2024 & 2032
- Figure 19: North America Commercial Real Estate Market Revenue Share (%), by Country 2024 & 2032
- Figure 20: Europe Commercial Real Estate Market Revenue (Million), by Type 2024 & 2032
- Figure 21: Europe Commercial Real Estate Market Revenue Share (%), by Type 2024 & 2032
- Figure 22: Europe Commercial Real Estate Market Revenue (Million), by Country 2024 & 2032
- Figure 23: Europe Commercial Real Estate Market Revenue Share (%), by Country 2024 & 2032
- Figure 24: Middle East and Africa Commercial Real Estate Market Revenue (Million), by Type 2024 & 2032
- Figure 25: Middle East and Africa Commercial Real Estate Market Revenue Share (%), by Type 2024 & 2032
- Figure 26: Middle East and Africa Commercial Real Estate Market Revenue (Million), by Country 2024 & 2032
- Figure 27: Middle East and Africa Commercial Real Estate Market Revenue Share (%), by Country 2024 & 2032
- Figure 28: Latin America Commercial Real Estate Market Revenue (Million), by Type 2024 & 2032
- Figure 29: Latin America Commercial Real Estate Market Revenue Share (%), by Type 2024 & 2032
- Figure 30: Latin America Commercial Real Estate Market Revenue (Million), by Country 2024 & 2032
- Figure 31: Latin America Commercial Real Estate Market Revenue Share (%), by Country 2024 & 2032
List of Tables
- Table 1: Global Commercial Real Estate Market Revenue Million Forecast, by Region 2019 & 2032
- Table 2: Global Commercial Real Estate Market Revenue Million Forecast, by Type 2019 & 2032
- Table 3: Global Commercial Real Estate Market Revenue Million Forecast, by Region 2019 & 2032
- Table 4: Global Commercial Real Estate Market Revenue Million Forecast, by Country 2019 & 2032
- Table 5: China Commercial Real Estate Market Revenue (Million) Forecast, by Application 2019 & 2032
- Table 6: Japan Commercial Real Estate Market Revenue (Million) Forecast, by Application 2019 & 2032
- Table 7: India Commercial Real Estate Market Revenue (Million) Forecast, by Application 2019 & 2032
- Table 8: South Korea Commercial Real Estate Market Revenue (Million) Forecast, by Application 2019 & 2032
- Table 9: Rest of Asia Pacific Commercial Real Estate Market Revenue (Million) Forecast, by Application 2019 & 2032
- Table 10: Global Commercial Real Estate Market Revenue Million Forecast, by Country 2019 & 2032
- Table 11: United States Commercial Real Estate Market Revenue (Million) Forecast, by Application 2019 & 2032
- Table 12: Canada Commercial Real Estate Market Revenue (Million) Forecast, by Application 2019 & 2032
- Table 13: Global Commercial Real Estate Market Revenue Million Forecast, by Country 2019 & 2032
- Table 14: United Kingdom Commercial Real Estate Market Revenue (Million) Forecast, by Application 2019 & 2032
- Table 15: Germany Commercial Real Estate Market Revenue (Million) Forecast, by Application 2019 & 2032
- Table 16: France Commercial Real Estate Market Revenue (Million) Forecast, by Application 2019 & 2032
- Table 17: Russia Commercial Real Estate Market Revenue (Million) Forecast, by Application 2019 & 2032
- Table 18: Rest of Europe Commercial Real Estate Market Revenue (Million) Forecast, by Application 2019 & 2032
- Table 19: Global Commercial Real Estate Market Revenue Million Forecast, by Country 2019 & 2032
- Table 20: Saudi Arabia Commercial Real Estate Market Revenue (Million) Forecast, by Application 2019 & 2032
- Table 21: United Arab Emirates Commercial Real Estate Market Revenue (Million) Forecast, by Application 2019 & 2032
- Table 22: Qatar Commercial Real Estate Market Revenue (Million) Forecast, by Application 2019 & 2032
- Table 23: South Africa Commercial Real Estate Market Revenue (Million) Forecast, by Application 2019 & 2032
- Table 24: Rest of Middle East and Africa Commercial Real Estate Market Revenue (Million) Forecast, by Application 2019 & 2032
- Table 25: Global Commercial Real Estate Market Revenue Million Forecast, by Country 2019 & 2032
- Table 26: Brazil Commercial Real Estate Market Revenue (Million) Forecast, by Application 2019 & 2032
- Table 27: Mexico Commercial Real Estate Market Revenue (Million) Forecast, by Application 2019 & 2032
- Table 28: Argentina Commercial Real Estate Market Revenue (Million) Forecast, by Application 2019 & 2032
- Table 29: Colombia Commercial Real Estate Market Revenue (Million) Forecast, by Application 2019 & 2032
- Table 30: Rest of Latin America Commercial Real Estate Market Revenue (Million) Forecast, by Application 2019 & 2032
- Table 31: Global Commercial Real Estate Market Revenue Million Forecast, by Type 2019 & 2032
- Table 32: Global Commercial Real Estate Market Revenue Million Forecast, by Country 2019 & 2032
- Table 33: China Commercial Real Estate Market Revenue (Million) Forecast, by Application 2019 & 2032
- Table 34: Japan Commercial Real Estate Market Revenue (Million) Forecast, by Application 2019 & 2032
- Table 35: India Commercial Real Estate Market Revenue (Million) Forecast, by Application 2019 & 2032
- Table 36: South Korea Commercial Real Estate Market Revenue (Million) Forecast, by Application 2019 & 2032
- Table 37: Rest of Asia Pacific Commercial Real Estate Market Revenue (Million) Forecast, by Application 2019 & 2032
- Table 38: Global Commercial Real Estate Market Revenue Million Forecast, by Type 2019 & 2032
- Table 39: Global Commercial Real Estate Market Revenue Million Forecast, by Country 2019 & 2032
- Table 40: United States Commercial Real Estate Market Revenue (Million) Forecast, by Application 2019 & 2032
- Table 41: Canada Commercial Real Estate Market Revenue (Million) Forecast, by Application 2019 & 2032
- Table 42: Global Commercial Real Estate Market Revenue Million Forecast, by Type 2019 & 2032
- Table 43: Global Commercial Real Estate Market Revenue Million Forecast, by Country 2019 & 2032
- Table 44: United Kingdom Commercial Real Estate Market Revenue (Million) Forecast, by Application 2019 & 2032
- Table 45: Germany Commercial Real Estate Market Revenue (Million) Forecast, by Application 2019 & 2032
- Table 46: France Commercial Real Estate Market Revenue (Million) Forecast, by Application 2019 & 2032
- Table 47: Russia Commercial Real Estate Market Revenue (Million) Forecast, by Application 2019 & 2032
- Table 48: Rest of Europe Commercial Real Estate Market Revenue (Million) Forecast, by Application 2019 & 2032
- Table 49: Global Commercial Real Estate Market Revenue Million Forecast, by Type 2019 & 2032
- Table 50: Global Commercial Real Estate Market Revenue Million Forecast, by Country 2019 & 2032
- Table 51: Saudi Arabia Commercial Real Estate Market Revenue (Million) Forecast, by Application 2019 & 2032
- Table 52: United Arab Emirates Commercial Real Estate Market Revenue (Million) Forecast, by Application 2019 & 2032
- Table 53: Qatar Commercial Real Estate Market Revenue (Million) Forecast, by Application 2019 & 2032
- Table 54: South Africa Commercial Real Estate Market Revenue (Million) Forecast, by Application 2019 & 2032
- Table 55: Rest of Middle East and Africa Commercial Real Estate Market Revenue (Million) Forecast, by Application 2019 & 2032
- Table 56: Global Commercial Real Estate Market Revenue Million Forecast, by Type 2019 & 2032
- Table 57: Global Commercial Real Estate Market Revenue Million Forecast, by Country 2019 & 2032
- Table 58: Brazil Commercial Real Estate Market Revenue (Million) Forecast, by Application 2019 & 2032
- Table 59: Mexico Commercial Real Estate Market Revenue (Million) Forecast, by Application 2019 & 2032
- Table 60: Argentina Commercial Real Estate Market Revenue (Million) Forecast, by Application 2019 & 2032
- Table 61: Colombia Commercial Real Estate Market Revenue (Million) Forecast, by Application 2019 & 2032
- Table 62: Rest of Latin America Commercial Real Estate Market Revenue (Million) Forecast, by Application 2019 & 2032
Frequently Asked Questions
1. What is the projected Compound Annual Growth Rate (CAGR) of the Commercial Real Estate Market?
The projected CAGR is approximately > 4.00%.
2. Which companies are prominent players in the Commercial Real Estate Market?
Key companies in the market include DLF Ltd, Link Asset Management Limited, Wanda Group, Prologis Inc, Boston Properties Inc, Brookfield Asset Management Inc, Segro, Nakheel PJSC, MaxWell Realty, Onni Contracting Ltd, Simon Property Group LP, Shannon waltchack LLC, ATC IP LLC, RAK Properties**List Not Exhaustive.
3. What are the main segments of the Commercial Real Estate Market?
The market segments include Type.
4. Can you provide details about the market size?
The market size is estimated to be USD XX Million as of 2022.
5. What are some drivers contributing to market growth?
4.; Increase in Aging Population Driving the Market4.; Healthcare and Long-term Care Needs Driving the Market.
6. What are the notable trends driving market growth?
Office Markets to Witness Increased Growth.
7. Are there any restraints impacting market growth?
4.; High Affordability and Cost of Care Affecting the Market4.; Staffing and Workforce Challenges Affecting the Market.
8. Can you provide examples of recent developments in the market?
November 2022 - Colliers CAAC, a regional holding company, currently holding exclusive sublicenses for Central America, the Caribbean, and certain Andean countries from Colliers International announced the acquisition of a Costa Rican real estate consultancy.
9. What pricing options are available for accessing the report?
Pricing options include single-user, multi-user, and enterprise licenses priced at USD 4750, USD 5250, and USD 8750 respectively.
10. Is the market size provided in terms of value or volume?
The market size is provided in terms of value, measured in Million.
11. Are there any specific market keywords associated with the report?
Yes, the market keyword associated with the report is "Commercial Real Estate Market," which aids in identifying and referencing the specific market segment covered.
12. How do I determine which pricing option suits my needs best?
The pricing options vary based on user requirements and access needs. Individual users may opt for single-user licenses, while businesses requiring broader access may choose multi-user or enterprise licenses for cost-effective access to the report.
13. Are there any additional resources or data provided in the Commercial Real Estate Market report?
While the report offers comprehensive insights, it's advisable to review the specific contents or supplementary materials provided to ascertain if additional resources or data are available.
14. How can I stay updated on further developments or reports in the Commercial Real Estate Market?
To stay informed about further developments, trends, and reports in the Commercial Real Estate Market, consider subscribing to industry newsletters, following relevant companies and organizations, or regularly checking reputable industry news sources and publications.
Methodology
Step 1 - Identification of Relevant Samples Size from Population Database


Step 2 - Approaches for Defining Global Market Size (Value, Volume* & Price*)

Note*: In applicable scenarios
Step 3 - Data Sources
Primary Research
- Web Analytics
- Survey Reports
- Research Institute
- Latest Research Reports
- Opinion Leaders
Secondary Research
- Annual Reports
- White Paper
- Latest Press Release
- Industry Association
- Paid Database
- Investor Presentations

Step 4 - Data Triangulation
Involves using different sources of information in order to increase the validity of a study
These sources are likely to be stakeholders in a program - participants, other researchers, program staff, other community members, and so on.
Then we put all data in single framework & apply various statistical tools to find out the dynamic on the market.
During the analysis stage, feedback from the stakeholder groups would be compared to determine areas of agreement as well as areas of divergence


