

Key Insights
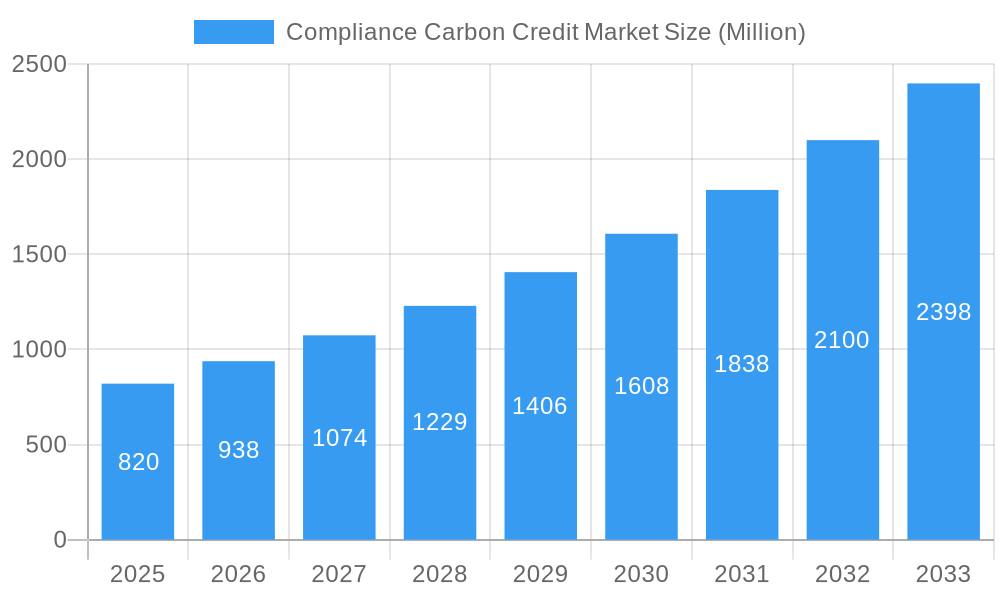
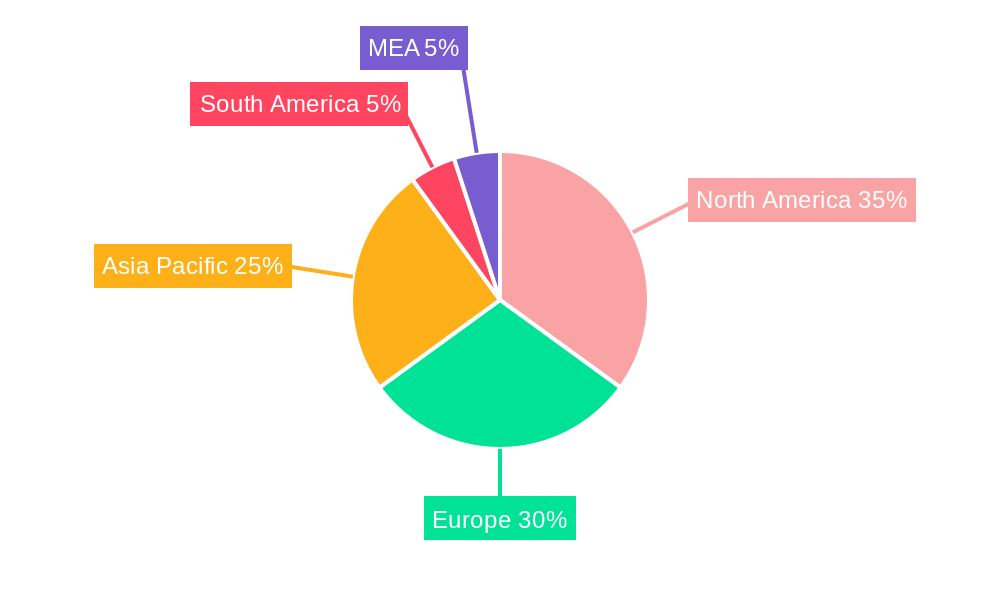
The compliance carbon credit market, valued at $820 million in 2025, is experiencing robust growth, projected to expand at a Compound Annual Growth Rate (CAGR) of 14.81% from 2025 to 2033. This surge is driven by increasing global awareness of climate change, stringent government regulations aimed at reducing carbon emissions, and the growing adoption of carbon offsetting programs by corporations striving to achieve net-zero targets. Key segments fueling this growth include renewable energy projects (solar, wind, etc.), forestry and land use initiatives (reforestation, afforestation), and energy efficiency improvements across various sectors. The energy sector, transportation, and industrial sectors are leading adopters, demonstrating a strong demand for compliance credits to meet their emission reduction obligations. North America and Europe currently hold significant market shares, but rapidly developing economies in Asia-Pacific are emerging as key growth drivers in the coming years. The increasing availability of high-quality carbon credits, coupled with technological advancements in monitoring and verification, are further contributing to market expansion. However, challenges remain, including concerns about the accuracy and verifiability of some carbon credits, potential for market manipulation, and the need for greater standardization and transparency across various crediting schemes.
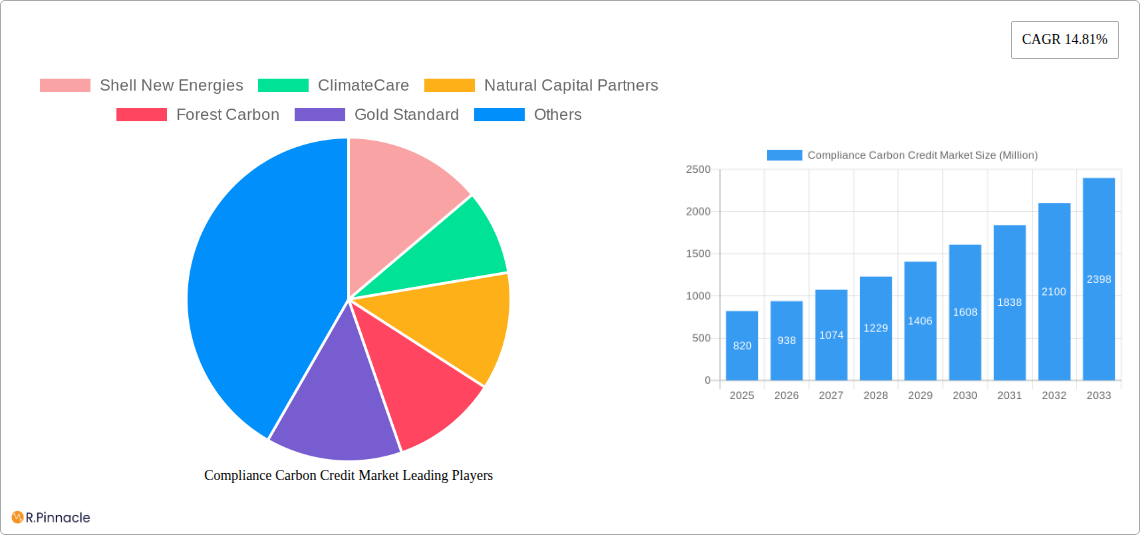
Compliance Carbon Credit Market Market Size (In Million)
The market’s growth is significantly influenced by the expanding regulatory landscape, with more countries implementing carbon pricing mechanisms and emissions trading schemes. Furthermore, corporate social responsibility initiatives and consumer demand for sustainable products and services are prompting businesses to proactively invest in carbon offsetting. The competitive landscape is dynamic, with established players like Shell New Energies and ClimateCare alongside numerous smaller players and emerging technology companies. This competition is fostering innovation in project development, verification, and trading, enhancing the market’s efficiency and transparency. Continued growth hinges on addressing challenges related to credit quality, establishing robust market governance, and fostering greater international collaboration to ensure the integrity and effectiveness of the compliance carbon credit market. Future projections indicate a substantial increase in market size driven by the intensifying global push towards decarbonization.
Compliance Carbon Credit Market Company Market Share
This in-depth report provides a comprehensive analysis of the Compliance Carbon Credit Market, offering valuable insights for industry professionals, investors, and policymakers. With a focus on market structure, dynamics, and future trends, this report covers the period from 2019 to 2033, using 2025 as the base year. The report projects a market size of xx Million by 2033, with a Compound Annual Growth Rate (CAGR) of xx% during the forecast period (2025-2033).
Compliance Carbon Credit Market Market Structure & Innovation Trends
The Compliance Carbon Credit Market exhibits a dynamic and evolving structure, characterized by a mix of established global leaders and agile emerging players. This competitive landscape fosters significant innovation, driven by the imperative to meet stringent regulatory requirements and capitalize on growing corporate sustainability mandates. While specific market share data is often proprietary and varies across different compliance schemes and project types, the presence of key entities such as Shell New Energies, ClimateCare, Natural Capital Partners, Forest Carbon, Gold Standard, 3Degrees, Carbon Trust, South Pole, and Atmosfair indicates a moderately concentrated market. Beyond these major participants, a vibrant ecosystem of numerous other companies (approximately 7+3) and organizations like Sustainable Travel International actively contributes to market liquidity and the development of new carbon reduction projects.
The dynamism of market share is intrinsically linked to advancements in carbon credit origination, rigorous verification methodologies, and the continuous adaptation of regulatory frameworks. The proliferation of Emissions Trading Schemes (ETS) globally has been a pivotal factor in shaping market architecture and accelerating its expansion. Mergers and acquisitions (M&A) activity remains a significant trend, with recent strategic consolidations valued at an estimated **[Insert specific M&A value here, e.g., $500 Million]** over the past five years, signaling a maturing market. The increasing demand for credible carbon offsets, coupled with an evolving regulatory landscape, acts as a potent catalyst for innovation. While internal carbon pricing mechanisms represent a competitive substitute, the appeal of tangible carbon credits is broadening, with end-users now encompassing a diverse array of industries and organizational types seeking verifiable emissions reductions.
Compliance Carbon Credit Market Market Dynamics & Trends
The Compliance Carbon Credit Market is fundamentally propelled by the convergence of strict environmental legislation, amplified global concern regarding climate change impacts, and the escalating integration of carbon offsetting strategies across a multitude of economic sectors. Technological breakthroughs in monitoring, reporting, verification (MRV) systems, and sophisticated trading platforms are significantly enhancing market operational efficiency and transparency. Consumer and investor preferences are demonstrably shifting towards prioritizing environmentally sound practices, thereby amplifying the demand for high-integrity carbon credits. This heightened demand, coupled with the drive to meet regulatory obligations, fuels intense competitive pressure within the market. Companies are actively investing in the development of novel and impactful carbon reduction and removal projects, alongside innovative service offerings, to secure a competitive advantage and establish market leadership.
The market is projected to experience robust growth, with an estimated Compound Annual Growth Rate (CAGR) of **[Insert specific CAGR percentage here, e.g., 15%]** during the forecast period. This expansion is primarily attributed to the global proliferation of carbon pricing mechanisms and the steadfast commitment of corporations to achieving ambitious sustainability targets. Market penetration is anticipated to rise significantly, potentially reaching **[Insert specific market penetration percentage here, e.g., 40%]** by 2033, indicating a substantial increase in the adoption and utilization of compliance carbon credits.
Dominant Regions & Segments in Compliance Carbon Credit Market
This section identifies the leading regions and segments within the Compliance Carbon Credit Market. The analysis reveals a strong presence across multiple regions, although a specific regional leader is not readily ascertainable without proprietary data.
Key Drivers:
By Type of Credits:
- Renewable Energy Projects: Government incentives and falling renewable energy costs drive growth.
- Forestry and Land Use: Rising awareness of deforestation and its carbon footprint is fueling demand.
- Energy Efficiency: Stringent energy efficiency regulations and cost savings opportunities are key drivers.
- Industrial Process Improvements: Focus on reducing emissions from industrial processes enhances demand.
By Sector:
- Energy Sector: Stringent emission standards and regulations are driving demand.
- Transportation: Growing focus on reducing carbon emissions from transportation fuels demand.
- Industrial Sector: Industrial emissions reduction initiatives are key market drivers.
- Agriculture and Forestry: Focus on sustainable land management and emission reduction strategies fuels growth.
The dominance of any particular region or segment depends heavily on factors such as the stringency of environmental regulations, the level of government support, and the specific developmental stage of the carbon market within each jurisdiction.
Compliance Carbon Credit Market Product Innovations
Recent years have seen significant innovation in carbon credit methodologies, including the development of more precise measurement and verification techniques. Technology plays a vital role in streamlining the carbon credit lifecycle, from project development and monitoring to trading and retirement. These innovations enhance the transparency, integrity, and efficiency of the market, improving market confidence and driving adoption. The focus on technology and rigorous methodologies fosters greater market trust and enhances the credibility of carbon credits as an effective climate change mitigation tool.
Report Scope & Segmentation Analysis
This report segments the Compliance Carbon Credit Market by type of credit (Renewable Energy Projects, Forestry and Land Use, Energy Efficiency, Industrial Process Improvements) and sector (Energy Sector, Transportation, Industrial Sector, Agriculture and Forestry). Each segment offers unique growth opportunities and faces specific challenges. Growth projections vary across segments and are dependent upon individual sector regulatory frameworks and technological advancements. Market size estimations for each segment are proprietary and vary year on year. Competitive dynamics within each segment are influenced by the presence of both established players and niche entrants.
Key Drivers of Compliance Carbon Credit Market Growth
The sustained growth of the Compliance Carbon Credit Market is underpinned by a confluence of powerful driving forces. Paramount among these are the increasingly stringent government regulations and international agreements specifically designed to curb carbon emissions and foster decarbonization. Complementing this regulatory imperative are the escalating corporate sustainability goals and the heightened demand from consumers and stakeholders for ethically produced and environmentally responsible products and services, which collectively spur market expansion. Technological advancements continue to play a crucial role, simplifying the entire carbon credit lifecycle—from project development and generation to robust monitoring and transparent trading. Furthermore, a heightened global awareness of the multifaceted consequences of climate change is galvanizing action and fostering a more receptive environment for carbon market mechanisms.
Challenges in the Compliance Carbon Credit Market Sector
The Compliance Carbon Credit Market faces several challenges. Ensuring the quality and integrity of carbon credits remains a key hurdle. Supply chain issues in specific regions could also create bottlenecks. Lastly, competitive pressures from various alternative mitigation approaches and potential market volatility present challenges to sustained growth. Precise quantification of these challenges requires in-depth analysis of individual market segments.
Emerging Opportunities in Compliance Carbon Credit Market
Several opportunities are emerging within the Compliance Carbon Credit Market. Expansion into new geographic markets, particularly in developing economies, offers substantial growth potential. Technological advancements in carbon credit generation and verification are fostering new opportunities. The development of innovative carbon offsetting projects also creates new pathways to emission reduction and market expansion.
Leading Players in the Compliance Carbon Credit Market Market
- Shell New Energies
- ClimateCare
- Natural Capital Partners
- Forest Carbon
- Gold Standard
- 3Degrees
- Carbon Trust
- South Pole
- Atmosfair
- 7 + 3 Other Companies
- Sustainable Travel International
Key Developments in Compliance Carbon Credit Market Industry
- April 2024: Significant progress was observed in regional initiatives aimed at linking carbon markets across the Western United States and Canada, with key jurisdictions like California, Quebec, and Washington exploring deeper integration. This development holds the potential to reshape trading dynamics and enhance market liquidity within these connected regions.
- January 2024: The Commodity Futures Trading Commission (CFTC) released proposed guidance concerning the listing of derivative contracts for voluntary carbon credits (VCCs). This move represents a critical step towards establishing greater standardization, transparency, and ultimately, enhanced liquidity within the voluntary carbon market, which can indirectly influence the compliance market.
Future Outlook for Compliance Carbon Credit Market Market
The Compliance Carbon Credit Market is on a trajectory for substantial and sustained growth in the coming years. This optimistic outlook is fueled by a trifecta of influential factors: intensifying regulatory pressures demanding emissions reductions, an unwavering commitment from corporations to meet ambitious sustainability and net-zero targets, and the continuous acceleration of technological innovation across the value chain. To capitalize on this burgeoning opportunity, strategic partnerships, significant investments in pioneering carbon reduction and removal projects, and the cultivation of robust, transparent, and efficient trading platforms will be indispensable. Furthermore, the market's expansion into new geographic territories and the continuous refinement of its governance and integrity frameworks will be vital for maintaining momentum and ensuring long-term viability and credibility.
Compliance Carbon Credit Market Segmentation
-
1. Type of Credits
- 1.1. Renewable Energy Projects
- 1.2. Forestry and Land Use
- 1.3. Energy Efficiency
- 1.4. Industrial Process Improvements
-
2. Sector
- 2.1. Energy Sector
- 2.2. Transportation
- 2.3. Industrial Sector
- 2.4. Agriculture and Forestry
Compliance Carbon Credit Market Segmentation By Geography
-
1. North America
- 1.1. United States
- 1.2. Canada
-
2. Europe
- 2.1. United Kingdom
- 2.2. Germany
- 2.3. France
- 2.4. Rest of Europe
-
3. Asia Pacific
- 3.1. China
- 3.2. Japan
- 3.3. India
- 3.4. South Korea
- 3.5. Rest of Asia Pacific
- 4. Middle East and Africa
- 5. Latin America
Compliance Carbon Credit Market Regional Market Share
Geographic Coverage of Compliance Carbon Credit Market
Compliance Carbon Credit Market REPORT HIGHLIGHTS
| Aspects | Details |
|---|---|
| Study Period | 2020-2034 |
| Base Year | 2025 |
| Estimated Year | 2026 |
| Forecast Period | 2026-2034 |
| Historical Period | 2020-2025 |
| Growth Rate | CAGR of 14.81% from 2020-2034 |
| Segmentation |
|
Table of Contents
- 1. Introduction
- 1.1. Research Scope
- 1.2. Market Segmentation
- 1.3. Research Objective
- 1.4. Definitions and Assumptions
- 2. Executive Summary
- 2.1. Market Snapshot
- 3. Market Dynamics
- 3.1. Market Drivers
- 3.2. Market Restrains
- 3.3. Market Trends
- 3.4. Market Opportunities
- 4. Market Factor Analysis
- 4.1. Porters Five Forces
- 4.1.1. Bargaining Power of Suppliers
- 4.1.2. Bargaining Power of Buyers
- 4.1.3. Threat of New Entrants
- 4.1.4. Threat of Substitutes
- 4.1.5. Competitive Rivalry
- 4.2. PESTEL analysis
- 4.3. BCG Analysis
- 4.3.1. Stars (High Growth, High Market Share)
- 4.3.2. Cash Cows (Low Growth, High Market Share)
- 4.3.3. Question Mark (High Growth, Low Market Share)
- 4.3.4. Dogs (Low Growth, Low Market Share)
- 4.4. Ansoff Matrix Analysis
- 4.5. Supply Chain Analysis
- 4.6. Regulatory Landscape
- 4.7. Current Market Potential and Opportunity Assessment (TAM–SAM–SOM Framework)
- 4.8. PRI Analyst Note
- 4.1. Porters Five Forces
- 5. Market Analysis, Insights and Forecast 2021-2033
- 5.1. Market Analysis, Insights and Forecast - by Type of Credits
- 5.1.1. Renewable Energy Projects
- 5.1.2. Forestry and Land Use
- 5.1.3. Energy Efficiency
- 5.1.4. Industrial Process Improvements
- 5.2. Market Analysis, Insights and Forecast - by Sector
- 5.2.1. Energy Sector
- 5.2.2. Transportation
- 5.2.3. Industrial Sector
- 5.2.4. Agriculture and Forestry
- 5.3. Market Analysis, Insights and Forecast - by Region
- 5.3.1. North America
- 5.3.2. Europe
- 5.3.3. Asia Pacific
- 5.3.4. Middle East and Africa
- 5.3.5. Latin America
- 5.1. Market Analysis, Insights and Forecast - by Type of Credits
- 6. Global Compliance Carbon Credit Market Analysis, Insights and Forecast, 2021-2033
- 6.1. Market Analysis, Insights and Forecast - by Type of Credits
- 6.1.1. Renewable Energy Projects
- 6.1.2. Forestry and Land Use
- 6.1.3. Energy Efficiency
- 6.1.4. Industrial Process Improvements
- 6.2. Market Analysis, Insights and Forecast - by Sector
- 6.2.1. Energy Sector
- 6.2.2. Transportation
- 6.2.3. Industrial Sector
- 6.2.4. Agriculture and Forestry
- 6.1. Market Analysis, Insights and Forecast - by Type of Credits
- 7. North America Compliance Carbon Credit Market Analysis, Insights and Forecast, 2020-2032
- 7.1. Market Analysis, Insights and Forecast - by Type of Credits
- 7.1.1. Renewable Energy Projects
- 7.1.2. Forestry and Land Use
- 7.1.3. Energy Efficiency
- 7.1.4. Industrial Process Improvements
- 7.2. Market Analysis, Insights and Forecast - by Sector
- 7.2.1. Energy Sector
- 7.2.2. Transportation
- 7.2.3. Industrial Sector
- 7.2.4. Agriculture and Forestry
- 7.1. Market Analysis, Insights and Forecast - by Type of Credits
- 8. Europe Compliance Carbon Credit Market Analysis, Insights and Forecast, 2020-2032
- 8.1. Market Analysis, Insights and Forecast - by Type of Credits
- 8.1.1. Renewable Energy Projects
- 8.1.2. Forestry and Land Use
- 8.1.3. Energy Efficiency
- 8.1.4. Industrial Process Improvements
- 8.2. Market Analysis, Insights and Forecast - by Sector
- 8.2.1. Energy Sector
- 8.2.2. Transportation
- 8.2.3. Industrial Sector
- 8.2.4. Agriculture and Forestry
- 8.1. Market Analysis, Insights and Forecast - by Type of Credits
- 9. Asia Pacific Compliance Carbon Credit Market Analysis, Insights and Forecast, 2020-2032
- 9.1. Market Analysis, Insights and Forecast - by Type of Credits
- 9.1.1. Renewable Energy Projects
- 9.1.2. Forestry and Land Use
- 9.1.3. Energy Efficiency
- 9.1.4. Industrial Process Improvements
- 9.2. Market Analysis, Insights and Forecast - by Sector
- 9.2.1. Energy Sector
- 9.2.2. Transportation
- 9.2.3. Industrial Sector
- 9.2.4. Agriculture and Forestry
- 9.1. Market Analysis, Insights and Forecast - by Type of Credits
- 10. Middle East and Africa Compliance Carbon Credit Market Analysis, Insights and Forecast, 2020-2032
- 10.1. Market Analysis, Insights and Forecast - by Type of Credits
- 10.1.1. Renewable Energy Projects
- 10.1.2. Forestry and Land Use
- 10.1.3. Energy Efficiency
- 10.1.4. Industrial Process Improvements
- 10.2. Market Analysis, Insights and Forecast - by Sector
- 10.2.1. Energy Sector
- 10.2.2. Transportation
- 10.2.3. Industrial Sector
- 10.2.4. Agriculture and Forestry
- 10.1. Market Analysis, Insights and Forecast - by Type of Credits
- 11. Latin America Compliance Carbon Credit Market Analysis, Insights and Forecast, 2020-2032
- 11.1. Market Analysis, Insights and Forecast - by Type of Credits
- 11.1.1. Renewable Energy Projects
- 11.1.2. Forestry and Land Use
- 11.1.3. Energy Efficiency
- 11.1.4. Industrial Process Improvements
- 11.2. Market Analysis, Insights and Forecast - by Sector
- 11.2.1. Energy Sector
- 11.2.2. Transportation
- 11.2.3. Industrial Sector
- 11.2.4. Agriculture and Forestry
- 11.1. Market Analysis, Insights and Forecast - by Type of Credits
- 12. Competitive Analysis
- 12.1. Company Profiles
- 12.1.1 Shell New Energies
- 12.1.1.1. Company Overview
- 12.1.1.2. Products
- 12.1.1.3. Company Financials
- 12.1.1.4. SWOT Analysis
- 12.1.2 ClimateCare
- 12.1.2.1. Company Overview
- 12.1.2.2. Products
- 12.1.2.3. Company Financials
- 12.1.2.4. SWOT Analysis
- 12.1.3 Natural Capital Partners
- 12.1.3.1. Company Overview
- 12.1.3.2. Products
- 12.1.3.3. Company Financials
- 12.1.3.4. SWOT Analysis
- 12.1.4 Forest Carbon
- 12.1.4.1. Company Overview
- 12.1.4.2. Products
- 12.1.4.3. Company Financials
- 12.1.4.4. SWOT Analysis
- 12.1.5 Gold Standard
- 12.1.5.1. Company Overview
- 12.1.5.2. Products
- 12.1.5.3. Company Financials
- 12.1.5.4. SWOT Analysis
- 12.1.6 3Degrees
- 12.1.6.1. Company Overview
- 12.1.6.2. Products
- 12.1.6.3. Company Financials
- 12.1.6.4. SWOT Analysis
- 12.1.7 Carbon Trust
- 12.1.7.1. Company Overview
- 12.1.7.2. Products
- 12.1.7.3. Company Financials
- 12.1.7.4. SWOT Analysis
- 12.1.8 South Pole
- 12.1.8.1. Company Overview
- 12.1.8.2. Products
- 12.1.8.3. Company Financials
- 12.1.8.4. SWOT Analysis
- 12.1.9 Atmosfair**List Not Exhaustive 7 3 Other Companie
- 12.1.9.1. Company Overview
- 12.1.9.2. Products
- 12.1.9.3. Company Financials
- 12.1.9.4. SWOT Analysis
- 12.1.10 Sustainable Travel International
- 12.1.10.1. Company Overview
- 12.1.10.2. Products
- 12.1.10.3. Company Financials
- 12.1.10.4. SWOT Analysis
- 12.1.1 Shell New Energies
- 12.2. Market Entropy
- 12.2.1 Company's Key Areas Served
- 12.2.2 Recent Developments
- 12.3. Company Market Share Analysis 2025
- 12.3.1 Top 5 Companies Market Share Analysis
- 12.3.2 Top 3 Companies Market Share Analysis
- 12.4. List of Potential Customers
- 13. Research Methodology
List of Figures
- Figure 1: Global Compliance Carbon Credit Market Revenue Breakdown (Million, %) by Region 2025 & 2033
- Figure 2: North America Compliance Carbon Credit Market Revenue (Million), by Type of Credits 2025 & 2033
- Figure 3: North America Compliance Carbon Credit Market Revenue Share (%), by Type of Credits 2025 & 2033
- Figure 4: North America Compliance Carbon Credit Market Revenue (Million), by Sector 2025 & 2033
- Figure 5: North America Compliance Carbon Credit Market Revenue Share (%), by Sector 2025 & 2033
- Figure 6: North America Compliance Carbon Credit Market Revenue (Million), by Country 2025 & 2033
- Figure 7: North America Compliance Carbon Credit Market Revenue Share (%), by Country 2025 & 2033
- Figure 8: Europe Compliance Carbon Credit Market Revenue (Million), by Type of Credits 2025 & 2033
- Figure 9: Europe Compliance Carbon Credit Market Revenue Share (%), by Type of Credits 2025 & 2033
- Figure 10: Europe Compliance Carbon Credit Market Revenue (Million), by Sector 2025 & 2033
- Figure 11: Europe Compliance Carbon Credit Market Revenue Share (%), by Sector 2025 & 2033
- Figure 12: Europe Compliance Carbon Credit Market Revenue (Million), by Country 2025 & 2033
- Figure 13: Europe Compliance Carbon Credit Market Revenue Share (%), by Country 2025 & 2033
- Figure 14: Asia Pacific Compliance Carbon Credit Market Revenue (Million), by Type of Credits 2025 & 2033
- Figure 15: Asia Pacific Compliance Carbon Credit Market Revenue Share (%), by Type of Credits 2025 & 2033
- Figure 16: Asia Pacific Compliance Carbon Credit Market Revenue (Million), by Sector 2025 & 2033
- Figure 17: Asia Pacific Compliance Carbon Credit Market Revenue Share (%), by Sector 2025 & 2033
- Figure 18: Asia Pacific Compliance Carbon Credit Market Revenue (Million), by Country 2025 & 2033
- Figure 19: Asia Pacific Compliance Carbon Credit Market Revenue Share (%), by Country 2025 & 2033
- Figure 20: Middle East and Africa Compliance Carbon Credit Market Revenue (Million), by Type of Credits 2025 & 2033
- Figure 21: Middle East and Africa Compliance Carbon Credit Market Revenue Share (%), by Type of Credits 2025 & 2033
- Figure 22: Middle East and Africa Compliance Carbon Credit Market Revenue (Million), by Sector 2025 & 2033
- Figure 23: Middle East and Africa Compliance Carbon Credit Market Revenue Share (%), by Sector 2025 & 2033
- Figure 24: Middle East and Africa Compliance Carbon Credit Market Revenue (Million), by Country 2025 & 2033
- Figure 25: Middle East and Africa Compliance Carbon Credit Market Revenue Share (%), by Country 2025 & 2033
- Figure 26: Latin America Compliance Carbon Credit Market Revenue (Million), by Type of Credits 2025 & 2033
- Figure 27: Latin America Compliance Carbon Credit Market Revenue Share (%), by Type of Credits 2025 & 2033
- Figure 28: Latin America Compliance Carbon Credit Market Revenue (Million), by Sector 2025 & 2033
- Figure 29: Latin America Compliance Carbon Credit Market Revenue Share (%), by Sector 2025 & 2033
- Figure 30: Latin America Compliance Carbon Credit Market Revenue (Million), by Country 2025 & 2033
- Figure 31: Latin America Compliance Carbon Credit Market Revenue Share (%), by Country 2025 & 2033
List of Tables
- Table 1: Global Compliance Carbon Credit Market Revenue Million Forecast, by Type of Credits 2020 & 2033
- Table 2: Global Compliance Carbon Credit Market Revenue Million Forecast, by Sector 2020 & 2033
- Table 3: Global Compliance Carbon Credit Market Revenue Million Forecast, by Region 2020 & 2033
- Table 4: Global Compliance Carbon Credit Market Revenue Million Forecast, by Type of Credits 2020 & 2033
- Table 5: Global Compliance Carbon Credit Market Revenue Million Forecast, by Sector 2020 & 2033
- Table 6: Global Compliance Carbon Credit Market Revenue Million Forecast, by Country 2020 & 2033
- Table 7: United States Compliance Carbon Credit Market Revenue (Million) Forecast, by Application 2020 & 2033
- Table 8: Canada Compliance Carbon Credit Market Revenue (Million) Forecast, by Application 2020 & 2033
- Table 9: Global Compliance Carbon Credit Market Revenue Million Forecast, by Type of Credits 2020 & 2033
- Table 10: Global Compliance Carbon Credit Market Revenue Million Forecast, by Sector 2020 & 2033
- Table 11: Global Compliance Carbon Credit Market Revenue Million Forecast, by Country 2020 & 2033
- Table 12: United Kingdom Compliance Carbon Credit Market Revenue (Million) Forecast, by Application 2020 & 2033
- Table 13: Germany Compliance Carbon Credit Market Revenue (Million) Forecast, by Application 2020 & 2033
- Table 14: France Compliance Carbon Credit Market Revenue (Million) Forecast, by Application 2020 & 2033
- Table 15: Rest of Europe Compliance Carbon Credit Market Revenue (Million) Forecast, by Application 2020 & 2033
- Table 16: Global Compliance Carbon Credit Market Revenue Million Forecast, by Type of Credits 2020 & 2033
- Table 17: Global Compliance Carbon Credit Market Revenue Million Forecast, by Sector 2020 & 2033
- Table 18: Global Compliance Carbon Credit Market Revenue Million Forecast, by Country 2020 & 2033
- Table 19: China Compliance Carbon Credit Market Revenue (Million) Forecast, by Application 2020 & 2033
- Table 20: Japan Compliance Carbon Credit Market Revenue (Million) Forecast, by Application 2020 & 2033
- Table 21: India Compliance Carbon Credit Market Revenue (Million) Forecast, by Application 2020 & 2033
- Table 22: South Korea Compliance Carbon Credit Market Revenue (Million) Forecast, by Application 2020 & 2033
- Table 23: Rest of Asia Pacific Compliance Carbon Credit Market Revenue (Million) Forecast, by Application 2020 & 2033
- Table 24: Global Compliance Carbon Credit Market Revenue Million Forecast, by Type of Credits 2020 & 2033
- Table 25: Global Compliance Carbon Credit Market Revenue Million Forecast, by Sector 2020 & 2033
- Table 26: Global Compliance Carbon Credit Market Revenue Million Forecast, by Country 2020 & 2033
- Table 27: Global Compliance Carbon Credit Market Revenue Million Forecast, by Type of Credits 2020 & 2033
- Table 28: Global Compliance Carbon Credit Market Revenue Million Forecast, by Sector 2020 & 2033
- Table 29: Global Compliance Carbon Credit Market Revenue Million Forecast, by Country 2020 & 2033
Frequently Asked Questions
1. What is the projected Compound Annual Growth Rate (CAGR) of the Compliance Carbon Credit Market?
The projected CAGR is approximately 14.81%.
2. Which companies are prominent players in the Compliance Carbon Credit Market?
Key companies in the market include Shell New Energies, ClimateCare, Natural Capital Partners, Forest Carbon, Gold Standard, 3Degrees, Carbon Trust, South Pole, Atmosfair**List Not Exhaustive 7 3 Other Companie, Sustainable Travel International.
3. What are the main segments of the Compliance Carbon Credit Market?
The market segments include Type of Credits, Sector.
4. Can you provide details about the market size?
The market size is estimated to be USD 0.82 Million as of 2022.
5. What are some drivers contributing to market growth?
Regulatory Mandates and Policies; Growing Corporate Sustainability Initiatives.
6. What are the notable trends driving market growth?
Charting the Course of Carbon Pricing: UK-ETS Post-Brexit.
7. Are there any restraints impacting market growth?
Market Complexity and Uncertainty.
8. Can you provide examples of recent developments in the market?
April 2024: Regional efforts in the Western United States and Canada are gaining momentum as the urgency of combating climate change increases. Plans to link their carbon markets are being drawn up in California, Quebec, and Washington, which could significantly affect trading dynamics. The three authorities intend to work together to create a more extensive carbon credit market as soon as their proposed alliance takes effect.
9. What pricing options are available for accessing the report?
Pricing options include single-user, multi-user, and enterprise licenses priced at USD 4750, USD 5250, and USD 8750 respectively.
10. Is the market size provided in terms of value or volume?
The market size is provided in terms of value, measured in Million.
11. Are there any specific market keywords associated with the report?
Yes, the market keyword associated with the report is "Compliance Carbon Credit Market," which aids in identifying and referencing the specific market segment covered.
12. How do I determine which pricing option suits my needs best?
The pricing options vary based on user requirements and access needs. Individual users may opt for single-user licenses, while businesses requiring broader access may choose multi-user or enterprise licenses for cost-effective access to the report.
13. Are there any additional resources or data provided in the Compliance Carbon Credit Market report?
While the report offers comprehensive insights, it's advisable to review the specific contents or supplementary materials provided to ascertain if additional resources or data are available.
14. How can I stay updated on further developments or reports in the Compliance Carbon Credit Market?
To stay informed about further developments, trends, and reports in the Compliance Carbon Credit Market, consider subscribing to industry newsletters, following relevant companies and organizations, or regularly checking reputable industry news sources and publications.
Methodology
Step 1 - Identification of Relevant Samples Size from Population Database


Step 2 - Approaches for Defining Global Market Size (Value, Volume* & Price*)

Note*: In applicable scenarios
Step 3 - Data Sources
Primary Research
- Web Analytics
- Survey Reports
- Research Institute
- Latest Research Reports
- Opinion Leaders
Secondary Research
- Annual Reports
- White Paper
- Latest Press Release
- Industry Association
- Paid Database
- Investor Presentations

Step 4 - Data Triangulation
Involves using different sources of information in order to increase the validity of a study
These sources are likely to be stakeholders in a program - participants, other researchers, program staff, other community members, and so on.
Then we put all data in single framework & apply various statistical tools to find out the dynamic on the market.
During the analysis stage, feedback from the stakeholder groups would be compared to determine areas of agreement as well as areas of divergence