Key Insights
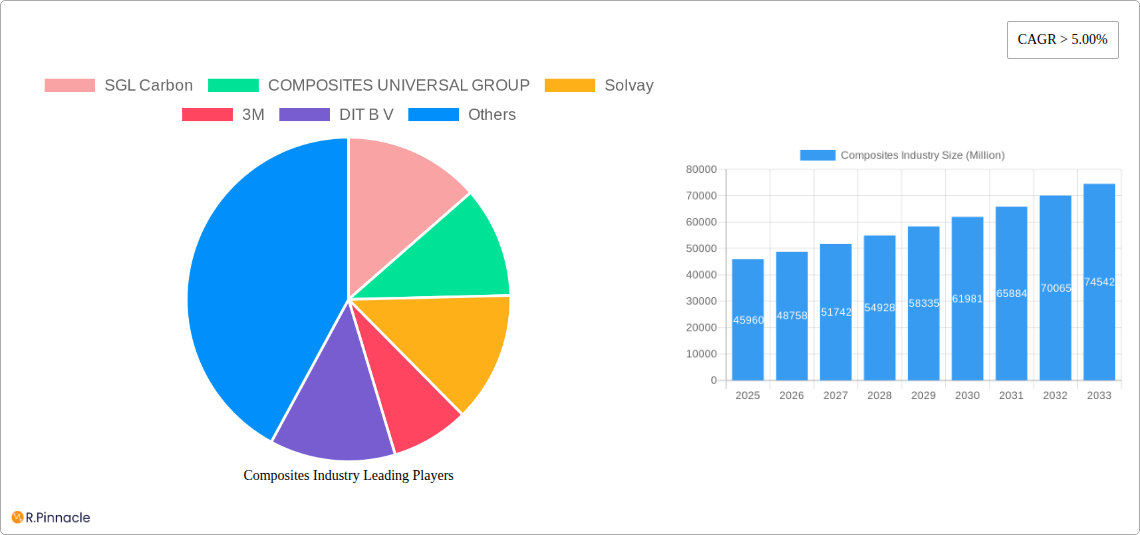
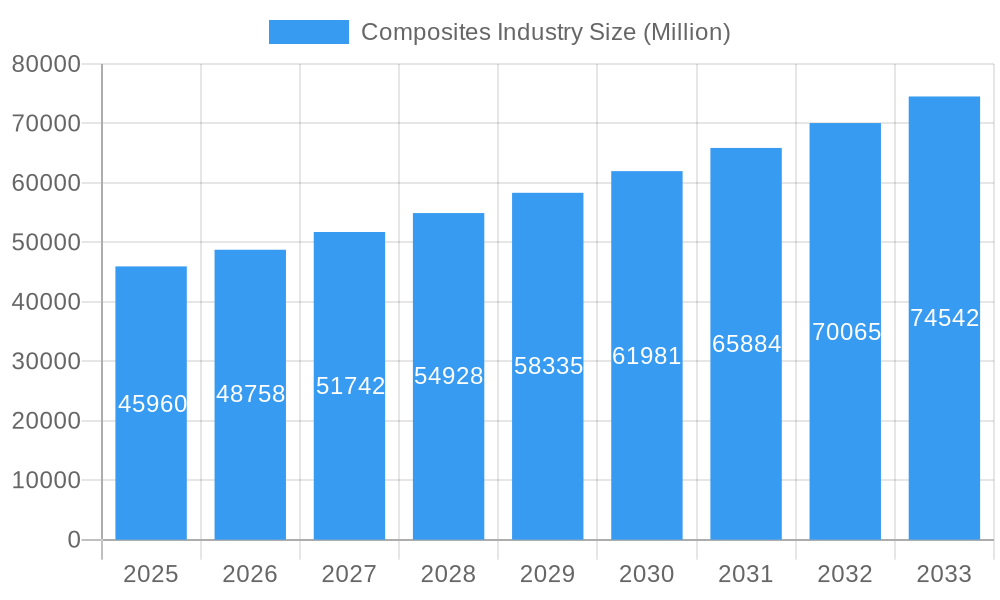
The global composites market, valued at $45.96 billion in 2025, is projected to experience robust growth, exhibiting a Compound Annual Growth Rate (CAGR) exceeding 5% from 2025 to 2033. This expansion is driven by several key factors. The increasing demand for lightweight yet high-strength materials in the automotive and transportation sectors is a primary driver, as manufacturers strive to improve fuel efficiency and reduce emissions. Furthermore, the burgeoning renewable energy sector, particularly wind energy, significantly contributes to market growth, with composites playing a crucial role in turbine blade construction. Aerospace and defense applications also represent a substantial market segment, leveraging composites' superior performance characteristics in demanding environments. Growth is further fueled by advancements in material science, leading to the development of innovative composites with enhanced properties, such as improved durability, thermal resistance, and recyclability. While the high initial cost of composite materials can act as a restraint, ongoing technological advancements and economies of scale are mitigating this factor. The market is segmented by matrix material (polymer, ceramic/carbon, metal), reinforcement fiber (glass, carbon, aramid), and end-use application (automotive, wind energy, aerospace, construction, etc.), offering diverse growth opportunities across various sectors. Key players like SGL Carbon, Solvay, 3M, and Toray Industries are driving innovation and shaping market dynamics through product development, strategic partnerships, and acquisitions.
Composites Industry Market Size (In Billion)
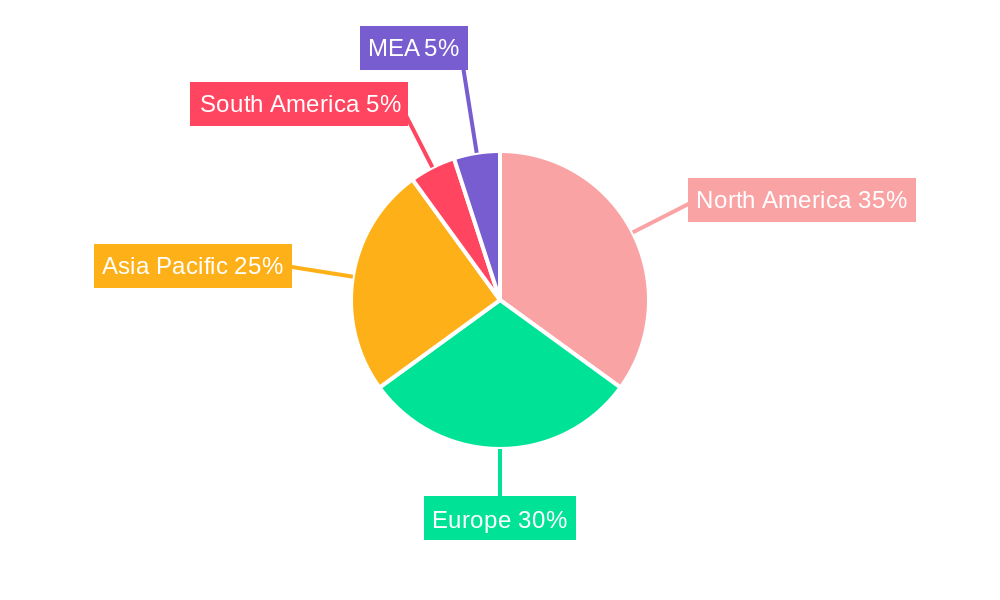
The regional distribution of the composites market reflects the concentration of manufacturing and end-use industries. North America and Europe currently hold significant market shares, driven by established automotive, aerospace, and wind energy sectors. However, the Asia-Pacific region is expected to witness the fastest growth due to rapid industrialization, infrastructure development, and increasing investments in renewable energy projects within countries like China and India. South America and the Middle East and Africa regions also present significant, albeit smaller, growth potentials as their economies develop and adopt advanced materials for diverse applications. The forecast period of 2025-2033 will likely see continued market expansion, fueled by technological advancements, government regulations promoting sustainable materials, and the ever-increasing demand for lightweight, high-performance materials across multiple industries. This growth trajectory indicates a promising future for the composites industry.
Composites Industry Company Market Share
Composites Industry Market Report: 2019-2033
This comprehensive report provides an in-depth analysis of the global composites industry, offering valuable insights for industry professionals, investors, and researchers. Covering the period 2019-2033, with a focus on 2025, this report leverages extensive data and analysis to uncover key trends, opportunities, and challenges within this dynamic sector. The market is projected to reach USD xx Billion by 2033.
Composites Industry Market Structure & Innovation Trends
The global composites market is characterized by a moderately concentrated structure, with key players like SGL Carbon, Composites Universal Group, Solvay, 3M, DIT B V, Owens Corning, DuPont, Toray Industries Inc., Mitsubishi Chemical Group Corporation, Hexcel Corporation, Teijin Limited, and Materion Corporation holding significant market share. However, the presence of numerous smaller players ensures a competitive landscape. Innovation is driven by advancements in materials science, particularly in the development of high-performance fibers like carbon fiber and aramid fiber, and novel matrix systems. Stringent environmental regulations are pushing the industry towards sustainable composite materials and manufacturing processes. The market also witnesses significant M&A activity, exemplified by Owens Corning's USD 3.9 Billion acquisition of Masonite in February 2024, strengthening its position in building and construction materials. Other substitutes like traditional metals are being challenged by the increasing performance-to-weight ratio of composites.
- Market Concentration: Moderately concentrated, with top players holding xx% market share in 2025.
- Innovation Drivers: Advancements in fiber technology, matrix materials, and manufacturing processes.
- Regulatory Frameworks: Growing emphasis on sustainability and environmental impact.
- M&A Activity: Significant activity, with deal values exceeding USD xx Billion in the past five years. Examples include the Solvay-Spirit AeroSystems collaboration and the Owens Corning acquisition mentioned above.
- Product Substitutes: Traditional materials like steel and aluminum.
- End-User Demographics: Diversified, encompassing various sectors including automotive, aerospace, and wind energy.
Composites Industry Market Dynamics & Trends
The composites market exhibits robust growth, driven primarily by increasing demand across various end-use sectors. The automotive and aerospace industries are major contributors, fueled by the lightweighting trend and the need for improved fuel efficiency. The renewable energy sector, particularly wind energy, also presents a significant growth driver. Technological advancements in fiber reinforcement, matrix materials and manufacturing techniques are further propelling market expansion. Consumer preferences are shifting towards high-performance, sustainable, and cost-effective composites. Competitive dynamics are shaped by technological innovation, pricing strategies, and strategic partnerships. The market is expected to register a CAGR of xx% during the forecast period (2025-2033), with market penetration increasing in emerging economies.
Dominant Regions & Segments in Composites Industry
The North American and European regions currently dominate the composites market, driven by strong industrial bases and technological advancements. Asia-Pacific is experiencing rapid growth, propelled by increasing manufacturing and infrastructure development.
Leading Segments:
Matrix Material: Polymer Matrix Composites (PMC) dominate, followed by Ceramic/Carbon Matrix Composites (CMCs) experiencing increasing adoption in high-temperature applications. Metal Matrix Composites represent a niche market.
Reinforcement Fiber: Carbon fiber leads in high-value applications due to its exceptional strength and stiffness, while glass fiber retains its dominance in cost-sensitive applications. Aramid fiber holds a niche but significant share in specialized applications.
End-use Application: The automotive and transportation sector is the largest consumer, followed by aerospace and defense and wind energy.
Key Drivers (Regional):
- North America: Strong aerospace and automotive industries, technological advancements.
- Europe: Established manufacturing base, focus on sustainability.
- Asia-Pacific: Rapid industrialization, infrastructure development, rising disposable incomes.
Composites Industry Product Innovations
Recent innovations focus on lighter, stronger, and more sustainable composite materials. This includes advancements in nanotechnology, bio-based composites, and self-healing materials. These innovations are driven by the need for enhanced performance, reduced weight, and improved environmental friendliness. The market is seeing increased adoption of automated manufacturing processes to improve efficiency and reduce costs.
Report Scope & Segmentation Analysis
This report provides a comprehensive segmentation analysis of the global composites market. It covers matrix materials (PMC, CMC, MMC), reinforcement fibers (glass fiber, carbon fiber, aramid fiber, other fibers), and various end-use applications (automotive, aerospace, wind energy, construction, etc.). Each segment’s growth projections, market sizes, and competitive dynamics are analyzed in detail. For example, the PMC segment is projected to maintain a significant market share due to its cost-effectiveness and versatility. The carbon fiber segment exhibits the highest growth potential, driven by its superior performance characteristics.
Key Drivers of Composites Industry Growth
The growth of the composites industry is fueled by several factors. The increasing demand for lightweight materials in automotive and aerospace applications is a key driver. The growing renewable energy sector, particularly wind energy, is also significantly boosting the market. Technological advancements lead to the development of high-performance and cost-effective composites. Government regulations promoting sustainable materials further stimulate industry growth.
Challenges in the Composites Industry Sector
The composites industry faces challenges including the high cost of certain materials, particularly carbon fiber. Supply chain disruptions can impact production and availability. Intense competition and the need for continuous innovation pose ongoing challenges. Stringent environmental regulations necessitate the development of sustainable production processes. The complexities involved in recycling composites present a significant hurdle.
Emerging Opportunities in Composites Industry
Emerging opportunities lie in the development of bio-based composites, smart composites, and 3D-printed composites. The growing adoption of composites in infrastructure projects and the expanding electric vehicle market present significant growth avenues. Focus on improving the recyclability of composites and developing closed-loop systems will create additional opportunities.
Leading Players in the Composites Industry Market
- SGL Carbon
- COMPOSITES UNIVERSAL GROUP
- Solvay
- 3M
- DIT B V
- Owens Corning
- DuPont
- TORAY INDUSTRIES INC
- Mitsubishi Chemical Group Corporation
- Hexcel Corporation
- TEIJIN LIMITED
- Materion Corporation
Key Developments in Composites Industry
- June 2023: Solvay collaborates with Spirit AeroSystems on composite development for sustainable aircraft technologies.
- February 2024: Owens Corning acquires Masonite for USD 3.9 Billion, strengthening its position in building and construction materials and glass reinforcement.
Future Outlook for Composites Industry Market
The composites market is poised for continued growth, driven by technological advancements, increasing demand from various sectors, and the growing focus on sustainability. Strategic partnerships, investments in R&D, and the expansion into new applications will further fuel market expansion. The market is expected to witness a significant rise in the adoption of high-performance composites and innovative manufacturing processes in the coming years.
Composites Industry Segmentation
-
1. Matrix Material
-
1.1. Polymer Matrix Composites (PMC)
- 1.1.1. Thermoset Resins
- 1.1.2. Thermoplastic Resins
- 1.2. Ceramic/Carbon Matrix Composites (CMCs)
- 1.3. Other Matrices (Metal Matrix Composites)
-
1.1. Polymer Matrix Composites (PMC)
-
2. Reinforcement Fiber
- 2.1. Glass Fiber
- 2.2. Carbon Fiber
- 2.3. Aramid Fiber
- 2.4. Other Fibers
-
3. End-use Application
- 3.1. Automotive and Transportation
- 3.2. Wind Energy
- 3.3. Aerospace and Defense
- 3.4. Pipes and Tanks
- 3.5. Construction
- 3.6. Electrical and Electronics
- 3.7. Sports and Recreation
- 3.8. Other End-use Applications
Composites Industry Segmentation By Geography
-
1. Asia Pacific
- 1.1. China
- 1.2. India
- 1.3. Japan
- 1.4. South Korea
- 1.5. Thailand
- 1.6. Malaysia
- 1.7. Indonesia
- 1.8. Vietnam
- 1.9. Rest of Asia Pacific
-
2. North America
- 2.1. United States
- 2.2. Canada
- 2.3. Mexico
-
3. Europe
- 3.1. Germany
- 3.2. United Kingdom
- 3.3. France
- 3.4. Italy
- 3.5. Spain
- 3.6. Russia
- 3.7. NORDIC Countries
- 3.8. Turkey
- 3.9. Rest of Europe
-
4. South America
- 4.1. Brazil
- 4.2. Argentina
- 4.3. Colombia
- 4.4. Rest of South America
-
5. Middle East and Africa
- 5.1. Saudi Arabia
- 5.2. South Africa
- 5.3. Nigeria
- 5.4. Qatar
- 5.5. Egypt
- 5.6. United Arab Emirates
- 5.7. Rest of Middle East and Africa
Composites Industry Regional Market Share
Geographic Coverage of Composites Industry
Composites Industry REPORT HIGHLIGHTS
| Aspects | Details |
|---|---|
| Study Period | 2020-2034 |
| Base Year | 2025 |
| Estimated Year | 2026 |
| Forecast Period | 2026-2034 |
| Historical Period | 2020-2025 |
| Growth Rate | CAGR of > 5.00% from 2020-2034 |
| Segmentation |
|
Table of Contents
- 1. Introduction
- 1.1. Research Scope
- 1.2. Market Segmentation
- 1.3. Research Objective
- 1.4. Definitions and Assumptions
- 2. Executive Summary
- 2.1. Market Snapshot
- 3. Market Dynamics
- 3.1. Market Drivers
- 3.2. Market Restrains
- 3.3. Market Trends
- 3.4. Market Opportunities
- 4. Market Factor Analysis
- 4.1. Porters Five Forces
- 4.1.1. Bargaining Power of Suppliers
- 4.1.2. Bargaining Power of Buyers
- 4.1.3. Threat of New Entrants
- 4.1.4. Threat of Substitutes
- 4.1.5. Competitive Rivalry
- 4.2. PESTEL analysis
- 4.3. BCG Analysis
- 4.3.1. Stars (High Growth, High Market Share)
- 4.3.2. Cash Cows (Low Growth, High Market Share)
- 4.3.3. Question Mark (High Growth, Low Market Share)
- 4.3.4. Dogs (Low Growth, Low Market Share)
- 4.4. Ansoff Matrix Analysis
- 4.5. Supply Chain Analysis
- 4.6. Regulatory Landscape
- 4.7. Current Market Potential and Opportunity Assessment (TAM–SAM–SOM Framework)
- 4.8. PRI Analyst Note
- 4.1. Porters Five Forces
- 5. Market Analysis, Insights and Forecast 2021-2033
- 5.1. Market Analysis, Insights and Forecast - by Matrix Material
- 5.1.1. Polymer Matrix Composites (PMC)
- 5.1.1.1. Thermoset Resins
- 5.1.1.2. Thermoplastic Resins
- 5.1.2. Ceramic/Carbon Matrix Composites (CMCs)
- 5.1.3. Other Matrices (Metal Matrix Composites)
- 5.1.1. Polymer Matrix Composites (PMC)
- 5.2. Market Analysis, Insights and Forecast - by Reinforcement Fiber
- 5.2.1. Glass Fiber
- 5.2.2. Carbon Fiber
- 5.2.3. Aramid Fiber
- 5.2.4. Other Fibers
- 5.3. Market Analysis, Insights and Forecast - by End-use Application
- 5.3.1. Automotive and Transportation
- 5.3.2. Wind Energy
- 5.3.3. Aerospace and Defense
- 5.3.4. Pipes and Tanks
- 5.3.5. Construction
- 5.3.6. Electrical and Electronics
- 5.3.7. Sports and Recreation
- 5.3.8. Other End-use Applications
- 5.4. Market Analysis, Insights and Forecast - by Region
- 5.4.1. Asia Pacific
- 5.4.2. North America
- 5.4.3. Europe
- 5.4.4. South America
- 5.4.5. Middle East and Africa
- 5.1. Market Analysis, Insights and Forecast - by Matrix Material
- 6. Global Composites Industry Analysis, Insights and Forecast, 2021-2033
- 6.1. Market Analysis, Insights and Forecast - by Matrix Material
- 6.1.1. Polymer Matrix Composites (PMC)
- 6.1.1.1. Thermoset Resins
- 6.1.1.2. Thermoplastic Resins
- 6.1.2. Ceramic/Carbon Matrix Composites (CMCs)
- 6.1.3. Other Matrices (Metal Matrix Composites)
- 6.1.1. Polymer Matrix Composites (PMC)
- 6.2. Market Analysis, Insights and Forecast - by Reinforcement Fiber
- 6.2.1. Glass Fiber
- 6.2.2. Carbon Fiber
- 6.2.3. Aramid Fiber
- 6.2.4. Other Fibers
- 6.3. Market Analysis, Insights and Forecast - by End-use Application
- 6.3.1. Automotive and Transportation
- 6.3.2. Wind Energy
- 6.3.3. Aerospace and Defense
- 6.3.4. Pipes and Tanks
- 6.3.5. Construction
- 6.3.6. Electrical and Electronics
- 6.3.7. Sports and Recreation
- 6.3.8. Other End-use Applications
- 6.1. Market Analysis, Insights and Forecast - by Matrix Material
- 7. Asia Pacific Composites Industry Analysis, Insights and Forecast, 2020-2032
- 7.1. Market Analysis, Insights and Forecast - by Matrix Material
- 7.1.1. Polymer Matrix Composites (PMC)
- 7.1.1.1. Thermoset Resins
- 7.1.1.2. Thermoplastic Resins
- 7.1.2. Ceramic/Carbon Matrix Composites (CMCs)
- 7.1.3. Other Matrices (Metal Matrix Composites)
- 7.1.1. Polymer Matrix Composites (PMC)
- 7.2. Market Analysis, Insights and Forecast - by Reinforcement Fiber
- 7.2.1. Glass Fiber
- 7.2.2. Carbon Fiber
- 7.2.3. Aramid Fiber
- 7.2.4. Other Fibers
- 7.3. Market Analysis, Insights and Forecast - by End-use Application
- 7.3.1. Automotive and Transportation
- 7.3.2. Wind Energy
- 7.3.3. Aerospace and Defense
- 7.3.4. Pipes and Tanks
- 7.3.5. Construction
- 7.3.6. Electrical and Electronics
- 7.3.7. Sports and Recreation
- 7.3.8. Other End-use Applications
- 7.1. Market Analysis, Insights and Forecast - by Matrix Material
- 8. North America Composites Industry Analysis, Insights and Forecast, 2020-2032
- 8.1. Market Analysis, Insights and Forecast - by Matrix Material
- 8.1.1. Polymer Matrix Composites (PMC)
- 8.1.1.1. Thermoset Resins
- 8.1.1.2. Thermoplastic Resins
- 8.1.2. Ceramic/Carbon Matrix Composites (CMCs)
- 8.1.3. Other Matrices (Metal Matrix Composites)
- 8.1.1. Polymer Matrix Composites (PMC)
- 8.2. Market Analysis, Insights and Forecast - by Reinforcement Fiber
- 8.2.1. Glass Fiber
- 8.2.2. Carbon Fiber
- 8.2.3. Aramid Fiber
- 8.2.4. Other Fibers
- 8.3. Market Analysis, Insights and Forecast - by End-use Application
- 8.3.1. Automotive and Transportation
- 8.3.2. Wind Energy
- 8.3.3. Aerospace and Defense
- 8.3.4. Pipes and Tanks
- 8.3.5. Construction
- 8.3.6. Electrical and Electronics
- 8.3.7. Sports and Recreation
- 8.3.8. Other End-use Applications
- 8.1. Market Analysis, Insights and Forecast - by Matrix Material
- 9. Europe Composites Industry Analysis, Insights and Forecast, 2020-2032
- 9.1. Market Analysis, Insights and Forecast - by Matrix Material
- 9.1.1. Polymer Matrix Composites (PMC)
- 9.1.1.1. Thermoset Resins
- 9.1.1.2. Thermoplastic Resins
- 9.1.2. Ceramic/Carbon Matrix Composites (CMCs)
- 9.1.3. Other Matrices (Metal Matrix Composites)
- 9.1.1. Polymer Matrix Composites (PMC)
- 9.2. Market Analysis, Insights and Forecast - by Reinforcement Fiber
- 9.2.1. Glass Fiber
- 9.2.2. Carbon Fiber
- 9.2.3. Aramid Fiber
- 9.2.4. Other Fibers
- 9.3. Market Analysis, Insights and Forecast - by End-use Application
- 9.3.1. Automotive and Transportation
- 9.3.2. Wind Energy
- 9.3.3. Aerospace and Defense
- 9.3.4. Pipes and Tanks
- 9.3.5. Construction
- 9.3.6. Electrical and Electronics
- 9.3.7. Sports and Recreation
- 9.3.8. Other End-use Applications
- 9.1. Market Analysis, Insights and Forecast - by Matrix Material
- 10. South America Composites Industry Analysis, Insights and Forecast, 2020-2032
- 10.1. Market Analysis, Insights and Forecast - by Matrix Material
- 10.1.1. Polymer Matrix Composites (PMC)
- 10.1.1.1. Thermoset Resins
- 10.1.1.2. Thermoplastic Resins
- 10.1.2. Ceramic/Carbon Matrix Composites (CMCs)
- 10.1.3. Other Matrices (Metal Matrix Composites)
- 10.1.1. Polymer Matrix Composites (PMC)
- 10.2. Market Analysis, Insights and Forecast - by Reinforcement Fiber
- 10.2.1. Glass Fiber
- 10.2.2. Carbon Fiber
- 10.2.3. Aramid Fiber
- 10.2.4. Other Fibers
- 10.3. Market Analysis, Insights and Forecast - by End-use Application
- 10.3.1. Automotive and Transportation
- 10.3.2. Wind Energy
- 10.3.3. Aerospace and Defense
- 10.3.4. Pipes and Tanks
- 10.3.5. Construction
- 10.3.6. Electrical and Electronics
- 10.3.7. Sports and Recreation
- 10.3.8. Other End-use Applications
- 10.1. Market Analysis, Insights and Forecast - by Matrix Material
- 11. Middle East and Africa Composites Industry Analysis, Insights and Forecast, 2020-2032
- 11.1. Market Analysis, Insights and Forecast - by Matrix Material
- 11.1.1. Polymer Matrix Composites (PMC)
- 11.1.1.1. Thermoset Resins
- 11.1.1.2. Thermoplastic Resins
- 11.1.2. Ceramic/Carbon Matrix Composites (CMCs)
- 11.1.3. Other Matrices (Metal Matrix Composites)
- 11.1.1. Polymer Matrix Composites (PMC)
- 11.2. Market Analysis, Insights and Forecast - by Reinforcement Fiber
- 11.2.1. Glass Fiber
- 11.2.2. Carbon Fiber
- 11.2.3. Aramid Fiber
- 11.2.4. Other Fibers
- 11.3. Market Analysis, Insights and Forecast - by End-use Application
- 11.3.1. Automotive and Transportation
- 11.3.2. Wind Energy
- 11.3.3. Aerospace and Defense
- 11.3.4. Pipes and Tanks
- 11.3.5. Construction
- 11.3.6. Electrical and Electronics
- 11.3.7. Sports and Recreation
- 11.3.8. Other End-use Applications
- 11.1. Market Analysis, Insights and Forecast - by Matrix Material
- 12. Competitive Analysis
- 12.1. Company Profiles
- 12.1.1 SGL Carbon
- 12.1.1.1. Company Overview
- 12.1.1.2. Products
- 12.1.1.3. Company Financials
- 12.1.1.4. SWOT Analysis
- 12.1.2 COMPOSITES UNIVERSAL GROUP
- 12.1.2.1. Company Overview
- 12.1.2.2. Products
- 12.1.2.3. Company Financials
- 12.1.2.4. SWOT Analysis
- 12.1.3 Solvay
- 12.1.3.1. Company Overview
- 12.1.3.2. Products
- 12.1.3.3. Company Financials
- 12.1.3.4. SWOT Analysis
- 12.1.4 3M
- 12.1.4.1. Company Overview
- 12.1.4.2. Products
- 12.1.4.3. Company Financials
- 12.1.4.4. SWOT Analysis
- 12.1.5 DIT B V
- 12.1.5.1. Company Overview
- 12.1.5.2. Products
- 12.1.5.3. Company Financials
- 12.1.5.4. SWOT Analysis
- 12.1.6 Owens Corning
- 12.1.6.1. Company Overview
- 12.1.6.2. Products
- 12.1.6.3. Company Financials
- 12.1.6.4. SWOT Analysis
- 12.1.7 DuPont
- 12.1.7.1. Company Overview
- 12.1.7.2. Products
- 12.1.7.3. Company Financials
- 12.1.7.4. SWOT Analysis
- 12.1.8 TORAY INDUSTRIES INC *List Not Exhaustive
- 12.1.8.1. Company Overview
- 12.1.8.2. Products
- 12.1.8.3. Company Financials
- 12.1.8.4. SWOT Analysis
- 12.1.9 Mitsubishi Chemical Group Corporation
- 12.1.9.1. Company Overview
- 12.1.9.2. Products
- 12.1.9.3. Company Financials
- 12.1.9.4. SWOT Analysis
- 12.1.10 Hexcel Corporation
- 12.1.10.1. Company Overview
- 12.1.10.2. Products
- 12.1.10.3. Company Financials
- 12.1.10.4. SWOT Analysis
- 12.1.11 TEIJIN LIMITED
- 12.1.11.1. Company Overview
- 12.1.11.2. Products
- 12.1.11.3. Company Financials
- 12.1.11.4. SWOT Analysis
- 12.1.12 Materion Corporation
- 12.1.12.1. Company Overview
- 12.1.12.2. Products
- 12.1.12.3. Company Financials
- 12.1.12.4. SWOT Analysis
- 12.1.1 SGL Carbon
- 12.2. Market Entropy
- 12.2.1 Company's Key Areas Served
- 12.2.2 Recent Developments
- 12.3. Company Market Share Analysis 2025
- 12.3.1 Top 5 Companies Market Share Analysis
- 12.3.2 Top 3 Companies Market Share Analysis
- 12.4. List of Potential Customers
- 13. Research Methodology
List of Figures
- Figure 1: Global Composites Industry Revenue Breakdown (Million, %) by Region 2025 & 2033
- Figure 2: Asia Pacific Composites Industry Revenue (Million), by Matrix Material 2025 & 2033
- Figure 3: Asia Pacific Composites Industry Revenue Share (%), by Matrix Material 2025 & 2033
- Figure 4: Asia Pacific Composites Industry Revenue (Million), by Reinforcement Fiber 2025 & 2033
- Figure 5: Asia Pacific Composites Industry Revenue Share (%), by Reinforcement Fiber 2025 & 2033
- Figure 6: Asia Pacific Composites Industry Revenue (Million), by End-use Application 2025 & 2033
- Figure 7: Asia Pacific Composites Industry Revenue Share (%), by End-use Application 2025 & 2033
- Figure 8: Asia Pacific Composites Industry Revenue (Million), by Country 2025 & 2033
- Figure 9: Asia Pacific Composites Industry Revenue Share (%), by Country 2025 & 2033
- Figure 10: North America Composites Industry Revenue (Million), by Matrix Material 2025 & 2033
- Figure 11: North America Composites Industry Revenue Share (%), by Matrix Material 2025 & 2033
- Figure 12: North America Composites Industry Revenue (Million), by Reinforcement Fiber 2025 & 2033
- Figure 13: North America Composites Industry Revenue Share (%), by Reinforcement Fiber 2025 & 2033
- Figure 14: North America Composites Industry Revenue (Million), by End-use Application 2025 & 2033
- Figure 15: North America Composites Industry Revenue Share (%), by End-use Application 2025 & 2033
- Figure 16: North America Composites Industry Revenue (Million), by Country 2025 & 2033
- Figure 17: North America Composites Industry Revenue Share (%), by Country 2025 & 2033
- Figure 18: Europe Composites Industry Revenue (Million), by Matrix Material 2025 & 2033
- Figure 19: Europe Composites Industry Revenue Share (%), by Matrix Material 2025 & 2033
- Figure 20: Europe Composites Industry Revenue (Million), by Reinforcement Fiber 2025 & 2033
- Figure 21: Europe Composites Industry Revenue Share (%), by Reinforcement Fiber 2025 & 2033
- Figure 22: Europe Composites Industry Revenue (Million), by End-use Application 2025 & 2033
- Figure 23: Europe Composites Industry Revenue Share (%), by End-use Application 2025 & 2033
- Figure 24: Europe Composites Industry Revenue (Million), by Country 2025 & 2033
- Figure 25: Europe Composites Industry Revenue Share (%), by Country 2025 & 2033
- Figure 26: South America Composites Industry Revenue (Million), by Matrix Material 2025 & 2033
- Figure 27: South America Composites Industry Revenue Share (%), by Matrix Material 2025 & 2033
- Figure 28: South America Composites Industry Revenue (Million), by Reinforcement Fiber 2025 & 2033
- Figure 29: South America Composites Industry Revenue Share (%), by Reinforcement Fiber 2025 & 2033
- Figure 30: South America Composites Industry Revenue (Million), by End-use Application 2025 & 2033
- Figure 31: South America Composites Industry Revenue Share (%), by End-use Application 2025 & 2033
- Figure 32: South America Composites Industry Revenue (Million), by Country 2025 & 2033
- Figure 33: South America Composites Industry Revenue Share (%), by Country 2025 & 2033
- Figure 34: Middle East and Africa Composites Industry Revenue (Million), by Matrix Material 2025 & 2033
- Figure 35: Middle East and Africa Composites Industry Revenue Share (%), by Matrix Material 2025 & 2033
- Figure 36: Middle East and Africa Composites Industry Revenue (Million), by Reinforcement Fiber 2025 & 2033
- Figure 37: Middle East and Africa Composites Industry Revenue Share (%), by Reinforcement Fiber 2025 & 2033
- Figure 38: Middle East and Africa Composites Industry Revenue (Million), by End-use Application 2025 & 2033
- Figure 39: Middle East and Africa Composites Industry Revenue Share (%), by End-use Application 2025 & 2033
- Figure 40: Middle East and Africa Composites Industry Revenue (Million), by Country 2025 & 2033
- Figure 41: Middle East and Africa Composites Industry Revenue Share (%), by Country 2025 & 2033
List of Tables
- Table 1: Global Composites Industry Revenue Million Forecast, by Matrix Material 2020 & 2033
- Table 2: Global Composites Industry Revenue Million Forecast, by Reinforcement Fiber 2020 & 2033
- Table 3: Global Composites Industry Revenue Million Forecast, by End-use Application 2020 & 2033
- Table 4: Global Composites Industry Revenue Million Forecast, by Region 2020 & 2033
- Table 5: Global Composites Industry Revenue Million Forecast, by Matrix Material 2020 & 2033
- Table 6: Global Composites Industry Revenue Million Forecast, by Reinforcement Fiber 2020 & 2033
- Table 7: Global Composites Industry Revenue Million Forecast, by End-use Application 2020 & 2033
- Table 8: Global Composites Industry Revenue Million Forecast, by Country 2020 & 2033
- Table 9: China Composites Industry Revenue (Million) Forecast, by Application 2020 & 2033
- Table 10: India Composites Industry Revenue (Million) Forecast, by Application 2020 & 2033
- Table 11: Japan Composites Industry Revenue (Million) Forecast, by Application 2020 & 2033
- Table 12: South Korea Composites Industry Revenue (Million) Forecast, by Application 2020 & 2033
- Table 13: Thailand Composites Industry Revenue (Million) Forecast, by Application 2020 & 2033
- Table 14: Malaysia Composites Industry Revenue (Million) Forecast, by Application 2020 & 2033
- Table 15: Indonesia Composites Industry Revenue (Million) Forecast, by Application 2020 & 2033
- Table 16: Vietnam Composites Industry Revenue (Million) Forecast, by Application 2020 & 2033
- Table 17: Rest of Asia Pacific Composites Industry Revenue (Million) Forecast, by Application 2020 & 2033
- Table 18: Global Composites Industry Revenue Million Forecast, by Matrix Material 2020 & 2033
- Table 19: Global Composites Industry Revenue Million Forecast, by Reinforcement Fiber 2020 & 2033
- Table 20: Global Composites Industry Revenue Million Forecast, by End-use Application 2020 & 2033
- Table 21: Global Composites Industry Revenue Million Forecast, by Country 2020 & 2033
- Table 22: United States Composites Industry Revenue (Million) Forecast, by Application 2020 & 2033
- Table 23: Canada Composites Industry Revenue (Million) Forecast, by Application 2020 & 2033
- Table 24: Mexico Composites Industry Revenue (Million) Forecast, by Application 2020 & 2033
- Table 25: Global Composites Industry Revenue Million Forecast, by Matrix Material 2020 & 2033
- Table 26: Global Composites Industry Revenue Million Forecast, by Reinforcement Fiber 2020 & 2033
- Table 27: Global Composites Industry Revenue Million Forecast, by End-use Application 2020 & 2033
- Table 28: Global Composites Industry Revenue Million Forecast, by Country 2020 & 2033
- Table 29: Germany Composites Industry Revenue (Million) Forecast, by Application 2020 & 2033
- Table 30: United Kingdom Composites Industry Revenue (Million) Forecast, by Application 2020 & 2033
- Table 31: France Composites Industry Revenue (Million) Forecast, by Application 2020 & 2033
- Table 32: Italy Composites Industry Revenue (Million) Forecast, by Application 2020 & 2033
- Table 33: Spain Composites Industry Revenue (Million) Forecast, by Application 2020 & 2033
- Table 34: Russia Composites Industry Revenue (Million) Forecast, by Application 2020 & 2033
- Table 35: NORDIC Countries Composites Industry Revenue (Million) Forecast, by Application 2020 & 2033
- Table 36: Turkey Composites Industry Revenue (Million) Forecast, by Application 2020 & 2033
- Table 37: Rest of Europe Composites Industry Revenue (Million) Forecast, by Application 2020 & 2033
- Table 38: Global Composites Industry Revenue Million Forecast, by Matrix Material 2020 & 2033
- Table 39: Global Composites Industry Revenue Million Forecast, by Reinforcement Fiber 2020 & 2033
- Table 40: Global Composites Industry Revenue Million Forecast, by End-use Application 2020 & 2033
- Table 41: Global Composites Industry Revenue Million Forecast, by Country 2020 & 2033
- Table 42: Brazil Composites Industry Revenue (Million) Forecast, by Application 2020 & 2033
- Table 43: Argentina Composites Industry Revenue (Million) Forecast, by Application 2020 & 2033
- Table 44: Colombia Composites Industry Revenue (Million) Forecast, by Application 2020 & 2033
- Table 45: Rest of South America Composites Industry Revenue (Million) Forecast, by Application 2020 & 2033
- Table 46: Global Composites Industry Revenue Million Forecast, by Matrix Material 2020 & 2033
- Table 47: Global Composites Industry Revenue Million Forecast, by Reinforcement Fiber 2020 & 2033
- Table 48: Global Composites Industry Revenue Million Forecast, by End-use Application 2020 & 2033
- Table 49: Global Composites Industry Revenue Million Forecast, by Country 2020 & 2033
- Table 50: Saudi Arabia Composites Industry Revenue (Million) Forecast, by Application 2020 & 2033
- Table 51: South Africa Composites Industry Revenue (Million) Forecast, by Application 2020 & 2033
- Table 52: Nigeria Composites Industry Revenue (Million) Forecast, by Application 2020 & 2033
- Table 53: Qatar Composites Industry Revenue (Million) Forecast, by Application 2020 & 2033
- Table 54: Egypt Composites Industry Revenue (Million) Forecast, by Application 2020 & 2033
- Table 55: United Arab Emirates Composites Industry Revenue (Million) Forecast, by Application 2020 & 2033
- Table 56: Rest of Middle East and Africa Composites Industry Revenue (Million) Forecast, by Application 2020 & 2033
Frequently Asked Questions
1. What is the projected Compound Annual Growth Rate (CAGR) of the Composites Industry?
The projected CAGR is approximately > 5.00%.
2. Which companies are prominent players in the Composites Industry?
Key companies in the market include SGL Carbon, COMPOSITES UNIVERSAL GROUP, Solvay, 3M, DIT B V, Owens Corning, DuPont, TORAY INDUSTRIES INC *List Not Exhaustive, Mitsubishi Chemical Group Corporation, Hexcel Corporation, TEIJIN LIMITED, Materion Corporation.
3. What are the main segments of the Composites Industry?
The market segments include Matrix Material, Reinforcement Fiber, End-use Application.
4. Can you provide details about the market size?
The market size is estimated to be USD 45.96 Million as of 2022.
5. What are some drivers contributing to market growth?
Technological Advancement in the Field of Material Science; Increasing Use of Composites in the Aerospace and Defense Industry; Other Drivers.
6. What are the notable trends driving market growth?
Rising Demand from Transportation sector.
7. Are there any restraints impacting market growth?
High Cost of Composite Materials.
8. Can you provide examples of recent developments in the market?
February 2024 - Owens Corning acquired USD 3.9 billion of Masonite. This acquisition would strengthen the company's position in building and construction materials and the glass reinforcement business within its Composites segment.
9. What pricing options are available for accessing the report?
Pricing options include single-user, multi-user, and enterprise licenses priced at USD 4750, USD 5250, and USD 8750 respectively.
10. Is the market size provided in terms of value or volume?
The market size is provided in terms of value, measured in Million.
11. Are there any specific market keywords associated with the report?
Yes, the market keyword associated with the report is "Composites Industry," which aids in identifying and referencing the specific market segment covered.
12. How do I determine which pricing option suits my needs best?
The pricing options vary based on user requirements and access needs. Individual users may opt for single-user licenses, while businesses requiring broader access may choose multi-user or enterprise licenses for cost-effective access to the report.
13. Are there any additional resources or data provided in the Composites Industry report?
While the report offers comprehensive insights, it's advisable to review the specific contents or supplementary materials provided to ascertain if additional resources or data are available.
14. How can I stay updated on further developments or reports in the Composites Industry?
To stay informed about further developments, trends, and reports in the Composites Industry, consider subscribing to industry newsletters, following relevant companies and organizations, or regularly checking reputable industry news sources and publications.
Methodology
Step 1 - Identification of Relevant Samples Size from Population Database


Step 2 - Approaches for Defining Global Market Size (Value, Volume* & Price*)

Note*: In applicable scenarios
Step 3 - Data Sources
Primary Research
- Web Analytics
- Survey Reports
- Research Institute
- Latest Research Reports
- Opinion Leaders
Secondary Research
- Annual Reports
- White Paper
- Latest Press Release
- Industry Association
- Paid Database
- Investor Presentations

Step 4 - Data Triangulation
Involves using different sources of information in order to increase the validity of a study
These sources are likely to be stakeholders in a program - participants, other researchers, program staff, other community members, and so on.
Then we put all data in single framework & apply various statistical tools to find out the dynamic on the market.
During the analysis stage, feedback from the stakeholder groups would be compared to determine areas of agreement as well as areas of divergence

