

Key Insights
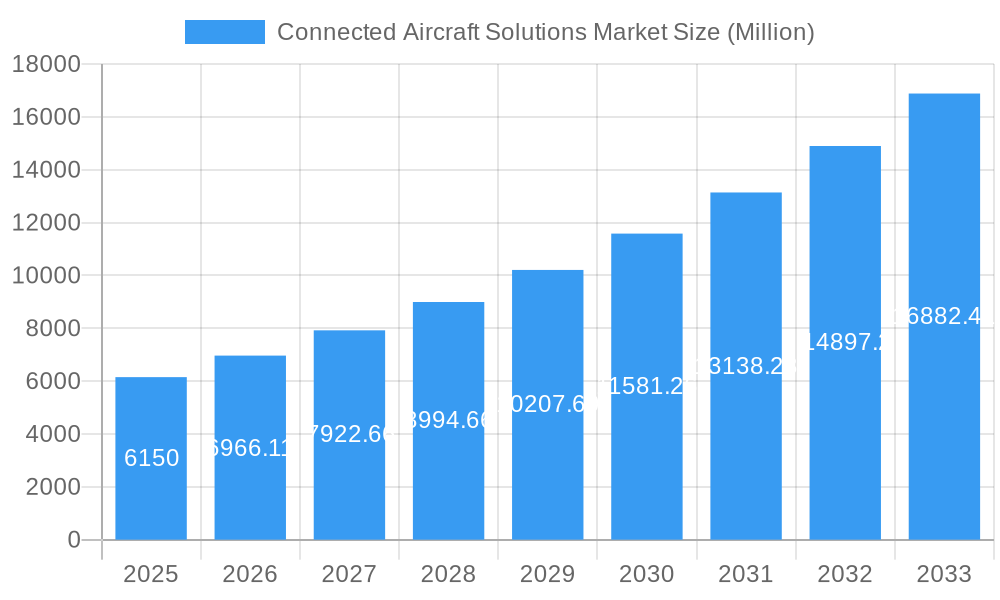
The Connected Aircraft Solutions market is experiencing robust growth, projected to reach \$6.15 billion in 2025 and exhibiting a Compound Annual Growth Rate (CAGR) of 13.24% from 2025 to 2033. This expansion is fueled by several key drivers. The increasing demand for enhanced passenger experience through seamless inflight connectivity, driven by the rise of streaming services and the need for consistent communication, is a major catalyst. Furthermore, the growing adoption of Internet of Things (IoT) technologies within aircraft for improved maintenance and operational efficiency is significantly contributing to market growth. Advancements in satellite communication technologies, including higher bandwidth capabilities and wider coverage areas, particularly in Ka-band and Ku-band frequencies, are also pivotal. The commercial aircraft segment currently dominates the market, but the military aviation sector is showing promising growth potential, driven by the need for secure and reliable communication systems in military operations. Regulatory developments encouraging the adoption of advanced communication technologies are further bolstering market expansion.
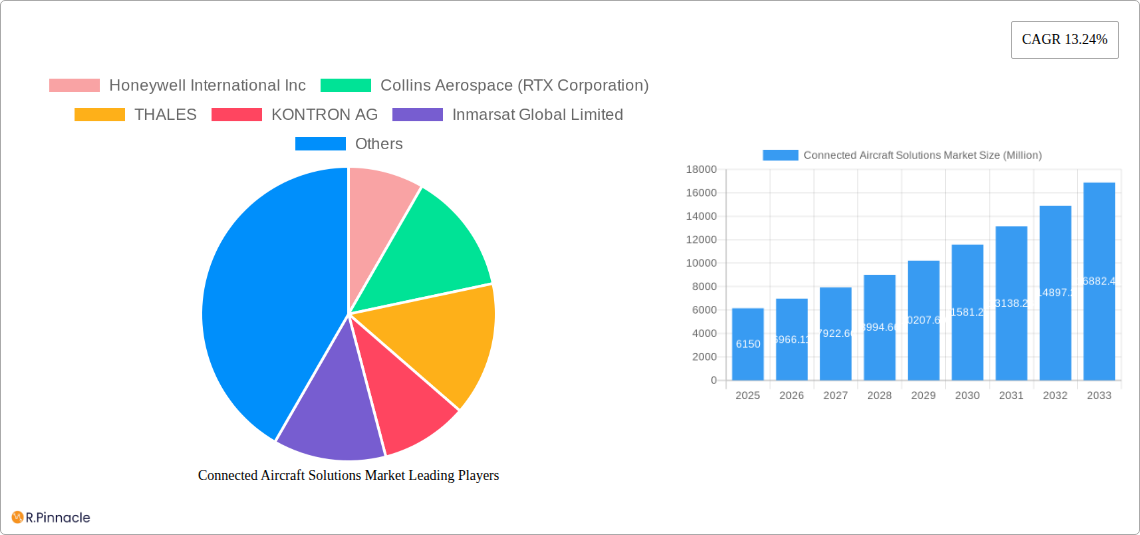
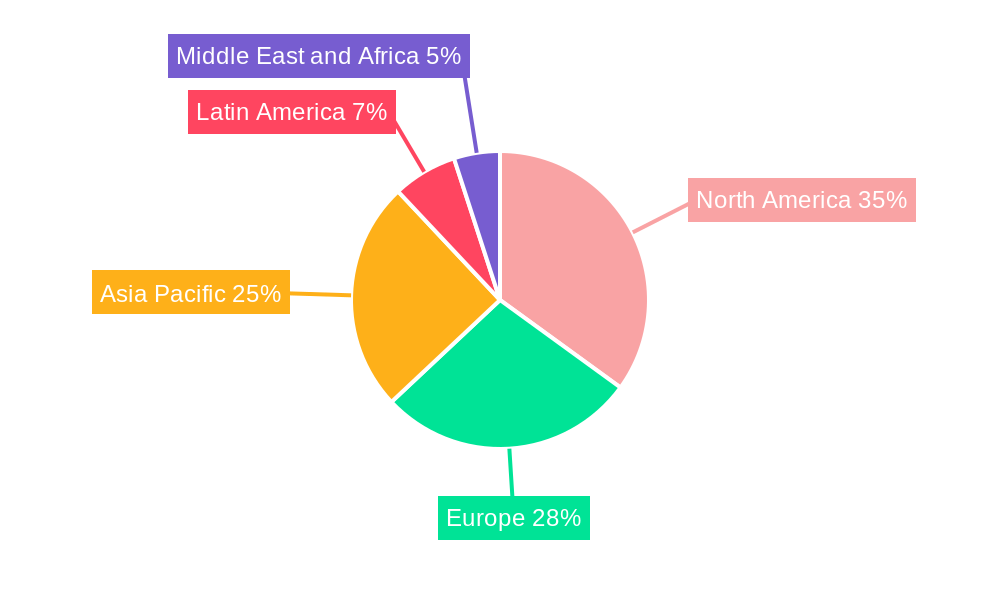
Connected Aircraft Solutions Market Market Size (In Billion)
However, challenges remain. High implementation costs associated with installing and maintaining connected aircraft systems can hinder adoption, particularly for smaller airlines and operators. Concerns regarding cybersecurity vulnerabilities and the need for robust data protection measures also represent significant restraints. The market's future success depends heavily on technological innovation leading to more cost-effective and secure solutions, alongside continued advancements in satellite network infrastructure and supportive regulatory frameworks. Geographic distribution reveals North America and Europe as leading markets, owing to early adoption and well-established infrastructure, while the Asia-Pacific region showcases substantial growth potential driven by increasing air travel demand and government initiatives. The competitive landscape is marked by established players like Honeywell, Collins Aerospace, Thales, and Viasat, alongside innovative startups developing cutting-edge technologies. This dynamic combination of growth drivers and challenges necessitates strategic planning and technological innovation for stakeholders to fully capitalize on this expanding market opportunity.
Connected Aircraft Solutions Market Company Market Share
Connected Aircraft Solutions Market: A Comprehensive Report (2019-2033)
This in-depth report provides a comprehensive analysis of the Connected Aircraft Solutions Market, offering invaluable insights for industry professionals, investors, and strategic decision-makers. The study period spans from 2019 to 2033, with a focus on the 2025-2033 forecast period. The report leverages rigorous data analysis and expert insights to deliver actionable intelligence on market size, growth drivers, competitive landscape, and future trends. The market is expected to reach xx Million by 2033.
Connected Aircraft Solutions Market Market Structure & Innovation Trends
The Connected Aircraft Solutions market exhibits a moderately concentrated structure, with key players such as Honeywell International Inc, Collins Aerospace (RTX Corporation), Thales, and Inmarsat Global Limited holding significant market share. Market share distribution fluctuates based on technological advancements and strategic partnerships. The estimated market share for Honeywell International Inc in 2025 is xx%, while Collins Aerospace holds approximately xx%. Mergers and acquisitions (M&A) have played a crucial role in shaping the market landscape. For instance, the xx Million acquisition of X company by Y company in 2023 significantly altered the competitive dynamics. Innovation is driven by the need for enhanced connectivity, improved safety features, and reduced operational costs. Stringent regulatory frameworks, particularly concerning data security and airworthiness, influence product development. The market also faces pressure from substitute technologies, such as satellite-based communication systems, which are constantly improving. The end-user demographics comprise commercial and military aircraft operators, with commercial aviation currently dominating the market.
- Market Concentration: Moderately concentrated.
- Innovation Drivers: Enhanced connectivity, safety improvements, cost reduction.
- Regulatory Frameworks: Stringent data security and airworthiness standards.
- Product Substitutes: Satellite-based communication systems.
- End-User Demographics: Commercial and military aircraft operators.
- M&A Activity: Significant impact on market structure, with deal values exceeding xx Million in recent years.
Connected Aircraft Solutions Market Market Dynamics & Trends
The Connected Aircraft Solutions market is experiencing robust growth, driven by the increasing demand for inflight connectivity, the proliferation of Internet of Things (IoT) devices in aircraft, and the rising adoption of advanced air traffic management systems. The market is projected to exhibit a Compound Annual Growth Rate (CAGR) of xx% during the forecast period (2025-2033). This growth is fueled by several factors, including technological advancements in broadband satellite communication, increasing passenger expectations for seamless connectivity during flights, and government initiatives to improve air traffic management efficiency. The market penetration rate for inflight Wi-Fi in commercial aircraft is currently estimated at xx%, with significant growth potential in the coming years. However, the market dynamics are also shaped by several challenges, including the high cost of implementation and integration, cybersecurity concerns, and the need to address the complexities of regulatory compliance in various jurisdictions.
Dominant Regions & Segments in Connected Aircraft Solutions Market
The North American region currently holds the dominant position in the Connected Aircraft Solutions market, driven by a large commercial aviation sector and a robust technological infrastructure. However, the Asia-Pacific region is expected to exhibit the fastest growth rate during the forecast period, fueled by rapid growth in air travel and investment in aviation infrastructure.
- Leading Region: North America.
- Fastest-Growing Region: Asia-Pacific.
Dominant Segments:
- Connectivity: Inflight connectivity is the largest segment, followed by air-to-ground connectivity. Air-to-air connectivity is still nascent.
- Application: Commercial aircraft dominate the market, due to higher demand for inflight connectivity and greater purchasing power.
- Frequency Band: Ku-Band and Ka-Band currently hold the largest market share, owing to their high bandwidth capacity.
Key Drivers:
- North America: Strong commercial aviation sector, technological innovation, supportive regulatory framework.
- Asia-Pacific: Rapid growth in air travel, increased investments in aviation infrastructure, government support.
Connected Aircraft Solutions Market Product Innovations
Recent product innovations focus on enhancing bandwidth, improving latency, and providing seamless connectivity across different frequency bands and geographies. New technologies such as 5G and LEO satellite constellations are being integrated to deliver higher speeds and wider coverage. The focus is on delivering a superior passenger experience and optimizing operational efficiency for airlines. Competitive advantages are achieved through superior technology, broader coverage, lower latency, and integrated solutions.
Report Scope & Segmentation Analysis
This report provides a detailed segmentation analysis of the Connected Aircraft Solutions market across various parameters:
Connectivity: Inflight Connectivity (market size xx Million in 2025, projected growth xx%), Air-to-air Connectivity (market size xx Million in 2025, projected growth xx%), Air-to-ground Connectivity (market size xx Million in 2025, projected growth xx%).
Application: Commercial Aircraft (market size xx Million in 2025, projected growth xx%), Military Aircraft (market size xx Million in 2025, projected growth xx%).
Frequency Band: Ka-Band (market size xx Million in 2025, projected growth xx%), Ku-Band (market size xx Million in 2025, projected growth xx%), L-Band (market size xx Million in 2025, projected growth xx%).
Key Drivers of Connected Aircraft Solutions Market Growth
Several key factors propel the growth of the Connected Aircraft Solutions market: The rising demand for enhanced passenger experience through inflight connectivity, advancements in satellite technology offering higher bandwidth and lower latency, increasing adoption of IoT devices in aircraft for data collection and operational efficiency, and supportive government regulations promoting air traffic management modernization.
Challenges in the Connected Aircraft Solutions Market Sector
The Connected Aircraft Solutions market faces several challenges, including the high cost of implementation and integration, concerns about cybersecurity vulnerabilities, the complexities of regulatory compliance across various jurisdictions, and the need to maintain reliable connectivity across diverse geographical regions and weather conditions. These challenges can impact market growth by delaying adoption and increasing operational costs.
Emerging Opportunities in Connected Aircraft Solutions Market
The Connected Aircraft Solutions market presents numerous opportunities, including the expansion into emerging markets, the development of innovative solutions using 5G and LEO satellite constellations, integration with advanced air traffic management systems, and the provision of data-driven insights to improve operational efficiency and reduce costs.
Leading Players in the Connected Aircraft Solutions Market Market
- Honeywell International Inc
- Collins Aerospace (RTX Corporation)
- THALES
- KONTRON AG
- Inmarsat Global Limited
- Viasat Inc
- Cobham Limited
- Gogo Inc
- Anuvu Operations LLC
- SITA
- Burran
- Panasonic Holdings Corporation
Key Developments in Connected Aircraft Solutions Market Industry
- May 2023: Inmarsat launched new Jet ConneX (JX) service plans, redefining business aviation connectivity and passenger experience.
- February 2022: Aegean Airlines implemented high-speed inflight broadband powered by the European Aviation Network (EAN), provided by Inmarsat and Deutsche Telekom.
Future Outlook for Connected Aircraft Solutions Market Market
The Connected Aircraft Solutions market is poised for significant growth, driven by technological advancements, increasing demand for enhanced connectivity, and the expansion into new markets. Strategic partnerships, investments in R&D, and the development of innovative solutions will further shape market dynamics and create exciting opportunities for players in the industry.
Connected Aircraft Solutions Market Segmentation
- 1. Production Analysis
- 2. Consumption Analysis
- 3. Import Market Analysis (Value & Volume)
- 4. Export Market Analysis (Value & Volume)
- 5. Price Trend Analysis
Connected Aircraft Solutions Market Segmentation By Geography
-
1. North America
- 1.1. United States
- 1.2. Canada
- 1.3. Mexico
-
2. South America
- 2.1. Brazil
- 2.2. Argentina
- 2.3. Rest of South America
-
3. Europe
- 3.1. United Kingdom
- 3.2. Germany
- 3.3. France
- 3.4. Italy
- 3.5. Spain
- 3.6. Russia
- 3.7. Benelux
- 3.8. Nordics
- 3.9. Rest of Europe
-
4. Middle East & Africa
- 4.1. Turkey
- 4.2. Israel
- 4.3. GCC
- 4.4. North Africa
- 4.5. South Africa
- 4.6. Rest of Middle East & Africa
-
5. Asia Pacific
- 5.1. China
- 5.2. India
- 5.3. Japan
- 5.4. South Korea
- 5.5. ASEAN
- 5.6. Oceania
- 5.7. Rest of Asia Pacific
Connected Aircraft Solutions Market Regional Market Share
Geographic Coverage of Connected Aircraft Solutions Market
Connected Aircraft Solutions Market REPORT HIGHLIGHTS
| Aspects | Details |
|---|---|
| Study Period | 2020-2034 |
| Base Year | 2025 |
| Estimated Year | 2026 |
| Forecast Period | 2026-2034 |
| Historical Period | 2020-2025 |
| Growth Rate | CAGR of 12.6% from 2020-2034 |
| Segmentation |
|
Table of Contents
- 1. Introduction
- 1.1. Research Scope
- 1.2. Market Segmentation
- 1.3. Research Objective
- 1.4. Definitions and Assumptions
- 2. Executive Summary
- 2.1. Market Snapshot
- 3. Market Dynamics
- 3.1. Market Drivers
- 3.2. Market Restrains
- 3.3. Market Trends
- 3.4. Market Opportunities
- 4. Market Factor Analysis
- 4.1. Porters Five Forces
- 4.1.1. Bargaining Power of Suppliers
- 4.1.2. Bargaining Power of Buyers
- 4.1.3. Threat of New Entrants
- 4.1.4. Threat of Substitutes
- 4.1.5. Competitive Rivalry
- 4.2. PESTEL analysis
- 4.3. BCG Analysis
- 4.3.1. Stars (High Growth, High Market Share)
- 4.3.2. Cash Cows (Low Growth, High Market Share)
- 4.3.3. Question Mark (High Growth, Low Market Share)
- 4.3.4. Dogs (Low Growth, Low Market Share)
- 4.4. Ansoff Matrix Analysis
- 4.5. Supply Chain Analysis
- 4.6. Regulatory Landscape
- 4.7. Current Market Potential and Opportunity Assessment (TAM–SAM–SOM Framework)
- 4.8. PRI Analyst Note
- 4.1. Porters Five Forces
- 5. Market Analysis, Insights and Forecast 2021-2033
- 5.1. Market Analysis, Insights and Forecast - by Production Analysis
- 5.2. Market Analysis, Insights and Forecast - by Consumption Analysis
- 5.3. Market Analysis, Insights and Forecast - by Import Market Analysis (Value & Volume)
- 5.4. Market Analysis, Insights and Forecast - by Export Market Analysis (Value & Volume)
- 5.5. Market Analysis, Insights and Forecast - by Price Trend Analysis
- 5.6. Market Analysis, Insights and Forecast - by Region
- 5.6.1. North America
- 5.6.2. South America
- 5.6.3. Europe
- 5.6.4. Middle East & Africa
- 5.6.5. Asia Pacific
- 6. Global Connected Aircraft Solutions Market Analysis, Insights and Forecast, 2021-2033
- 6.1. Market Analysis, Insights and Forecast - by Production Analysis
- 6.2. Market Analysis, Insights and Forecast - by Consumption Analysis
- 6.3. Market Analysis, Insights and Forecast - by Import Market Analysis (Value & Volume)
- 6.4. Market Analysis, Insights and Forecast - by Export Market Analysis (Value & Volume)
- 6.5. Market Analysis, Insights and Forecast - by Price Trend Analysis
- 7. North America Connected Aircraft Solutions Market Analysis, Insights and Forecast, 2020-2032
- 7.1. Market Analysis, Insights and Forecast - by Production Analysis
- 7.2. Market Analysis, Insights and Forecast - by Consumption Analysis
- 7.3. Market Analysis, Insights and Forecast - by Import Market Analysis (Value & Volume)
- 7.4. Market Analysis, Insights and Forecast - by Export Market Analysis (Value & Volume)
- 7.5. Market Analysis, Insights and Forecast - by Price Trend Analysis
- 8. South America Connected Aircraft Solutions Market Analysis, Insights and Forecast, 2020-2032
- 8.1. Market Analysis, Insights and Forecast - by Production Analysis
- 8.2. Market Analysis, Insights and Forecast - by Consumption Analysis
- 8.3. Market Analysis, Insights and Forecast - by Import Market Analysis (Value & Volume)
- 8.4. Market Analysis, Insights and Forecast - by Export Market Analysis (Value & Volume)
- 8.5. Market Analysis, Insights and Forecast - by Price Trend Analysis
- 9. Europe Connected Aircraft Solutions Market Analysis, Insights and Forecast, 2020-2032
- 9.1. Market Analysis, Insights and Forecast - by Production Analysis
- 9.2. Market Analysis, Insights and Forecast - by Consumption Analysis
- 9.3. Market Analysis, Insights and Forecast - by Import Market Analysis (Value & Volume)
- 9.4. Market Analysis, Insights and Forecast - by Export Market Analysis (Value & Volume)
- 9.5. Market Analysis, Insights and Forecast - by Price Trend Analysis
- 10. Middle East & Africa Connected Aircraft Solutions Market Analysis, Insights and Forecast, 2020-2032
- 10.1. Market Analysis, Insights and Forecast - by Production Analysis
- 10.2. Market Analysis, Insights and Forecast - by Consumption Analysis
- 10.3. Market Analysis, Insights and Forecast - by Import Market Analysis (Value & Volume)
- 10.4. Market Analysis, Insights and Forecast - by Export Market Analysis (Value & Volume)
- 10.5. Market Analysis, Insights and Forecast - by Price Trend Analysis
- 11. Asia Pacific Connected Aircraft Solutions Market Analysis, Insights and Forecast, 2020-2032
- 11.1. Market Analysis, Insights and Forecast - by Production Analysis
- 11.2. Market Analysis, Insights and Forecast - by Consumption Analysis
- 11.3. Market Analysis, Insights and Forecast - by Import Market Analysis (Value & Volume)
- 11.4. Market Analysis, Insights and Forecast - by Export Market Analysis (Value & Volume)
- 11.5. Market Analysis, Insights and Forecast - by Price Trend Analysis
- 12. Competitive Analysis
- 12.1. Company Profiles
- 12.1.1 Honeywell International Inc
- 12.1.1.1. Company Overview
- 12.1.1.2. Products
- 12.1.1.3. Company Financials
- 12.1.1.4. SWOT Analysis
- 12.1.2 Collins Aerospace (RTX Corporation)
- 12.1.2.1. Company Overview
- 12.1.2.2. Products
- 12.1.2.3. Company Financials
- 12.1.2.4. SWOT Analysis
- 12.1.3 THALES
- 12.1.3.1. Company Overview
- 12.1.3.2. Products
- 12.1.3.3. Company Financials
- 12.1.3.4. SWOT Analysis
- 12.1.4 KONTRON AG
- 12.1.4.1. Company Overview
- 12.1.4.2. Products
- 12.1.4.3. Company Financials
- 12.1.4.4. SWOT Analysis
- 12.1.5 Inmarsat Global Limited
- 12.1.5.1. Company Overview
- 12.1.5.2. Products
- 12.1.5.3. Company Financials
- 12.1.5.4. SWOT Analysis
- 12.1.6 Viasat Inc
- 12.1.6.1. Company Overview
- 12.1.6.2. Products
- 12.1.6.3. Company Financials
- 12.1.6.4. SWOT Analysis
- 12.1.7 Cobham Limited
- 12.1.7.1. Company Overview
- 12.1.7.2. Products
- 12.1.7.3. Company Financials
- 12.1.7.4. SWOT Analysis
- 12.1.8 Gogo Inc
- 12.1.8.1. Company Overview
- 12.1.8.2. Products
- 12.1.8.3. Company Financials
- 12.1.8.4. SWOT Analysis
- 12.1.9 Anuvu Operations LLC
- 12.1.9.1. Company Overview
- 12.1.9.2. Products
- 12.1.9.3. Company Financials
- 12.1.9.4. SWOT Analysis
- 12.1.10 SITA
- 12.1.10.1. Company Overview
- 12.1.10.2. Products
- 12.1.10.3. Company Financials
- 12.1.10.4. SWOT Analysis
- 12.1.11 Burran
- 12.1.11.1. Company Overview
- 12.1.11.2. Products
- 12.1.11.3. Company Financials
- 12.1.11.4. SWOT Analysis
- 12.1.12 Panasonic Holdings Corporation
- 12.1.12.1. Company Overview
- 12.1.12.2. Products
- 12.1.12.3. Company Financials
- 12.1.12.4. SWOT Analysis
- 12.1.1 Honeywell International Inc
- 12.2. Market Entropy
- 12.2.1 Company's Key Areas Served
- 12.2.2 Recent Developments
- 12.3. Company Market Share Analysis 2025
- 12.3.1 Top 5 Companies Market Share Analysis
- 12.3.2 Top 3 Companies Market Share Analysis
- 12.4. List of Potential Customers
- 13. Research Methodology
List of Figures
- Figure 1: Global Connected Aircraft Solutions Market Revenue Breakdown (billion, %) by Region 2025 & 2033
- Figure 2: North America Connected Aircraft Solutions Market Revenue (billion), by Production Analysis 2025 & 2033
- Figure 3: North America Connected Aircraft Solutions Market Revenue Share (%), by Production Analysis 2025 & 2033
- Figure 4: North America Connected Aircraft Solutions Market Revenue (billion), by Consumption Analysis 2025 & 2033
- Figure 5: North America Connected Aircraft Solutions Market Revenue Share (%), by Consumption Analysis 2025 & 2033
- Figure 6: North America Connected Aircraft Solutions Market Revenue (billion), by Import Market Analysis (Value & Volume) 2025 & 2033
- Figure 7: North America Connected Aircraft Solutions Market Revenue Share (%), by Import Market Analysis (Value & Volume) 2025 & 2033
- Figure 8: North America Connected Aircraft Solutions Market Revenue (billion), by Export Market Analysis (Value & Volume) 2025 & 2033
- Figure 9: North America Connected Aircraft Solutions Market Revenue Share (%), by Export Market Analysis (Value & Volume) 2025 & 2033
- Figure 10: North America Connected Aircraft Solutions Market Revenue (billion), by Price Trend Analysis 2025 & 2033
- Figure 11: North America Connected Aircraft Solutions Market Revenue Share (%), by Price Trend Analysis 2025 & 2033
- Figure 12: North America Connected Aircraft Solutions Market Revenue (billion), by Country 2025 & 2033
- Figure 13: North America Connected Aircraft Solutions Market Revenue Share (%), by Country 2025 & 2033
- Figure 14: South America Connected Aircraft Solutions Market Revenue (billion), by Production Analysis 2025 & 2033
- Figure 15: South America Connected Aircraft Solutions Market Revenue Share (%), by Production Analysis 2025 & 2033
- Figure 16: South America Connected Aircraft Solutions Market Revenue (billion), by Consumption Analysis 2025 & 2033
- Figure 17: South America Connected Aircraft Solutions Market Revenue Share (%), by Consumption Analysis 2025 & 2033
- Figure 18: South America Connected Aircraft Solutions Market Revenue (billion), by Import Market Analysis (Value & Volume) 2025 & 2033
- Figure 19: South America Connected Aircraft Solutions Market Revenue Share (%), by Import Market Analysis (Value & Volume) 2025 & 2033
- Figure 20: South America Connected Aircraft Solutions Market Revenue (billion), by Export Market Analysis (Value & Volume) 2025 & 2033
- Figure 21: South America Connected Aircraft Solutions Market Revenue Share (%), by Export Market Analysis (Value & Volume) 2025 & 2033
- Figure 22: South America Connected Aircraft Solutions Market Revenue (billion), by Price Trend Analysis 2025 & 2033
- Figure 23: South America Connected Aircraft Solutions Market Revenue Share (%), by Price Trend Analysis 2025 & 2033
- Figure 24: South America Connected Aircraft Solutions Market Revenue (billion), by Country 2025 & 2033
- Figure 25: South America Connected Aircraft Solutions Market Revenue Share (%), by Country 2025 & 2033
- Figure 26: Europe Connected Aircraft Solutions Market Revenue (billion), by Production Analysis 2025 & 2033
- Figure 27: Europe Connected Aircraft Solutions Market Revenue Share (%), by Production Analysis 2025 & 2033
- Figure 28: Europe Connected Aircraft Solutions Market Revenue (billion), by Consumption Analysis 2025 & 2033
- Figure 29: Europe Connected Aircraft Solutions Market Revenue Share (%), by Consumption Analysis 2025 & 2033
- Figure 30: Europe Connected Aircraft Solutions Market Revenue (billion), by Import Market Analysis (Value & Volume) 2025 & 2033
- Figure 31: Europe Connected Aircraft Solutions Market Revenue Share (%), by Import Market Analysis (Value & Volume) 2025 & 2033
- Figure 32: Europe Connected Aircraft Solutions Market Revenue (billion), by Export Market Analysis (Value & Volume) 2025 & 2033
- Figure 33: Europe Connected Aircraft Solutions Market Revenue Share (%), by Export Market Analysis (Value & Volume) 2025 & 2033
- Figure 34: Europe Connected Aircraft Solutions Market Revenue (billion), by Price Trend Analysis 2025 & 2033
- Figure 35: Europe Connected Aircraft Solutions Market Revenue Share (%), by Price Trend Analysis 2025 & 2033
- Figure 36: Europe Connected Aircraft Solutions Market Revenue (billion), by Country 2025 & 2033
- Figure 37: Europe Connected Aircraft Solutions Market Revenue Share (%), by Country 2025 & 2033
- Figure 38: Middle East & Africa Connected Aircraft Solutions Market Revenue (billion), by Production Analysis 2025 & 2033
- Figure 39: Middle East & Africa Connected Aircraft Solutions Market Revenue Share (%), by Production Analysis 2025 & 2033
- Figure 40: Middle East & Africa Connected Aircraft Solutions Market Revenue (billion), by Consumption Analysis 2025 & 2033
- Figure 41: Middle East & Africa Connected Aircraft Solutions Market Revenue Share (%), by Consumption Analysis 2025 & 2033
- Figure 42: Middle East & Africa Connected Aircraft Solutions Market Revenue (billion), by Import Market Analysis (Value & Volume) 2025 & 2033
- Figure 43: Middle East & Africa Connected Aircraft Solutions Market Revenue Share (%), by Import Market Analysis (Value & Volume) 2025 & 2033
- Figure 44: Middle East & Africa Connected Aircraft Solutions Market Revenue (billion), by Export Market Analysis (Value & Volume) 2025 & 2033
- Figure 45: Middle East & Africa Connected Aircraft Solutions Market Revenue Share (%), by Export Market Analysis (Value & Volume) 2025 & 2033
- Figure 46: Middle East & Africa Connected Aircraft Solutions Market Revenue (billion), by Price Trend Analysis 2025 & 2033
- Figure 47: Middle East & Africa Connected Aircraft Solutions Market Revenue Share (%), by Price Trend Analysis 2025 & 2033
- Figure 48: Middle East & Africa Connected Aircraft Solutions Market Revenue (billion), by Country 2025 & 2033
- Figure 49: Middle East & Africa Connected Aircraft Solutions Market Revenue Share (%), by Country 2025 & 2033
- Figure 50: Asia Pacific Connected Aircraft Solutions Market Revenue (billion), by Production Analysis 2025 & 2033
- Figure 51: Asia Pacific Connected Aircraft Solutions Market Revenue Share (%), by Production Analysis 2025 & 2033
- Figure 52: Asia Pacific Connected Aircraft Solutions Market Revenue (billion), by Consumption Analysis 2025 & 2033
- Figure 53: Asia Pacific Connected Aircraft Solutions Market Revenue Share (%), by Consumption Analysis 2025 & 2033
- Figure 54: Asia Pacific Connected Aircraft Solutions Market Revenue (billion), by Import Market Analysis (Value & Volume) 2025 & 2033
- Figure 55: Asia Pacific Connected Aircraft Solutions Market Revenue Share (%), by Import Market Analysis (Value & Volume) 2025 & 2033
- Figure 56: Asia Pacific Connected Aircraft Solutions Market Revenue (billion), by Export Market Analysis (Value & Volume) 2025 & 2033
- Figure 57: Asia Pacific Connected Aircraft Solutions Market Revenue Share (%), by Export Market Analysis (Value & Volume) 2025 & 2033
- Figure 58: Asia Pacific Connected Aircraft Solutions Market Revenue (billion), by Price Trend Analysis 2025 & 2033
- Figure 59: Asia Pacific Connected Aircraft Solutions Market Revenue Share (%), by Price Trend Analysis 2025 & 2033
- Figure 60: Asia Pacific Connected Aircraft Solutions Market Revenue (billion), by Country 2025 & 2033
- Figure 61: Asia Pacific Connected Aircraft Solutions Market Revenue Share (%), by Country 2025 & 2033
List of Tables
- Table 1: Global Connected Aircraft Solutions Market Revenue billion Forecast, by Production Analysis 2020 & 2033
- Table 2: Global Connected Aircraft Solutions Market Revenue billion Forecast, by Consumption Analysis 2020 & 2033
- Table 3: Global Connected Aircraft Solutions Market Revenue billion Forecast, by Import Market Analysis (Value & Volume) 2020 & 2033
- Table 4: Global Connected Aircraft Solutions Market Revenue billion Forecast, by Export Market Analysis (Value & Volume) 2020 & 2033
- Table 5: Global Connected Aircraft Solutions Market Revenue billion Forecast, by Price Trend Analysis 2020 & 2033
- Table 6: Global Connected Aircraft Solutions Market Revenue billion Forecast, by Region 2020 & 2033
- Table 7: Global Connected Aircraft Solutions Market Revenue billion Forecast, by Production Analysis 2020 & 2033
- Table 8: Global Connected Aircraft Solutions Market Revenue billion Forecast, by Consumption Analysis 2020 & 2033
- Table 9: Global Connected Aircraft Solutions Market Revenue billion Forecast, by Import Market Analysis (Value & Volume) 2020 & 2033
- Table 10: Global Connected Aircraft Solutions Market Revenue billion Forecast, by Export Market Analysis (Value & Volume) 2020 & 2033
- Table 11: Global Connected Aircraft Solutions Market Revenue billion Forecast, by Price Trend Analysis 2020 & 2033
- Table 12: Global Connected Aircraft Solutions Market Revenue billion Forecast, by Country 2020 & 2033
- Table 13: United States Connected Aircraft Solutions Market Revenue (billion) Forecast, by Application 2020 & 2033
- Table 14: Canada Connected Aircraft Solutions Market Revenue (billion) Forecast, by Application 2020 & 2033
- Table 15: Mexico Connected Aircraft Solutions Market Revenue (billion) Forecast, by Application 2020 & 2033
- Table 16: Global Connected Aircraft Solutions Market Revenue billion Forecast, by Production Analysis 2020 & 2033
- Table 17: Global Connected Aircraft Solutions Market Revenue billion Forecast, by Consumption Analysis 2020 & 2033
- Table 18: Global Connected Aircraft Solutions Market Revenue billion Forecast, by Import Market Analysis (Value & Volume) 2020 & 2033
- Table 19: Global Connected Aircraft Solutions Market Revenue billion Forecast, by Export Market Analysis (Value & Volume) 2020 & 2033
- Table 20: Global Connected Aircraft Solutions Market Revenue billion Forecast, by Price Trend Analysis 2020 & 2033
- Table 21: Global Connected Aircraft Solutions Market Revenue billion Forecast, by Country 2020 & 2033
- Table 22: Brazil Connected Aircraft Solutions Market Revenue (billion) Forecast, by Application 2020 & 2033
- Table 23: Argentina Connected Aircraft Solutions Market Revenue (billion) Forecast, by Application 2020 & 2033
- Table 24: Rest of South America Connected Aircraft Solutions Market Revenue (billion) Forecast, by Application 2020 & 2033
- Table 25: Global Connected Aircraft Solutions Market Revenue billion Forecast, by Production Analysis 2020 & 2033
- Table 26: Global Connected Aircraft Solutions Market Revenue billion Forecast, by Consumption Analysis 2020 & 2033
- Table 27: Global Connected Aircraft Solutions Market Revenue billion Forecast, by Import Market Analysis (Value & Volume) 2020 & 2033
- Table 28: Global Connected Aircraft Solutions Market Revenue billion Forecast, by Export Market Analysis (Value & Volume) 2020 & 2033
- Table 29: Global Connected Aircraft Solutions Market Revenue billion Forecast, by Price Trend Analysis 2020 & 2033
- Table 30: Global Connected Aircraft Solutions Market Revenue billion Forecast, by Country 2020 & 2033
- Table 31: United Kingdom Connected Aircraft Solutions Market Revenue (billion) Forecast, by Application 2020 & 2033
- Table 32: Germany Connected Aircraft Solutions Market Revenue (billion) Forecast, by Application 2020 & 2033
- Table 33: France Connected Aircraft Solutions Market Revenue (billion) Forecast, by Application 2020 & 2033
- Table 34: Italy Connected Aircraft Solutions Market Revenue (billion) Forecast, by Application 2020 & 2033
- Table 35: Spain Connected Aircraft Solutions Market Revenue (billion) Forecast, by Application 2020 & 2033
- Table 36: Russia Connected Aircraft Solutions Market Revenue (billion) Forecast, by Application 2020 & 2033
- Table 37: Benelux Connected Aircraft Solutions Market Revenue (billion) Forecast, by Application 2020 & 2033
- Table 38: Nordics Connected Aircraft Solutions Market Revenue (billion) Forecast, by Application 2020 & 2033
- Table 39: Rest of Europe Connected Aircraft Solutions Market Revenue (billion) Forecast, by Application 2020 & 2033
- Table 40: Global Connected Aircraft Solutions Market Revenue billion Forecast, by Production Analysis 2020 & 2033
- Table 41: Global Connected Aircraft Solutions Market Revenue billion Forecast, by Consumption Analysis 2020 & 2033
- Table 42: Global Connected Aircraft Solutions Market Revenue billion Forecast, by Import Market Analysis (Value & Volume) 2020 & 2033
- Table 43: Global Connected Aircraft Solutions Market Revenue billion Forecast, by Export Market Analysis (Value & Volume) 2020 & 2033
- Table 44: Global Connected Aircraft Solutions Market Revenue billion Forecast, by Price Trend Analysis 2020 & 2033
- Table 45: Global Connected Aircraft Solutions Market Revenue billion Forecast, by Country 2020 & 2033
- Table 46: Turkey Connected Aircraft Solutions Market Revenue (billion) Forecast, by Application 2020 & 2033
- Table 47: Israel Connected Aircraft Solutions Market Revenue (billion) Forecast, by Application 2020 & 2033
- Table 48: GCC Connected Aircraft Solutions Market Revenue (billion) Forecast, by Application 2020 & 2033
- Table 49: North Africa Connected Aircraft Solutions Market Revenue (billion) Forecast, by Application 2020 & 2033
- Table 50: South Africa Connected Aircraft Solutions Market Revenue (billion) Forecast, by Application 2020 & 2033
- Table 51: Rest of Middle East & Africa Connected Aircraft Solutions Market Revenue (billion) Forecast, by Application 2020 & 2033
- Table 52: Global Connected Aircraft Solutions Market Revenue billion Forecast, by Production Analysis 2020 & 2033
- Table 53: Global Connected Aircraft Solutions Market Revenue billion Forecast, by Consumption Analysis 2020 & 2033
- Table 54: Global Connected Aircraft Solutions Market Revenue billion Forecast, by Import Market Analysis (Value & Volume) 2020 & 2033
- Table 55: Global Connected Aircraft Solutions Market Revenue billion Forecast, by Export Market Analysis (Value & Volume) 2020 & 2033
- Table 56: Global Connected Aircraft Solutions Market Revenue billion Forecast, by Price Trend Analysis 2020 & 2033
- Table 57: Global Connected Aircraft Solutions Market Revenue billion Forecast, by Country 2020 & 2033
- Table 58: China Connected Aircraft Solutions Market Revenue (billion) Forecast, by Application 2020 & 2033
- Table 59: India Connected Aircraft Solutions Market Revenue (billion) Forecast, by Application 2020 & 2033
- Table 60: Japan Connected Aircraft Solutions Market Revenue (billion) Forecast, by Application 2020 & 2033
- Table 61: South Korea Connected Aircraft Solutions Market Revenue (billion) Forecast, by Application 2020 & 2033
- Table 62: ASEAN Connected Aircraft Solutions Market Revenue (billion) Forecast, by Application 2020 & 2033
- Table 63: Oceania Connected Aircraft Solutions Market Revenue (billion) Forecast, by Application 2020 & 2033
- Table 64: Rest of Asia Pacific Connected Aircraft Solutions Market Revenue (billion) Forecast, by Application 2020 & 2033
Frequently Asked Questions
1. What is the projected Compound Annual Growth Rate (CAGR) of the Connected Aircraft Solutions Market?
The projected CAGR is approximately 12.6%.
2. Which companies are prominent players in the Connected Aircraft Solutions Market?
Key companies in the market include Honeywell International Inc, Collins Aerospace (RTX Corporation), THALES, KONTRON AG, Inmarsat Global Limited, Viasat Inc, Cobham Limited, Gogo Inc, Anuvu Operations LLC, SITA, Burran, Panasonic Holdings Corporation.
3. What are the main segments of the Connected Aircraft Solutions Market?
The market segments include Production Analysis, Consumption Analysis, Import Market Analysis (Value & Volume), Export Market Analysis (Value & Volume), Price Trend Analysis.
4. Can you provide details about the market size?
The market size is estimated to be USD 7.84 billion as of 2022.
5. What are some drivers contributing to market growth?
N/A
6. What are the notable trends driving market growth?
Commercial Aircraft is Anticipated to Register Highest Growth.
7. Are there any restraints impacting market growth?
N/A
8. Can you provide examples of recent developments in the market?
May 2023: Inmarsat announced its market-leading Jet ConneX (JX) inflight broadband solution with a new set of service plans that are introduced to redefine the gold standard connectivity in the business aviation market. Moreover, new and existing customers can now select Jet Connex plans that redefine passenger experience for the coming years.
9. What pricing options are available for accessing the report?
Pricing options include single-user, multi-user, and enterprise licenses priced at USD 4750, USD 5250, and USD 8750 respectively.
10. Is the market size provided in terms of value or volume?
The market size is provided in terms of value, measured in billion.
11. Are there any specific market keywords associated with the report?
Yes, the market keyword associated with the report is "Connected Aircraft Solutions Market," which aids in identifying and referencing the specific market segment covered.
12. How do I determine which pricing option suits my needs best?
The pricing options vary based on user requirements and access needs. Individual users may opt for single-user licenses, while businesses requiring broader access may choose multi-user or enterprise licenses for cost-effective access to the report.
13. Are there any additional resources or data provided in the Connected Aircraft Solutions Market report?
While the report offers comprehensive insights, it's advisable to review the specific contents or supplementary materials provided to ascertain if additional resources or data are available.
14. How can I stay updated on further developments or reports in the Connected Aircraft Solutions Market?
To stay informed about further developments, trends, and reports in the Connected Aircraft Solutions Market, consider subscribing to industry newsletters, following relevant companies and organizations, or regularly checking reputable industry news sources and publications.
Methodology
Step 1 - Identification of Relevant Samples Size from Population Database


Step 2 - Approaches for Defining Global Market Size (Value, Volume* & Price*)

Note*: In applicable scenarios
Step 3 - Data Sources
Primary Research
- Web Analytics
- Survey Reports
- Research Institute
- Latest Research Reports
- Opinion Leaders
Secondary Research
- Annual Reports
- White Paper
- Latest Press Release
- Industry Association
- Paid Database
- Investor Presentations

Step 4 - Data Triangulation
Involves using different sources of information in order to increase the validity of a study
These sources are likely to be stakeholders in a program - participants, other researchers, program staff, other community members, and so on.
Then we put all data in single framework & apply various statistical tools to find out the dynamic on the market.
During the analysis stage, feedback from the stakeholder groups would be compared to determine areas of agreement as well as areas of divergence