
Key Insights
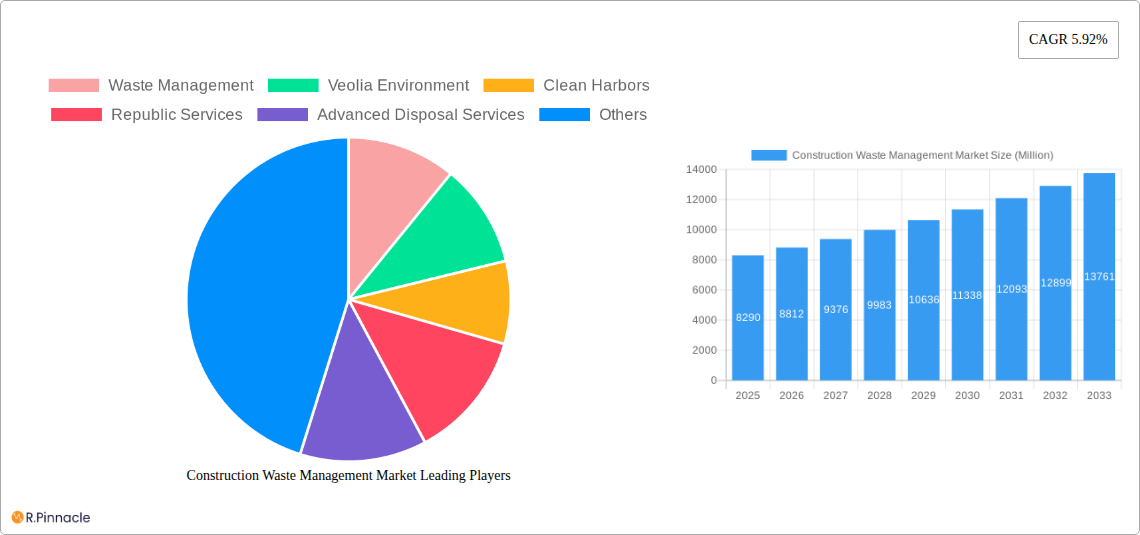
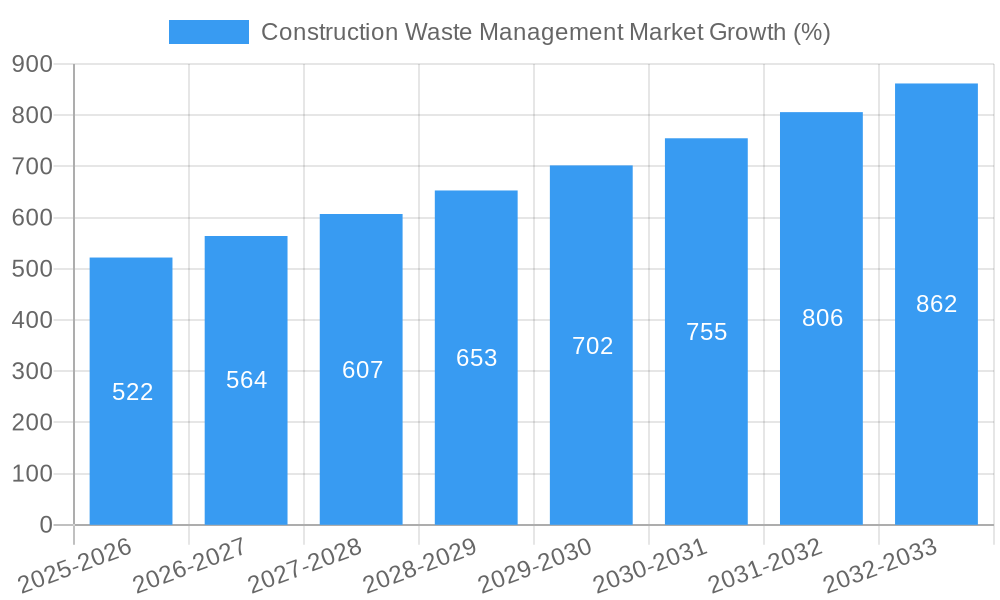
The construction waste management market, currently valued at $8.29 billion in 2025, is projected to experience robust growth, driven by increasing urbanization, stringent environmental regulations, and a rising focus on sustainable construction practices. A compound annual growth rate (CAGR) of 5.92% from 2025 to 2033 indicates a significant expansion of the market, reaching an estimated value exceeding $13 billion by 2033. Key drivers include the growing volume of construction debris generated globally, the increasing adoption of recycling and resource recovery technologies, and government initiatives promoting waste reduction and responsible disposal. Trends such as the emergence of innovative waste management solutions, including advanced sorting technologies and the utilization of recycled construction materials, are further fueling market growth. However, challenges such as the high initial investment costs associated with implementing advanced waste management systems and inconsistent waste management regulations across different regions could act as potential restraints. The market is segmented by waste type (concrete, wood, metal, etc.), treatment method (landfilling, recycling, incineration), and geographical region. Leading players such as Waste Management, Veolia Environment, Clean Harbors, Republic Services, and others are actively shaping the market landscape through strategic acquisitions, technological advancements, and expansion into new geographic markets.
The competitive landscape is characterized by a mix of large multinational corporations and smaller regional players. The market is witnessing a shift towards integrated waste management solutions that encompass collection, processing, and disposal. Future growth will be significantly influenced by technological advancements, evolving regulatory frameworks, and the growing emphasis on circular economy principles within the construction sector. The increasing adoption of digital technologies for waste management, such as smart sensors and data analytics, is also expected to contribute to market expansion. Regions with high construction activity and stringent environmental regulations are likely to exhibit faster growth rates.
Construction Waste Management Market Report: 2019-2033
This comprehensive report provides an in-depth analysis of the Construction Waste Management Market, offering valuable insights for industry professionals, investors, and stakeholders. Covering the period from 2019 to 2033, with a focus on 2025, this report examines market dynamics, competitive landscapes, and future growth opportunities. The report leverages extensive data analysis to provide actionable intelligence and strategic recommendations.
Construction Waste Management Market Structure & Innovation Trends
This section analyzes the market's competitive landscape, encompassing market concentration, innovation drivers, regulatory frameworks, product substitutes, end-user demographics, and mergers & acquisitions (M&A) activities.
The market exhibits a moderately concentrated structure with key players such as Waste Management, Veolia Environment, Clean Harbors, and Republic Services holding significant market share. Precise market share figures for 2025 are unavailable at this time (xx%), but estimates suggest a combined share of approximately 40%. Innovation is driven by stringent environmental regulations, increasing construction activity, and the growing demand for sustainable practices. The market is witnessing a rise in technological advancements, including automated sorting systems, advanced recycling techniques, and innovative waste-to-energy solutions. Several M&A activities, valued at approximately $XX Million in the last five years (2019-2024), have reshaped the competitive landscape, driving consolidation.
- Market Concentration: Moderately concentrated, with top players holding significant shares (xx%).
- Innovation Drivers: Stringent environmental regulations, increasing construction activity, demand for sustainable practices.
- Regulatory Frameworks: Vary significantly across regions, impacting waste management strategies.
- Product Substitutes: Limited, mainly focusing on alternative disposal methods with lower environmental impact.
- End-User Demographics: Primarily construction companies, demolition contractors, and waste management firms.
- M&A Activities: Significant consolidation with deals valued at approximately $XX Million (2019-2024).
Construction Waste Management Market Dynamics & Trends
This section explores the key market drivers, technological disruptions, consumer preferences, and competitive dynamics influencing market growth. The market is projected to experience robust growth, with a Compound Annual Growth Rate (CAGR) of xx% during the forecast period (2025-2033). Market penetration is increasing, especially in developed regions with stringent waste management regulations. Technological advancements, such as AI-powered waste sorting and advanced recycling technologies, are significantly impacting market dynamics. The growing awareness of environmental sustainability and increasing regulatory pressure are further driving market expansion. Competitive dynamics are characterized by strategic partnerships, technological innovations, and acquisitions.
Dominant Regions & Segments in Construction Waste Management Market
This section identifies the leading regions and segments within the Construction Waste Management Market.
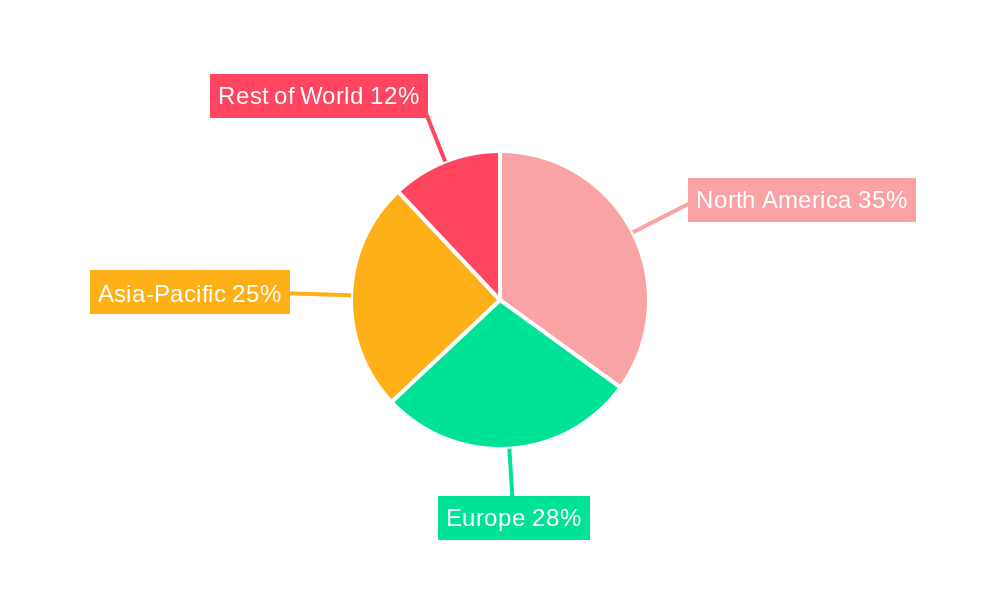
While precise data for market dominance is unavailable at this time, initial analysis suggests that North America and Europe are leading regions, driven by high construction activity and stringent environmental regulations. Specific country-level dominance varies greatly, depending on local regulations and infrastructure. Within segments, the demolition waste segment likely represents a significant share due to the large volumes generated.
Key Drivers (North America & Europe):
- Stringent environmental regulations and policies promoting recycling.
- High construction activity and infrastructure development projects.
- Increased awareness of sustainable construction practices.
- Robust waste management infrastructure and technological advancements.
Dominance Analysis: North America and Europe are currently leading, with Asia Pacific expected to see significant growth.
Construction Waste Management Market Product Innovations
This market showcases continuous innovation in waste processing technologies. Advancements in automated sorting systems enhance efficiency and recovery rates for recyclable materials. Innovative waste-to-energy technologies provide sustainable alternatives for non-recyclable waste, reducing landfill reliance. These improvements cater to the growing demand for environmentally friendly and cost-effective waste management solutions. The competitive landscape is driven by companies investing in research and development to improve efficiency and introduce sustainable alternatives.
Report Scope & Segmentation Analysis
This report segments the Construction Waste Management Market based on waste type (e.g., demolition waste, construction waste), waste processing method (e.g., recycling, incineration), and geography. Each segment displays unique growth trajectories and competitive dynamics. Growth projections vary considerably between segments, with recycling and resource recovery likely witnessing higher growth rates due to sustainability initiatives. Market sizes will vary by segment, with demolition waste being a significant volume contributor.
Key Drivers of Construction Waste Management Market Growth
The Construction Waste Management Market is driven by several key factors. Stringent environmental regulations are mandating better waste management practices, pushing for increased recycling and reduced landfill reliance. Growing construction activity and infrastructure development across various regions increase waste generation, boosting demand for effective waste management solutions. Technological advancements in waste processing and recycling technologies enhance efficiency and cost-effectiveness, driving market growth.
Challenges in the Construction Waste Management Market Sector
This market faces challenges such as inconsistent regulatory frameworks across regions, creating operational complexities and cost variations. Supply chain issues and fluctuating material prices can impact the profitability of waste management operations. Intense competition among established players and emerging companies adds to the challenges faced by the sector.
Emerging Opportunities in Construction Waste Management Market
Emerging opportunities exist in developing economies with rapidly expanding construction sectors and limited waste management infrastructure. Advancements in waste-to-energy technologies, enabling energy recovery from waste, presents significant opportunities. The integration of digital technologies and data analytics improves efficiency, resource optimization, and environmental compliance.
Leading Players in the Construction Waste Management Market Market
- Waste Management
- Veolia Environment
- Clean Harbors
- Republic Services
- Advanced Disposal Services
- Biffa
- Covanta Holding
- Daiseki
- Hitachi Zosen
- 3 Other Companies
Key Developments in Construction Waste Management Market Industry
- July 2024: Sortera acquired Reston Waste Management Ltd., expanding its presence in the Greater London construction waste market.
- July 2024: Holcim acquired Land Recovery in the UK, strengthening its position in circular construction and expanding its portfolio of recycled construction demolition materials (over 300,000 tons in 2023).
Future Outlook for Construction Waste Management Market Market
The Construction Waste Management Market is poised for continued growth, driven by increasing urbanization, infrastructure development, and stringent environmental regulations. Strategic investments in advanced technologies, sustainable practices, and efficient waste management infrastructure will play a pivotal role in shaping the market's future. The focus on circular economy principles and resource recovery will drive innovation and create new opportunities for market players.
Construction Waste Management Market Segmentation
-
1. Waste Type
- 1.1. Hazardous
- 1.2. Non-hazardous
-
2. Source
- 2.1. Residential
- 2.2. Non-residential
-
3. Material
- 3.1. Concrete & Bricks
- 3.2. Wood
- 3.3. Metal
- 3.4. Plastics
- 3.5. Glass
- 3.6. Other Materials (Soil, Drywall, Plaster, etc.)
Construction Waste Management Market Segmentation By Geography
-
1. North America
- 1.1. United States
- 1.2. Canada
- 1.3. Mexico
- 1.4. Rest of North America
-
2. Europe
- 2.1. United Kingdom
- 2.2. Germany
- 2.3. France
- 2.4. Russia
- 2.5. Italy
- 2.6. Spain
- 2.7. Rest of Europe
-
3. Asia Pacific
- 3.1. India
- 3.2. China
- 3.3. Japan
- 3.4. Australia
- 3.5. Rest of Asia Pacific
-
4. South America
- 4.1. Brazil
- 4.2. Argentina
- 4.3. Rest of South America
-
5. Middle East and Africa
- 5.1. United Arab Emirates
- 5.2. South Africa
- 5.3. Rest of Middle East and Africa
Construction Waste Management Market REPORT HIGHLIGHTS
| Aspects | Details |
|---|---|
| Study Period | 2019-2033 |
| Base Year | 2024 |
| Estimated Year | 2025 |
| Forecast Period | 2025-2033 |
| Historical Period | 2019-2024 |
| Growth Rate | CAGR of 5.92% from 2019-2033 |
| Segmentation |
|
Table of Contents
- 1. Introduction
- 1.1. Research Scope
- 1.2. Market Segmentation
- 1.3. Research Methodology
- 1.4. Definitions and Assumptions
- 2. Executive Summary
- 2.1. Introduction
- 3. Market Dynamics
- 3.1. Introduction
- 3.2. Market Drivers
- 3.2.1. 4.; Urbanization and Population Growth Driving the Market4.; Economic Growth Driving the Market
- 3.3. Market Restrains
- 3.3.1. 4.; Urbanization and Population Growth Driving the Market4.; Economic Growth Driving the Market
- 3.4. Market Trends
- 3.4.1. Residential Construction Waste Holds a Significant Share of the Market
- 4. Market Factor Analysis
- 4.1. Porters Five Forces
- 4.2. Supply/Value Chain
- 4.3. PESTEL analysis
- 4.4. Market Entropy
- 4.5. Patent/Trademark Analysis
- 5. Global Construction Waste Management Market Analysis, Insights and Forecast, 2019-2031
- 5.1. Market Analysis, Insights and Forecast - by Waste Type
- 5.1.1. Hazardous
- 5.1.2. Non-hazardous
- 5.2. Market Analysis, Insights and Forecast - by Source
- 5.2.1. Residential
- 5.2.2. Non-residential
- 5.3. Market Analysis, Insights and Forecast - by Material
- 5.3.1. Concrete & Bricks
- 5.3.2. Wood
- 5.3.3. Metal
- 5.3.4. Plastics
- 5.3.5. Glass
- 5.3.6. Other Materials (Soil, Drywall, Plaster, etc.)
- 5.4. Market Analysis, Insights and Forecast - by Region
- 5.4.1. North America
- 5.4.2. Europe
- 5.4.3. Asia Pacific
- 5.4.4. South America
- 5.4.5. Middle East and Africa
- 5.1. Market Analysis, Insights and Forecast - by Waste Type
- 6. North America Construction Waste Management Market Analysis, Insights and Forecast, 2019-2031
- 6.1. Market Analysis, Insights and Forecast - by Waste Type
- 6.1.1. Hazardous
- 6.1.2. Non-hazardous
- 6.2. Market Analysis, Insights and Forecast - by Source
- 6.2.1. Residential
- 6.2.2. Non-residential
- 6.3. Market Analysis, Insights and Forecast - by Material
- 6.3.1. Concrete & Bricks
- 6.3.2. Wood
- 6.3.3. Metal
- 6.3.4. Plastics
- 6.3.5. Glass
- 6.3.6. Other Materials (Soil, Drywall, Plaster, etc.)
- 6.1. Market Analysis, Insights and Forecast - by Waste Type
- 7. Europe Construction Waste Management Market Analysis, Insights and Forecast, 2019-2031
- 7.1. Market Analysis, Insights and Forecast - by Waste Type
- 7.1.1. Hazardous
- 7.1.2. Non-hazardous
- 7.2. Market Analysis, Insights and Forecast - by Source
- 7.2.1. Residential
- 7.2.2. Non-residential
- 7.3. Market Analysis, Insights and Forecast - by Material
- 7.3.1. Concrete & Bricks
- 7.3.2. Wood
- 7.3.3. Metal
- 7.3.4. Plastics
- 7.3.5. Glass
- 7.3.6. Other Materials (Soil, Drywall, Plaster, etc.)
- 7.1. Market Analysis, Insights and Forecast - by Waste Type
- 8. Asia Pacific Construction Waste Management Market Analysis, Insights and Forecast, 2019-2031
- 8.1. Market Analysis, Insights and Forecast - by Waste Type
- 8.1.1. Hazardous
- 8.1.2. Non-hazardous
- 8.2. Market Analysis, Insights and Forecast - by Source
- 8.2.1. Residential
- 8.2.2. Non-residential
- 8.3. Market Analysis, Insights and Forecast - by Material
- 8.3.1. Concrete & Bricks
- 8.3.2. Wood
- 8.3.3. Metal
- 8.3.4. Plastics
- 8.3.5. Glass
- 8.3.6. Other Materials (Soil, Drywall, Plaster, etc.)
- 8.1. Market Analysis, Insights and Forecast - by Waste Type
- 9. South America Construction Waste Management Market Analysis, Insights and Forecast, 2019-2031
- 9.1. Market Analysis, Insights and Forecast - by Waste Type
- 9.1.1. Hazardous
- 9.1.2. Non-hazardous
- 9.2. Market Analysis, Insights and Forecast - by Source
- 9.2.1. Residential
- 9.2.2. Non-residential
- 9.3. Market Analysis, Insights and Forecast - by Material
- 9.3.1. Concrete & Bricks
- 9.3.2. Wood
- 9.3.3. Metal
- 9.3.4. Plastics
- 9.3.5. Glass
- 9.3.6. Other Materials (Soil, Drywall, Plaster, etc.)
- 9.1. Market Analysis, Insights and Forecast - by Waste Type
- 10. Middle East and Africa Construction Waste Management Market Analysis, Insights and Forecast, 2019-2031
- 10.1. Market Analysis, Insights and Forecast - by Waste Type
- 10.1.1. Hazardous
- 10.1.2. Non-hazardous
- 10.2. Market Analysis, Insights and Forecast - by Source
- 10.2.1. Residential
- 10.2.2. Non-residential
- 10.3. Market Analysis, Insights and Forecast - by Material
- 10.3.1. Concrete & Bricks
- 10.3.2. Wood
- 10.3.3. Metal
- 10.3.4. Plastics
- 10.3.5. Glass
- 10.3.6. Other Materials (Soil, Drywall, Plaster, etc.)
- 10.1. Market Analysis, Insights and Forecast - by Waste Type
- 11. Competitive Analysis
- 11.1. Global Market Share Analysis 2024
- 11.2. Company Profiles
- 11.2.1 Waste Management
- 11.2.1.1. Overview
- 11.2.1.2. Products
- 11.2.1.3. SWOT Analysis
- 11.2.1.4. Recent Developments
- 11.2.1.5. Financials (Based on Availability)
- 11.2.2 Veolia Environment
- 11.2.2.1. Overview
- 11.2.2.2. Products
- 11.2.2.3. SWOT Analysis
- 11.2.2.4. Recent Developments
- 11.2.2.5. Financials (Based on Availability)
- 11.2.3 Clean Harbors
- 11.2.3.1. Overview
- 11.2.3.2. Products
- 11.2.3.3. SWOT Analysis
- 11.2.3.4. Recent Developments
- 11.2.3.5. Financials (Based on Availability)
- 11.2.4 Republic Services
- 11.2.4.1. Overview
- 11.2.4.2. Products
- 11.2.4.3. SWOT Analysis
- 11.2.4.4. Recent Developments
- 11.2.4.5. Financials (Based on Availability)
- 11.2.5 Advanced Disposal Services
- 11.2.5.1. Overview
- 11.2.5.2. Products
- 11.2.5.3. SWOT Analysis
- 11.2.5.4. Recent Developments
- 11.2.5.5. Financials (Based on Availability)
- 11.2.6 Biffa
- 11.2.6.1. Overview
- 11.2.6.2. Products
- 11.2.6.3. SWOT Analysis
- 11.2.6.4. Recent Developments
- 11.2.6.5. Financials (Based on Availability)
- 11.2.7 Covanta Holding
- 11.2.7.1. Overview
- 11.2.7.2. Products
- 11.2.7.3. SWOT Analysis
- 11.2.7.4. Recent Developments
- 11.2.7.5. Financials (Based on Availability)
- 11.2.8 Daiseki
- 11.2.8.1. Overview
- 11.2.8.2. Products
- 11.2.8.3. SWOT Analysis
- 11.2.8.4. Recent Developments
- 11.2.8.5. Financials (Based on Availability)
- 11.2.9 Hitachi Zosen6 3 Other Companies
- 11.2.9.1. Overview
- 11.2.9.2. Products
- 11.2.9.3. SWOT Analysis
- 11.2.9.4. Recent Developments
- 11.2.9.5. Financials (Based on Availability)
- 11.2.1 Waste Management
List of Figures
- Figure 1: Global Construction Waste Management Market Revenue Breakdown (Million, %) by Region 2024 & 2032
- Figure 2: Global Construction Waste Management Market Volume Breakdown (Billion, %) by Region 2024 & 2032
- Figure 3: North America Construction Waste Management Market Revenue (Million), by Waste Type 2024 & 2032
- Figure 4: North America Construction Waste Management Market Volume (Billion), by Waste Type 2024 & 2032
- Figure 5: North America Construction Waste Management Market Revenue Share (%), by Waste Type 2024 & 2032
- Figure 6: North America Construction Waste Management Market Volume Share (%), by Waste Type 2024 & 2032
- Figure 7: North America Construction Waste Management Market Revenue (Million), by Source 2024 & 2032
- Figure 8: North America Construction Waste Management Market Volume (Billion), by Source 2024 & 2032
- Figure 9: North America Construction Waste Management Market Revenue Share (%), by Source 2024 & 2032
- Figure 10: North America Construction Waste Management Market Volume Share (%), by Source 2024 & 2032
- Figure 11: North America Construction Waste Management Market Revenue (Million), by Material 2024 & 2032
- Figure 12: North America Construction Waste Management Market Volume (Billion), by Material 2024 & 2032
- Figure 13: North America Construction Waste Management Market Revenue Share (%), by Material 2024 & 2032
- Figure 14: North America Construction Waste Management Market Volume Share (%), by Material 2024 & 2032
- Figure 15: North America Construction Waste Management Market Revenue (Million), by Country 2024 & 2032
- Figure 16: North America Construction Waste Management Market Volume (Billion), by Country 2024 & 2032
- Figure 17: North America Construction Waste Management Market Revenue Share (%), by Country 2024 & 2032
- Figure 18: North America Construction Waste Management Market Volume Share (%), by Country 2024 & 2032
- Figure 19: Europe Construction Waste Management Market Revenue (Million), by Waste Type 2024 & 2032
- Figure 20: Europe Construction Waste Management Market Volume (Billion), by Waste Type 2024 & 2032
- Figure 21: Europe Construction Waste Management Market Revenue Share (%), by Waste Type 2024 & 2032
- Figure 22: Europe Construction Waste Management Market Volume Share (%), by Waste Type 2024 & 2032
- Figure 23: Europe Construction Waste Management Market Revenue (Million), by Source 2024 & 2032
- Figure 24: Europe Construction Waste Management Market Volume (Billion), by Source 2024 & 2032
- Figure 25: Europe Construction Waste Management Market Revenue Share (%), by Source 2024 & 2032
- Figure 26: Europe Construction Waste Management Market Volume Share (%), by Source 2024 & 2032
- Figure 27: Europe Construction Waste Management Market Revenue (Million), by Material 2024 & 2032
- Figure 28: Europe Construction Waste Management Market Volume (Billion), by Material 2024 & 2032
- Figure 29: Europe Construction Waste Management Market Revenue Share (%), by Material 2024 & 2032
- Figure 30: Europe Construction Waste Management Market Volume Share (%), by Material 2024 & 2032
- Figure 31: Europe Construction Waste Management Market Revenue (Million), by Country 2024 & 2032
- Figure 32: Europe Construction Waste Management Market Volume (Billion), by Country 2024 & 2032
- Figure 33: Europe Construction Waste Management Market Revenue Share (%), by Country 2024 & 2032
- Figure 34: Europe Construction Waste Management Market Volume Share (%), by Country 2024 & 2032
- Figure 35: Asia Pacific Construction Waste Management Market Revenue (Million), by Waste Type 2024 & 2032
- Figure 36: Asia Pacific Construction Waste Management Market Volume (Billion), by Waste Type 2024 & 2032
- Figure 37: Asia Pacific Construction Waste Management Market Revenue Share (%), by Waste Type 2024 & 2032
- Figure 38: Asia Pacific Construction Waste Management Market Volume Share (%), by Waste Type 2024 & 2032
- Figure 39: Asia Pacific Construction Waste Management Market Revenue (Million), by Source 2024 & 2032
- Figure 40: Asia Pacific Construction Waste Management Market Volume (Billion), by Source 2024 & 2032
- Figure 41: Asia Pacific Construction Waste Management Market Revenue Share (%), by Source 2024 & 2032
- Figure 42: Asia Pacific Construction Waste Management Market Volume Share (%), by Source 2024 & 2032
- Figure 43: Asia Pacific Construction Waste Management Market Revenue (Million), by Material 2024 & 2032
- Figure 44: Asia Pacific Construction Waste Management Market Volume (Billion), by Material 2024 & 2032
- Figure 45: Asia Pacific Construction Waste Management Market Revenue Share (%), by Material 2024 & 2032
- Figure 46: Asia Pacific Construction Waste Management Market Volume Share (%), by Material 2024 & 2032
- Figure 47: Asia Pacific Construction Waste Management Market Revenue (Million), by Country 2024 & 2032
- Figure 48: Asia Pacific Construction Waste Management Market Volume (Billion), by Country 2024 & 2032
- Figure 49: Asia Pacific Construction Waste Management Market Revenue Share (%), by Country 2024 & 2032
- Figure 50: Asia Pacific Construction Waste Management Market Volume Share (%), by Country 2024 & 2032
- Figure 51: South America Construction Waste Management Market Revenue (Million), by Waste Type 2024 & 2032
- Figure 52: South America Construction Waste Management Market Volume (Billion), by Waste Type 2024 & 2032
- Figure 53: South America Construction Waste Management Market Revenue Share (%), by Waste Type 2024 & 2032
- Figure 54: South America Construction Waste Management Market Volume Share (%), by Waste Type 2024 & 2032
- Figure 55: South America Construction Waste Management Market Revenue (Million), by Source 2024 & 2032
- Figure 56: South America Construction Waste Management Market Volume (Billion), by Source 2024 & 2032
- Figure 57: South America Construction Waste Management Market Revenue Share (%), by Source 2024 & 2032
- Figure 58: South America Construction Waste Management Market Volume Share (%), by Source 2024 & 2032
- Figure 59: South America Construction Waste Management Market Revenue (Million), by Material 2024 & 2032
- Figure 60: South America Construction Waste Management Market Volume (Billion), by Material 2024 & 2032
- Figure 61: South America Construction Waste Management Market Revenue Share (%), by Material 2024 & 2032
- Figure 62: South America Construction Waste Management Market Volume Share (%), by Material 2024 & 2032
- Figure 63: South America Construction Waste Management Market Revenue (Million), by Country 2024 & 2032
- Figure 64: South America Construction Waste Management Market Volume (Billion), by Country 2024 & 2032
- Figure 65: South America Construction Waste Management Market Revenue Share (%), by Country 2024 & 2032
- Figure 66: South America Construction Waste Management Market Volume Share (%), by Country 2024 & 2032
- Figure 67: Middle East and Africa Construction Waste Management Market Revenue (Million), by Waste Type 2024 & 2032
- Figure 68: Middle East and Africa Construction Waste Management Market Volume (Billion), by Waste Type 2024 & 2032
- Figure 69: Middle East and Africa Construction Waste Management Market Revenue Share (%), by Waste Type 2024 & 2032
- Figure 70: Middle East and Africa Construction Waste Management Market Volume Share (%), by Waste Type 2024 & 2032
- Figure 71: Middle East and Africa Construction Waste Management Market Revenue (Million), by Source 2024 & 2032
- Figure 72: Middle East and Africa Construction Waste Management Market Volume (Billion), by Source 2024 & 2032
- Figure 73: Middle East and Africa Construction Waste Management Market Revenue Share (%), by Source 2024 & 2032
- Figure 74: Middle East and Africa Construction Waste Management Market Volume Share (%), by Source 2024 & 2032
- Figure 75: Middle East and Africa Construction Waste Management Market Revenue (Million), by Material 2024 & 2032
- Figure 76: Middle East and Africa Construction Waste Management Market Volume (Billion), by Material 2024 & 2032
- Figure 77: Middle East and Africa Construction Waste Management Market Revenue Share (%), by Material 2024 & 2032
- Figure 78: Middle East and Africa Construction Waste Management Market Volume Share (%), by Material 2024 & 2032
- Figure 79: Middle East and Africa Construction Waste Management Market Revenue (Million), by Country 2024 & 2032
- Figure 80: Middle East and Africa Construction Waste Management Market Volume (Billion), by Country 2024 & 2032
- Figure 81: Middle East and Africa Construction Waste Management Market Revenue Share (%), by Country 2024 & 2032
- Figure 82: Middle East and Africa Construction Waste Management Market Volume Share (%), by Country 2024 & 2032
List of Tables
- Table 1: Global Construction Waste Management Market Revenue Million Forecast, by Region 2019 & 2032
- Table 2: Global Construction Waste Management Market Volume Billion Forecast, by Region 2019 & 2032
- Table 3: Global Construction Waste Management Market Revenue Million Forecast, by Waste Type 2019 & 2032
- Table 4: Global Construction Waste Management Market Volume Billion Forecast, by Waste Type 2019 & 2032
- Table 5: Global Construction Waste Management Market Revenue Million Forecast, by Source 2019 & 2032
- Table 6: Global Construction Waste Management Market Volume Billion Forecast, by Source 2019 & 2032
- Table 7: Global Construction Waste Management Market Revenue Million Forecast, by Material 2019 & 2032
- Table 8: Global Construction Waste Management Market Volume Billion Forecast, by Material 2019 & 2032
- Table 9: Global Construction Waste Management Market Revenue Million Forecast, by Region 2019 & 2032
- Table 10: Global Construction Waste Management Market Volume Billion Forecast, by Region 2019 & 2032
- Table 11: Global Construction Waste Management Market Revenue Million Forecast, by Waste Type 2019 & 2032
- Table 12: Global Construction Waste Management Market Volume Billion Forecast, by Waste Type 2019 & 2032
- Table 13: Global Construction Waste Management Market Revenue Million Forecast, by Source 2019 & 2032
- Table 14: Global Construction Waste Management Market Volume Billion Forecast, by Source 2019 & 2032
- Table 15: Global Construction Waste Management Market Revenue Million Forecast, by Material 2019 & 2032
- Table 16: Global Construction Waste Management Market Volume Billion Forecast, by Material 2019 & 2032
- Table 17: Global Construction Waste Management Market Revenue Million Forecast, by Country 2019 & 2032
- Table 18: Global Construction Waste Management Market Volume Billion Forecast, by Country 2019 & 2032
- Table 19: United States Construction Waste Management Market Revenue (Million) Forecast, by Application 2019 & 2032
- Table 20: United States Construction Waste Management Market Volume (Billion) Forecast, by Application 2019 & 2032
- Table 21: Canada Construction Waste Management Market Revenue (Million) Forecast, by Application 2019 & 2032
- Table 22: Canada Construction Waste Management Market Volume (Billion) Forecast, by Application 2019 & 2032
- Table 23: Mexico Construction Waste Management Market Revenue (Million) Forecast, by Application 2019 & 2032
- Table 24: Mexico Construction Waste Management Market Volume (Billion) Forecast, by Application 2019 & 2032
- Table 25: Rest of North America Construction Waste Management Market Revenue (Million) Forecast, by Application 2019 & 2032
- Table 26: Rest of North America Construction Waste Management Market Volume (Billion) Forecast, by Application 2019 & 2032
- Table 27: Global Construction Waste Management Market Revenue Million Forecast, by Waste Type 2019 & 2032
- Table 28: Global Construction Waste Management Market Volume Billion Forecast, by Waste Type 2019 & 2032
- Table 29: Global Construction Waste Management Market Revenue Million Forecast, by Source 2019 & 2032
- Table 30: Global Construction Waste Management Market Volume Billion Forecast, by Source 2019 & 2032
- Table 31: Global Construction Waste Management Market Revenue Million Forecast, by Material 2019 & 2032
- Table 32: Global Construction Waste Management Market Volume Billion Forecast, by Material 2019 & 2032
- Table 33: Global Construction Waste Management Market Revenue Million Forecast, by Country 2019 & 2032
- Table 34: Global Construction Waste Management Market Volume Billion Forecast, by Country 2019 & 2032
- Table 35: United Kingdom Construction Waste Management Market Revenue (Million) Forecast, by Application 2019 & 2032
- Table 36: United Kingdom Construction Waste Management Market Volume (Billion) Forecast, by Application 2019 & 2032
- Table 37: Germany Construction Waste Management Market Revenue (Million) Forecast, by Application 2019 & 2032
- Table 38: Germany Construction Waste Management Market Volume (Billion) Forecast, by Application 2019 & 2032
- Table 39: France Construction Waste Management Market Revenue (Million) Forecast, by Application 2019 & 2032
- Table 40: France Construction Waste Management Market Volume (Billion) Forecast, by Application 2019 & 2032
- Table 41: Russia Construction Waste Management Market Revenue (Million) Forecast, by Application 2019 & 2032
- Table 42: Russia Construction Waste Management Market Volume (Billion) Forecast, by Application 2019 & 2032
- Table 43: Italy Construction Waste Management Market Revenue (Million) Forecast, by Application 2019 & 2032
- Table 44: Italy Construction Waste Management Market Volume (Billion) Forecast, by Application 2019 & 2032
- Table 45: Spain Construction Waste Management Market Revenue (Million) Forecast, by Application 2019 & 2032
- Table 46: Spain Construction Waste Management Market Volume (Billion) Forecast, by Application 2019 & 2032
- Table 47: Rest of Europe Construction Waste Management Market Revenue (Million) Forecast, by Application 2019 & 2032
- Table 48: Rest of Europe Construction Waste Management Market Volume (Billion) Forecast, by Application 2019 & 2032
- Table 49: Global Construction Waste Management Market Revenue Million Forecast, by Waste Type 2019 & 2032
- Table 50: Global Construction Waste Management Market Volume Billion Forecast, by Waste Type 2019 & 2032
- Table 51: Global Construction Waste Management Market Revenue Million Forecast, by Source 2019 & 2032
- Table 52: Global Construction Waste Management Market Volume Billion Forecast, by Source 2019 & 2032
- Table 53: Global Construction Waste Management Market Revenue Million Forecast, by Material 2019 & 2032
- Table 54: Global Construction Waste Management Market Volume Billion Forecast, by Material 2019 & 2032
- Table 55: Global Construction Waste Management Market Revenue Million Forecast, by Country 2019 & 2032
- Table 56: Global Construction Waste Management Market Volume Billion Forecast, by Country 2019 & 2032
- Table 57: India Construction Waste Management Market Revenue (Million) Forecast, by Application 2019 & 2032
- Table 58: India Construction Waste Management Market Volume (Billion) Forecast, by Application 2019 & 2032
- Table 59: China Construction Waste Management Market Revenue (Million) Forecast, by Application 2019 & 2032
- Table 60: China Construction Waste Management Market Volume (Billion) Forecast, by Application 2019 & 2032
- Table 61: Japan Construction Waste Management Market Revenue (Million) Forecast, by Application 2019 & 2032
- Table 62: Japan Construction Waste Management Market Volume (Billion) Forecast, by Application 2019 & 2032
- Table 63: Australia Construction Waste Management Market Revenue (Million) Forecast, by Application 2019 & 2032
- Table 64: Australia Construction Waste Management Market Volume (Billion) Forecast, by Application 2019 & 2032
- Table 65: Rest of Asia Pacific Construction Waste Management Market Revenue (Million) Forecast, by Application 2019 & 2032
- Table 66: Rest of Asia Pacific Construction Waste Management Market Volume (Billion) Forecast, by Application 2019 & 2032
- Table 67: Global Construction Waste Management Market Revenue Million Forecast, by Waste Type 2019 & 2032
- Table 68: Global Construction Waste Management Market Volume Billion Forecast, by Waste Type 2019 & 2032
- Table 69: Global Construction Waste Management Market Revenue Million Forecast, by Source 2019 & 2032
- Table 70: Global Construction Waste Management Market Volume Billion Forecast, by Source 2019 & 2032
- Table 71: Global Construction Waste Management Market Revenue Million Forecast, by Material 2019 & 2032
- Table 72: Global Construction Waste Management Market Volume Billion Forecast, by Material 2019 & 2032
- Table 73: Global Construction Waste Management Market Revenue Million Forecast, by Country 2019 & 2032
- Table 74: Global Construction Waste Management Market Volume Billion Forecast, by Country 2019 & 2032
- Table 75: Brazil Construction Waste Management Market Revenue (Million) Forecast, by Application 2019 & 2032
- Table 76: Brazil Construction Waste Management Market Volume (Billion) Forecast, by Application 2019 & 2032
- Table 77: Argentina Construction Waste Management Market Revenue (Million) Forecast, by Application 2019 & 2032
- Table 78: Argentina Construction Waste Management Market Volume (Billion) Forecast, by Application 2019 & 2032
- Table 79: Rest of South America Construction Waste Management Market Revenue (Million) Forecast, by Application 2019 & 2032
- Table 80: Rest of South America Construction Waste Management Market Volume (Billion) Forecast, by Application 2019 & 2032
- Table 81: Global Construction Waste Management Market Revenue Million Forecast, by Waste Type 2019 & 2032
- Table 82: Global Construction Waste Management Market Volume Billion Forecast, by Waste Type 2019 & 2032
- Table 83: Global Construction Waste Management Market Revenue Million Forecast, by Source 2019 & 2032
- Table 84: Global Construction Waste Management Market Volume Billion Forecast, by Source 2019 & 2032
- Table 85: Global Construction Waste Management Market Revenue Million Forecast, by Material 2019 & 2032
- Table 86: Global Construction Waste Management Market Volume Billion Forecast, by Material 2019 & 2032
- Table 87: Global Construction Waste Management Market Revenue Million Forecast, by Country 2019 & 2032
- Table 88: Global Construction Waste Management Market Volume Billion Forecast, by Country 2019 & 2032
- Table 89: United Arab Emirates Construction Waste Management Market Revenue (Million) Forecast, by Application 2019 & 2032
- Table 90: United Arab Emirates Construction Waste Management Market Volume (Billion) Forecast, by Application 2019 & 2032
- Table 91: South Africa Construction Waste Management Market Revenue (Million) Forecast, by Application 2019 & 2032
- Table 92: South Africa Construction Waste Management Market Volume (Billion) Forecast, by Application 2019 & 2032
- Table 93: Rest of Middle East and Africa Construction Waste Management Market Revenue (Million) Forecast, by Application 2019 & 2032
- Table 94: Rest of Middle East and Africa Construction Waste Management Market Volume (Billion) Forecast, by Application 2019 & 2032
Frequently Asked Questions
1. What is the projected Compound Annual Growth Rate (CAGR) of the Construction Waste Management Market?
The projected CAGR is approximately 5.92%.
2. Which companies are prominent players in the Construction Waste Management Market?
Key companies in the market include Waste Management, Veolia Environment, Clean Harbors, Republic Services, Advanced Disposal Services, Biffa, Covanta Holding, Daiseki, Hitachi Zosen6 3 Other Companies.
3. What are the main segments of the Construction Waste Management Market?
The market segments include Waste Type, Source, Material.
4. Can you provide details about the market size?
The market size is estimated to be USD 8.29 Million as of 2022.
5. What are some drivers contributing to market growth?
4.; Urbanization and Population Growth Driving the Market4.; Economic Growth Driving the Market.
6. What are the notable trends driving market growth?
Residential Construction Waste Holds a Significant Share of the Market.
7. Are there any restraints impacting market growth?
4.; Urbanization and Population Growth Driving the Market4.; Economic Growth Driving the Market.
8. Can you provide examples of recent developments in the market?
July 2024: Sortera, a leader in recycling and processing residual products from the building and construction industries in Northern Europe, announced that it was bolstering its presence in Greater London's construction waste market through the acquisition of Reston Waste Management Ltd. Reston Waste stands out as one of South West London's prominent independent waste management firms.
9. What pricing options are available for accessing the report?
Pricing options include single-user, multi-user, and enterprise licenses priced at USD 4750, USD 5250, and USD 8750 respectively.
10. Is the market size provided in terms of value or volume?
The market size is provided in terms of value, measured in Million and volume, measured in Billion.
11. Are there any specific market keywords associated with the report?
Yes, the market keyword associated with the report is "Construction Waste Management Market," which aids in identifying and referencing the specific market segment covered.
12. How do I determine which pricing option suits my needs best?
The pricing options vary based on user requirements and access needs. Individual users may opt for single-user licenses, while businesses requiring broader access may choose multi-user or enterprise licenses for cost-effective access to the report.
13. Are there any additional resources or data provided in the Construction Waste Management Market report?
While the report offers comprehensive insights, it's advisable to review the specific contents or supplementary materials provided to ascertain if additional resources or data are available.
14. How can I stay updated on further developments or reports in the Construction Waste Management Market?
To stay informed about further developments, trends, and reports in the Construction Waste Management Market, consider subscribing to industry newsletters, following relevant companies and organizations, or regularly checking reputable industry news sources and publications.
Methodology
Step 1 - Identification of Relevant Samples Size from Population Database


Step 2 - Approaches for Defining Global Market Size (Value, Volume* & Price*)

Note*: In applicable scenarios
Step 3 - Data Sources
Primary Research
- Web Analytics
- Survey Reports
- Research Institute
- Latest Research Reports
- Opinion Leaders
Secondary Research
- Annual Reports
- White Paper
- Latest Press Release
- Industry Association
- Paid Database
- Investor Presentations

Step 4 - Data Triangulation
Involves using different sources of information in order to increase the validity of a study
These sources are likely to be stakeholders in a program - participants, other researchers, program staff, other community members, and so on.
Then we put all data in single framework & apply various statistical tools to find out the dynamic on the market.
During the analysis stage, feedback from the stakeholder groups would be compared to determine areas of agreement as well as areas of divergence


