

Key Insights
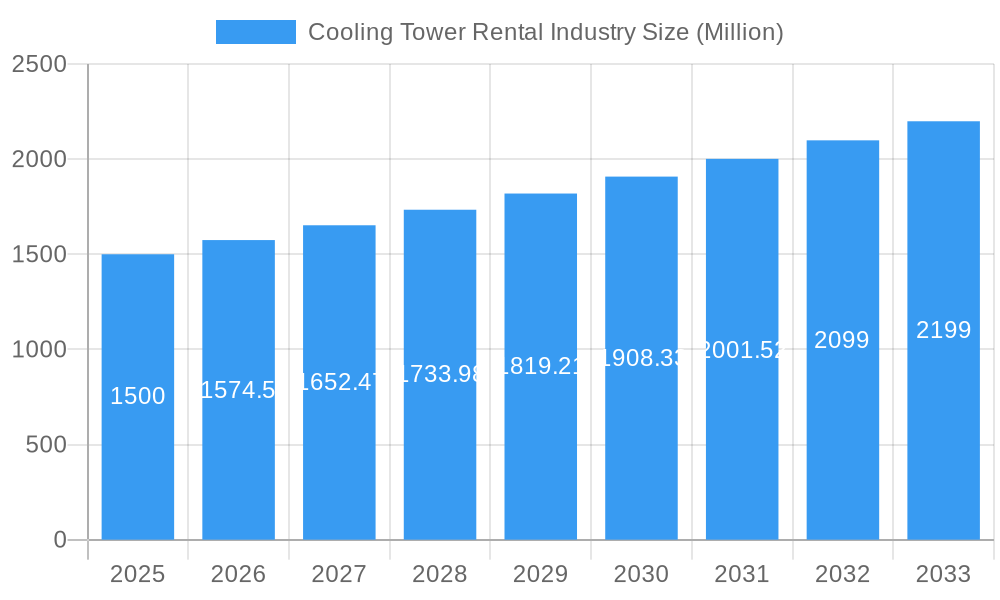
The global cooling tower rental market is projected for substantial expansion, driven by increasing industrial and commercial demand. With a projected Compound Annual Growth Rate (CAGR) of 6.2%, the market is anticipated to reach a size of 1.39 billion by 2025. Key growth drivers include the rising needs of sectors such as manufacturing, power generation, and data centers, where flexibility and cost-effectiveness make rental solutions highly attractive. Temporary projects, construction, and industrial applications also leverage rented cooling towers for essential thermal management. Furthermore, a growing emphasis on environmental sustainability and energy-efficient cooling technologies is accelerating adoption through rental services. The market exhibits diverse segmentation across tower types and end-user applications, indicating broad market appeal and resilience. Key players like SPX Cooling Technologies and Johnson Controls, alongside agile smaller providers, shape the competitive landscape. Significant growth opportunities are identified in North America and Asia-Pacific, fueled by industrial expansion and urbanization.
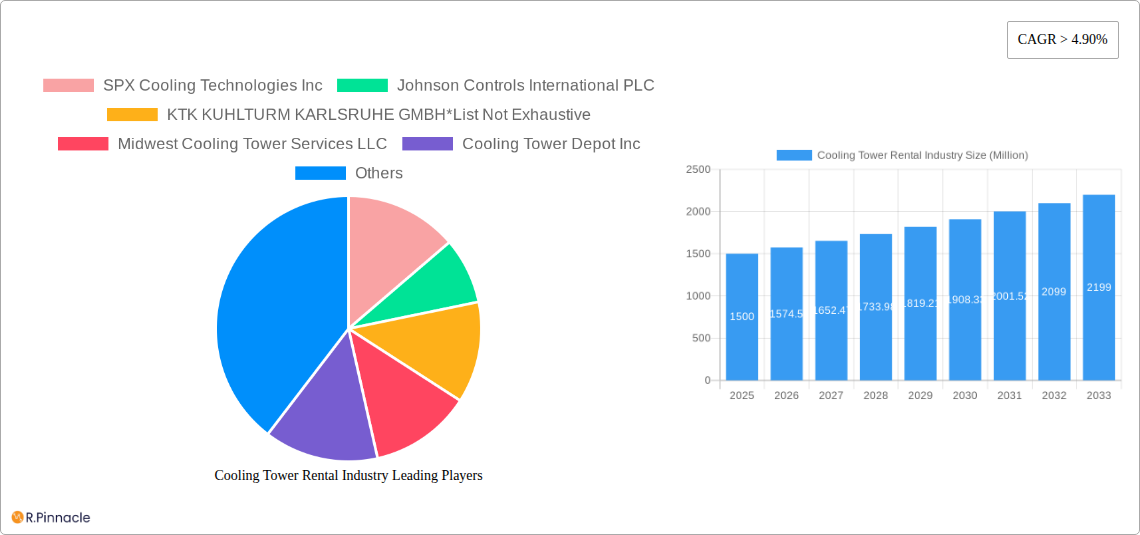
Cooling Tower Rental Industry Market Size (In Billion)
The market is set for continued growth, supported by the demand for temporary cooling solutions and the trend towards modular, deployable systems. Renting offers a compelling alternative to capital expenditure, optimizing operational costs. While raw material price volatility and economic slowdowns present potential restraints, the overall positive outlook for global industrial and commercial expansion positions the cooling tower rental market for significant future growth. Technological advancements focused on energy efficiency and reduced environmental impact will further propel market expansion and innovation.
Cooling Tower Rental Industry Company Market Share
Cooling Tower Rental Industry Market Report: 2019-2033
This comprehensive report provides a detailed analysis of the Cooling Tower Rental Industry, projecting a market valued at $XX Million by 2033. The report covers the period 2019-2033, with a focus on the forecast period 2025-2033 and a base year of 2025. It offers invaluable insights for industry professionals, investors, and strategic decision-makers seeking to navigate this dynamic market.
Cooling Tower Rental Industry Market Structure & Innovation Trends
This section analyzes the competitive landscape, encompassing market concentration, innovation drivers, regulatory frameworks, product substitutes, end-user demographics, and mergers & acquisitions (M&A) activities within the cooling tower rental market. The report delves into the market share held by key players such as SPX Cooling Technologies Inc, Johnson Controls International PLC, and KTK KUHLTURM KARLSRUHE GMBH, amongst others. We examine the impact of M&A activities, including deal values and their influence on market consolidation and innovation. The analysis also considers the influence of regulatory frameworks on market growth and the emergence of substitute technologies. Further, a detailed breakdown of end-user demographics across commercial and industrial sectors provides a granular understanding of market demand. The estimated total market size for 2025 is $XX Million, with a projected CAGR of XX% during the forecast period.
Cooling Tower Rental Industry Market Dynamics & Trends
This section explores the key factors shaping the cooling tower rental market's growth trajectory. We analyze market growth drivers, technological disruptions (including advancements in energy efficiency and automation), evolving consumer preferences (such as demand for sustainable solutions), and the intense competitive dynamics amongst market players. The analysis includes a detailed examination of the Compound Annual Growth Rate (CAGR) and market penetration rates for various cooling tower types and end-user segments. The report incorporates qualitative and quantitative data to offer a comprehensive understanding of market dynamics and future trends, highlighting the influence of factors like changing climate patterns and industrial expansion on demand.
Dominant Regions & Segments in Cooling Tower Rental Industry
This section identifies the leading geographical regions and market segments within the cooling tower rental industry. The report will pinpoint the dominant region(s) and country(ies), offering in-depth analysis of their market share and growth drivers. Further, it delves into the performance of different segments based on cooling tower type (Wet, Dry, Hybrid) and end-user (Commercial, Industrial).
Key Drivers for Dominant Regions:
- Favorable economic policies
- Robust infrastructure development
- High industrial activity
- Government initiatives promoting energy efficiency
Key Drivers for Dominant Segments:
- Growing demand from specific industries (e.g., power generation, manufacturing)
- Technological advancements in specific cooling tower types
- Cost-effectiveness and operational advantages
The analysis will present a comprehensive overview of the factors contributing to the dominance of specific regions and segments, providing actionable insights for strategic market entry and expansion.
Cooling Tower Rental Industry Product Innovations
This section summarizes recent product developments, focusing on technological advancements and their market acceptance. The report highlights innovative features, applications, and competitive advantages of new cooling tower rental solutions, emphasizing the role of technology in driving efficiency, reducing environmental impact, and improving overall performance. The analysis includes an assessment of the market fit of these innovations and their potential to disrupt the existing market dynamics.
Report Scope & Segmentation Analysis
This section outlines the market segmentation and scope of the report. Each segment is analyzed in terms of growth projections, market size, and competitive dynamics.
By Type:
- Wet Cooling Towers: This segment’s analysis will cover market size, growth rate, and competitive landscape.
- Dry Cooling Towers: This segment’s analysis will cover market size, growth rate, and competitive landscape.
- Hybrid Cooling Towers: This segment’s analysis will cover market size, growth rate, and competitive landscape.
By End-User:
- Commercial: This segment’s analysis will cover market size, growth rate, and competitive landscape.
- Industrial: This segment’s analysis will cover market size, growth rate, and competitive landscape.
Key Drivers of Cooling Tower Rental Industry Growth
The growth of the cooling tower rental industry is driven by a confluence of factors. These include technological advancements leading to greater energy efficiency and reduced operational costs, strong economic growth fueling industrial expansion and infrastructure development, and supportive government regulations promoting energy conservation and environmental sustainability.
Challenges in the Cooling Tower Rental Industry Sector
The cooling tower rental industry faces various challenges. These include stringent regulatory hurdles related to environmental protection, potential supply chain disruptions impacting the availability of components and skilled labor, and intense competitive pressure from established players and emerging entrants. These challenges can significantly impact market growth and profitability.
Emerging Opportunities in Cooling Tower Rental Industry
Despite the challenges, the cooling tower rental industry presents several exciting opportunities. These include the expansion into new geographic markets, the development and adoption of innovative technologies focused on energy efficiency and sustainability, and the catering to the increasing demand from emerging industries such as data centers and renewable energy.
Leading Players in the Cooling Tower Rental Industry Market
- SPX Cooling Technologies Inc
- Johnson Controls International PLC
- KTK KUHLTURM KARLSRUHE GMBH
- Midwest Cooling Tower Services LLC
- Cooling Tower Depot Inc
- Caterpillar Inc
- Aggreko PLC
- Baltimore Aircoil Co
- Carrier Rental Systems Inc
- United Rentals Inc
Key Developments in Cooling Tower Rental Industry Industry
- 2020 Q2: COVID-19 pandemic significantly impacted demand due to refinery shutdowns and reduced industrial activity.
- 2021 Q4: Increased investment in renewable energy projects boosted demand for cooling tower rentals.
- 2022 Q3: Several key players announced strategic partnerships to expand their service offerings and geographic reach. (Further details on specific partnerships would be included in the full report)
- 2023 Q1: Launch of new energy-efficient cooling tower models by major manufacturers. (Further details on specific product launches would be included in the full report)
Future Outlook for Cooling Tower Rental Industry Market
The cooling tower rental market is poised for robust growth in the coming years. Driving this growth are several factors including the increasing adoption of energy-efficient technologies, expansion of industrial activities across several sectors, and government support for sustainable infrastructure development. Strategic partnerships, innovative product launches, and expansion into new geographical regions are likely to shape the future landscape of the cooling tower rental industry.
Cooling Tower Rental Industry Segmentation
-
1. Type
- 1.1. Wet
- 1.2. Dry
- 1.3. Hybrid
-
2. End User
- 2.1. Commercial
- 2.2. Industrial
Cooling Tower Rental Industry Segmentation By Geography
- 1. North America
- 2. Europe
- 3. Asia Pacific
- 4. Middle East and Africa
- 5. South America
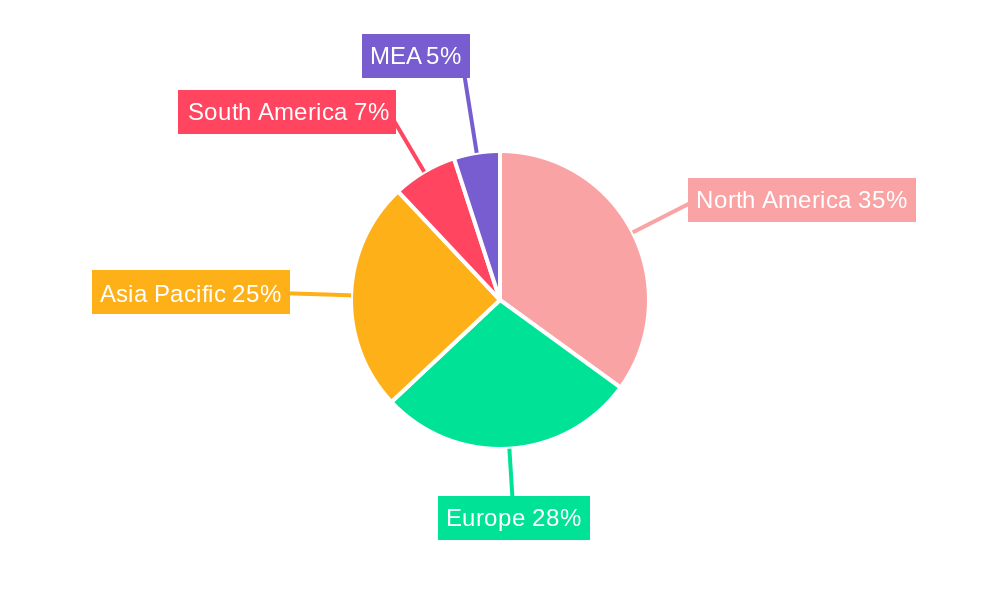
Cooling Tower Rental Industry Regional Market Share
Geographic Coverage of Cooling Tower Rental Industry
Cooling Tower Rental Industry REPORT HIGHLIGHTS
| Aspects | Details |
|---|---|
| Study Period | 2020-2034 |
| Base Year | 2025 |
| Estimated Year | 2026 |
| Forecast Period | 2026-2034 |
| Historical Period | 2020-2025 |
| Growth Rate | CAGR of 6.2% from 2020-2034 |
| Segmentation |
|
Table of Contents
- 1. Introduction
- 1.1. Research Scope
- 1.2. Market Segmentation
- 1.3. Research Objective
- 1.4. Definitions and Assumptions
- 2. Executive Summary
- 2.1. Market Snapshot
- 3. Market Dynamics
- 3.1. Market Drivers
- 3.2. Market Restrains
- 3.3. Market Trends
- 3.4. Market Opportunities
- 4. Market Factor Analysis
- 4.1. Porters Five Forces
- 4.1.1. Bargaining Power of Suppliers
- 4.1.2. Bargaining Power of Buyers
- 4.1.3. Threat of New Entrants
- 4.1.4. Threat of Substitutes
- 4.1.5. Competitive Rivalry
- 4.2. PESTEL analysis
- 4.3. BCG Analysis
- 4.3.1. Stars (High Growth, High Market Share)
- 4.3.2. Cash Cows (Low Growth, High Market Share)
- 4.3.3. Question Mark (High Growth, Low Market Share)
- 4.3.4. Dogs (Low Growth, Low Market Share)
- 4.4. Ansoff Matrix Analysis
- 4.5. Supply Chain Analysis
- 4.6. Regulatory Landscape
- 4.7. Current Market Potential and Opportunity Assessment (TAM–SAM–SOM Framework)
- 4.8. PRI Analyst Note
- 4.1. Porters Five Forces
- 5. Market Analysis, Insights and Forecast 2021-2033
- 5.1. Market Analysis, Insights and Forecast - by Type
- 5.1.1. Wet
- 5.1.2. Dry
- 5.1.3. Hybrid
- 5.2. Market Analysis, Insights and Forecast - by End User
- 5.2.1. Commercial
- 5.2.2. Industrial
- 5.3. Market Analysis, Insights and Forecast - by Region
- 5.3.1. North America
- 5.3.2. Europe
- 5.3.3. Asia Pacific
- 5.3.4. Middle East and Africa
- 5.3.5. South America
- 5.1. Market Analysis, Insights and Forecast - by Type
- 6. Global Cooling Tower Rental Industry Analysis, Insights and Forecast, 2021-2033
- 6.1. Market Analysis, Insights and Forecast - by Type
- 6.1.1. Wet
- 6.1.2. Dry
- 6.1.3. Hybrid
- 6.2. Market Analysis, Insights and Forecast - by End User
- 6.2.1. Commercial
- 6.2.2. Industrial
- 6.1. Market Analysis, Insights and Forecast - by Type
- 7. North America Cooling Tower Rental Industry Analysis, Insights and Forecast, 2020-2032
- 7.1. Market Analysis, Insights and Forecast - by Type
- 7.1.1. Wet
- 7.1.2. Dry
- 7.1.3. Hybrid
- 7.2. Market Analysis, Insights and Forecast - by End User
- 7.2.1. Commercial
- 7.2.2. Industrial
- 7.1. Market Analysis, Insights and Forecast - by Type
- 8. Europe Cooling Tower Rental Industry Analysis, Insights and Forecast, 2020-2032
- 8.1. Market Analysis, Insights and Forecast - by Type
- 8.1.1. Wet
- 8.1.2. Dry
- 8.1.3. Hybrid
- 8.2. Market Analysis, Insights and Forecast - by End User
- 8.2.1. Commercial
- 8.2.2. Industrial
- 8.1. Market Analysis, Insights and Forecast - by Type
- 9. Asia Pacific Cooling Tower Rental Industry Analysis, Insights and Forecast, 2020-2032
- 9.1. Market Analysis, Insights and Forecast - by Type
- 9.1.1. Wet
- 9.1.2. Dry
- 9.1.3. Hybrid
- 9.2. Market Analysis, Insights and Forecast - by End User
- 9.2.1. Commercial
- 9.2.2. Industrial
- 9.1. Market Analysis, Insights and Forecast - by Type
- 10. Middle East and Africa Cooling Tower Rental Industry Analysis, Insights and Forecast, 2020-2032
- 10.1. Market Analysis, Insights and Forecast - by Type
- 10.1.1. Wet
- 10.1.2. Dry
- 10.1.3. Hybrid
- 10.2. Market Analysis, Insights and Forecast - by End User
- 10.2.1. Commercial
- 10.2.2. Industrial
- 10.1. Market Analysis, Insights and Forecast - by Type
- 11. South America Cooling Tower Rental Industry Analysis, Insights and Forecast, 2020-2032
- 11.1. Market Analysis, Insights and Forecast - by Type
- 11.1.1. Wet
- 11.1.2. Dry
- 11.1.3. Hybrid
- 11.2. Market Analysis, Insights and Forecast - by End User
- 11.2.1. Commercial
- 11.2.2. Industrial
- 11.1. Market Analysis, Insights and Forecast - by Type
- 12. Competitive Analysis
- 12.1. Company Profiles
- 12.1.1 SPX Cooling Technologies Inc
- 12.1.1.1. Company Overview
- 12.1.1.2. Products
- 12.1.1.3. Company Financials
- 12.1.1.4. SWOT Analysis
- 12.1.2 Johnson Controls International PLC
- 12.1.2.1. Company Overview
- 12.1.2.2. Products
- 12.1.2.3. Company Financials
- 12.1.2.4. SWOT Analysis
- 12.1.3 KTK KUHLTURM KARLSRUHE GMBH*List Not Exhaustive
- 12.1.3.1. Company Overview
- 12.1.3.2. Products
- 12.1.3.3. Company Financials
- 12.1.3.4. SWOT Analysis
- 12.1.4 Midwest Cooling Tower Services LLC
- 12.1.4.1. Company Overview
- 12.1.4.2. Products
- 12.1.4.3. Company Financials
- 12.1.4.4. SWOT Analysis
- 12.1.5 Cooling Tower Depot Inc
- 12.1.5.1. Company Overview
- 12.1.5.2. Products
- 12.1.5.3. Company Financials
- 12.1.5.4. SWOT Analysis
- 12.1.6 Caterpillar Inc
- 12.1.6.1. Company Overview
- 12.1.6.2. Products
- 12.1.6.3. Company Financials
- 12.1.6.4. SWOT Analysis
- 12.1.7 Aggreko PLC
- 12.1.7.1. Company Overview
- 12.1.7.2. Products
- 12.1.7.3. Company Financials
- 12.1.7.4. SWOT Analysis
- 12.1.8 Baltimore Aircoil Co
- 12.1.8.1. Company Overview
- 12.1.8.2. Products
- 12.1.8.3. Company Financials
- 12.1.8.4. SWOT Analysis
- 12.1.9 Carrier Rental Systems Inc
- 12.1.9.1. Company Overview
- 12.1.9.2. Products
- 12.1.9.3. Company Financials
- 12.1.9.4. SWOT Analysis
- 12.1.10 United Rentals Inc
- 12.1.10.1. Company Overview
- 12.1.10.2. Products
- 12.1.10.3. Company Financials
- 12.1.10.4. SWOT Analysis
- 12.1.1 SPX Cooling Technologies Inc
- 12.2. Market Entropy
- 12.2.1 Company's Key Areas Served
- 12.2.2 Recent Developments
- 12.3. Company Market Share Analysis 2025
- 12.3.1 Top 5 Companies Market Share Analysis
- 12.3.2 Top 3 Companies Market Share Analysis
- 12.4. List of Potential Customers
- 13. Research Methodology
List of Figures
- Figure 1: Global Cooling Tower Rental Industry Revenue Breakdown (billion, %) by Region 2025 & 2033
- Figure 2: North America Cooling Tower Rental Industry Revenue (billion), by Type 2025 & 2033
- Figure 3: North America Cooling Tower Rental Industry Revenue Share (%), by Type 2025 & 2033
- Figure 4: North America Cooling Tower Rental Industry Revenue (billion), by End User 2025 & 2033
- Figure 5: North America Cooling Tower Rental Industry Revenue Share (%), by End User 2025 & 2033
- Figure 6: North America Cooling Tower Rental Industry Revenue (billion), by Country 2025 & 2033
- Figure 7: North America Cooling Tower Rental Industry Revenue Share (%), by Country 2025 & 2033
- Figure 8: Europe Cooling Tower Rental Industry Revenue (billion), by Type 2025 & 2033
- Figure 9: Europe Cooling Tower Rental Industry Revenue Share (%), by Type 2025 & 2033
- Figure 10: Europe Cooling Tower Rental Industry Revenue (billion), by End User 2025 & 2033
- Figure 11: Europe Cooling Tower Rental Industry Revenue Share (%), by End User 2025 & 2033
- Figure 12: Europe Cooling Tower Rental Industry Revenue (billion), by Country 2025 & 2033
- Figure 13: Europe Cooling Tower Rental Industry Revenue Share (%), by Country 2025 & 2033
- Figure 14: Asia Pacific Cooling Tower Rental Industry Revenue (billion), by Type 2025 & 2033
- Figure 15: Asia Pacific Cooling Tower Rental Industry Revenue Share (%), by Type 2025 & 2033
- Figure 16: Asia Pacific Cooling Tower Rental Industry Revenue (billion), by End User 2025 & 2033
- Figure 17: Asia Pacific Cooling Tower Rental Industry Revenue Share (%), by End User 2025 & 2033
- Figure 18: Asia Pacific Cooling Tower Rental Industry Revenue (billion), by Country 2025 & 2033
- Figure 19: Asia Pacific Cooling Tower Rental Industry Revenue Share (%), by Country 2025 & 2033
- Figure 20: Middle East and Africa Cooling Tower Rental Industry Revenue (billion), by Type 2025 & 2033
- Figure 21: Middle East and Africa Cooling Tower Rental Industry Revenue Share (%), by Type 2025 & 2033
- Figure 22: Middle East and Africa Cooling Tower Rental Industry Revenue (billion), by End User 2025 & 2033
- Figure 23: Middle East and Africa Cooling Tower Rental Industry Revenue Share (%), by End User 2025 & 2033
- Figure 24: Middle East and Africa Cooling Tower Rental Industry Revenue (billion), by Country 2025 & 2033
- Figure 25: Middle East and Africa Cooling Tower Rental Industry Revenue Share (%), by Country 2025 & 2033
- Figure 26: South America Cooling Tower Rental Industry Revenue (billion), by Type 2025 & 2033
- Figure 27: South America Cooling Tower Rental Industry Revenue Share (%), by Type 2025 & 2033
- Figure 28: South America Cooling Tower Rental Industry Revenue (billion), by End User 2025 & 2033
- Figure 29: South America Cooling Tower Rental Industry Revenue Share (%), by End User 2025 & 2033
- Figure 30: South America Cooling Tower Rental Industry Revenue (billion), by Country 2025 & 2033
- Figure 31: South America Cooling Tower Rental Industry Revenue Share (%), by Country 2025 & 2033
List of Tables
- Table 1: Global Cooling Tower Rental Industry Revenue billion Forecast, by Type 2020 & 2033
- Table 2: Global Cooling Tower Rental Industry Revenue billion Forecast, by End User 2020 & 2033
- Table 3: Global Cooling Tower Rental Industry Revenue billion Forecast, by Region 2020 & 2033
- Table 4: Global Cooling Tower Rental Industry Revenue billion Forecast, by Type 2020 & 2033
- Table 5: Global Cooling Tower Rental Industry Revenue billion Forecast, by End User 2020 & 2033
- Table 6: Global Cooling Tower Rental Industry Revenue billion Forecast, by Country 2020 & 2033
- Table 7: Global Cooling Tower Rental Industry Revenue billion Forecast, by Type 2020 & 2033
- Table 8: Global Cooling Tower Rental Industry Revenue billion Forecast, by End User 2020 & 2033
- Table 9: Global Cooling Tower Rental Industry Revenue billion Forecast, by Country 2020 & 2033
- Table 10: Global Cooling Tower Rental Industry Revenue billion Forecast, by Type 2020 & 2033
- Table 11: Global Cooling Tower Rental Industry Revenue billion Forecast, by End User 2020 & 2033
- Table 12: Global Cooling Tower Rental Industry Revenue billion Forecast, by Country 2020 & 2033
- Table 13: Global Cooling Tower Rental Industry Revenue billion Forecast, by Type 2020 & 2033
- Table 14: Global Cooling Tower Rental Industry Revenue billion Forecast, by End User 2020 & 2033
- Table 15: Global Cooling Tower Rental Industry Revenue billion Forecast, by Country 2020 & 2033
- Table 16: Global Cooling Tower Rental Industry Revenue billion Forecast, by Type 2020 & 2033
- Table 17: Global Cooling Tower Rental Industry Revenue billion Forecast, by End User 2020 & 2033
- Table 18: Global Cooling Tower Rental Industry Revenue billion Forecast, by Country 2020 & 2033
Frequently Asked Questions
1. What is the projected Compound Annual Growth Rate (CAGR) of the Cooling Tower Rental Industry?
The projected CAGR is approximately 6.2%.
2. Which companies are prominent players in the Cooling Tower Rental Industry?
Key companies in the market include SPX Cooling Technologies Inc, Johnson Controls International PLC, KTK KUHLTURM KARLSRUHE GMBH*List Not Exhaustive, Midwest Cooling Tower Services LLC, Cooling Tower Depot Inc, Caterpillar Inc, Aggreko PLC, Baltimore Aircoil Co, Carrier Rental Systems Inc, United Rentals Inc.
3. What are the main segments of the Cooling Tower Rental Industry?
The market segments include Type, End User.
4. Can you provide details about the market size?
The market size is estimated to be USD 1.39 billion as of 2022.
5. What are some drivers contributing to market growth?
4.; Favorable Government Policies.
6. What are the notable trends driving market growth?
Industrial Segment to Dominate the Market.
7. Are there any restraints impacting market growth?
4.; Rising Emphasis on Other Alternative Clean Energy Sources.
8. Can you provide examples of recent developments in the market?
Restrictions and impacts related to COVID-19 significantly reduced activities like air travel and commuting. This reduced the demand for fuels for transportation, and the shutdown restrictions on refineries affected the downstream sector in 2020. Since cooling towers play a major role in refinery operations, the shutdowns and reduced production rates affected the market for cooling tower rental.
9. What pricing options are available for accessing the report?
Pricing options include single-user, multi-user, and enterprise licenses priced at USD 4750, USD 5250, and USD 8750 respectively.
10. Is the market size provided in terms of value or volume?
The market size is provided in terms of value, measured in billion.
11. Are there any specific market keywords associated with the report?
Yes, the market keyword associated with the report is "Cooling Tower Rental Industry," which aids in identifying and referencing the specific market segment covered.
12. How do I determine which pricing option suits my needs best?
The pricing options vary based on user requirements and access needs. Individual users may opt for single-user licenses, while businesses requiring broader access may choose multi-user or enterprise licenses for cost-effective access to the report.
13. Are there any additional resources or data provided in the Cooling Tower Rental Industry report?
While the report offers comprehensive insights, it's advisable to review the specific contents or supplementary materials provided to ascertain if additional resources or data are available.
14. How can I stay updated on further developments or reports in the Cooling Tower Rental Industry?
To stay informed about further developments, trends, and reports in the Cooling Tower Rental Industry, consider subscribing to industry newsletters, following relevant companies and organizations, or regularly checking reputable industry news sources and publications.
Methodology
Step 1 - Identification of Relevant Samples Size from Population Database


Step 2 - Approaches for Defining Global Market Size (Value, Volume* & Price*)

Note*: In applicable scenarios
Step 3 - Data Sources
Primary Research
- Web Analytics
- Survey Reports
- Research Institute
- Latest Research Reports
- Opinion Leaders
Secondary Research
- Annual Reports
- White Paper
- Latest Press Release
- Industry Association
- Paid Database
- Investor Presentations

Step 4 - Data Triangulation
Involves using different sources of information in order to increase the validity of a study
These sources are likely to be stakeholders in a program - participants, other researchers, program staff, other community members, and so on.
Then we put all data in single framework & apply various statistical tools to find out the dynamic on the market.
During the analysis stage, feedback from the stakeholder groups would be compared to determine areas of agreement as well as areas of divergence