

Key Insights
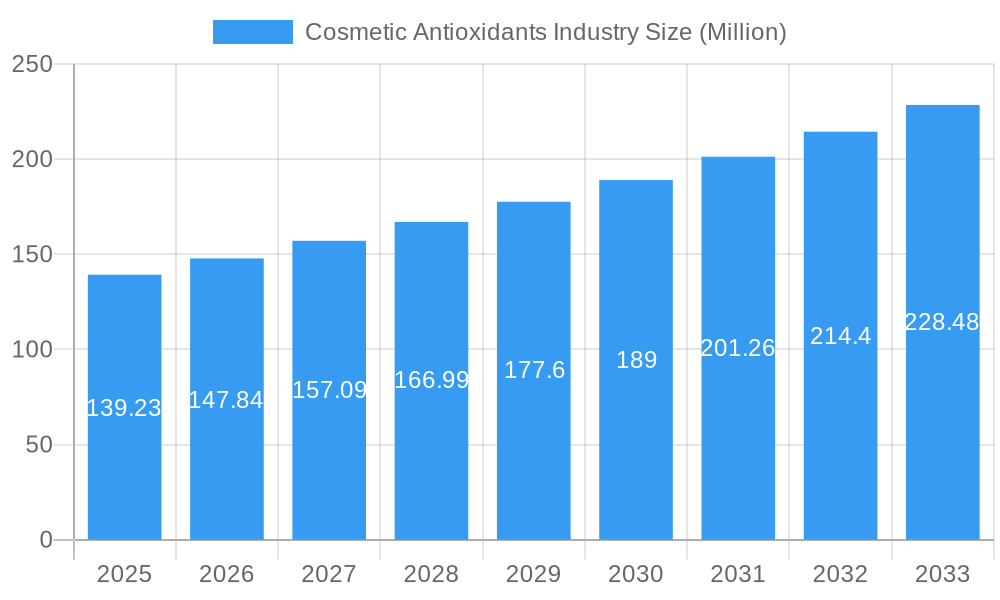
The global cosmetic antioxidants market, valued at $139.23 million in 2025, is projected to experience robust growth, driven by increasing consumer awareness of skincare benefits and the rising demand for natural and sustainable beauty products. A compound annual growth rate (CAGR) of 5.95% from 2025 to 2033 suggests a significant market expansion. Key drivers include the growing prevalence of skin aging concerns, the increasing popularity of anti-aging cosmetics, and a rising preference for products with scientifically proven efficacy. The market is segmented by source (natural and chemically derived), type (vitamins, polyphenols, enzymes, carotenoids, and others), and application (skincare, haircare, injectables, and others). Natural antioxidants are gaining traction due to consumer preference for cleaner, eco-friendly products. Within types, vitamins and polyphenols are currently dominant but carotenoids and other specialized antioxidants are showing strong growth potential due to their unique properties and benefits. Regions like Asia-Pacific, particularly China and India, are expected to witness substantial growth due to rising disposable incomes and increasing adoption of beauty and personal care products. However, potential restraints include fluctuations in raw material prices and stringent regulations governing the use of certain cosmetic ingredients. Major players such as DSM, Lonza, Kemin Industries, and Evonik are actively involved in research and development, leading to innovation in antioxidant formulations and delivery systems. The market's future trajectory is positive, promising continuous growth and innovation in response to evolving consumer demands and technological advancements.
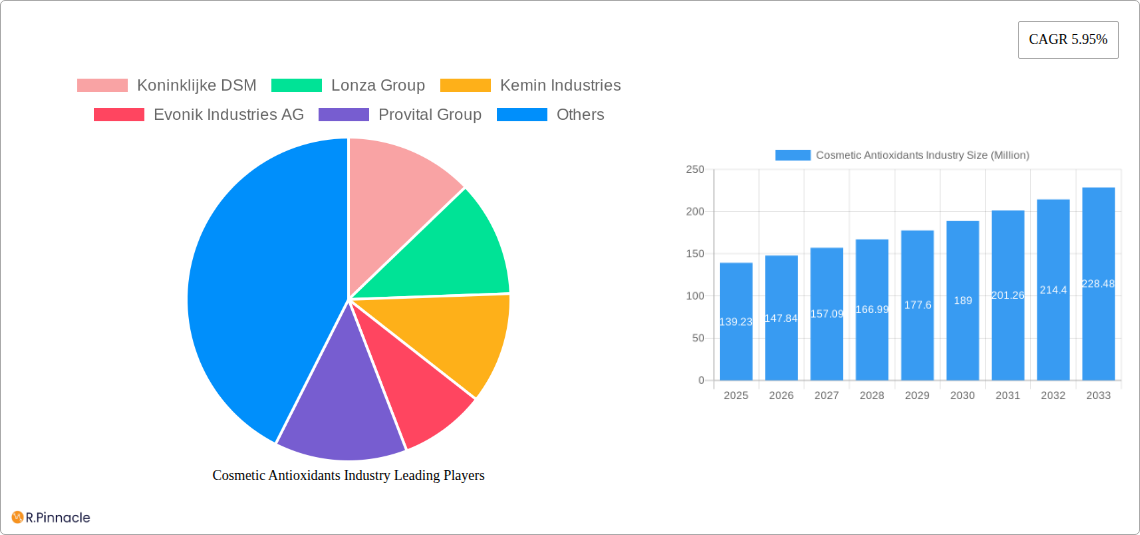
Cosmetic Antioxidants Industry Market Size (In Million)
The competitive landscape is characterized by both large multinational corporations and specialized ingredient suppliers. Strategic partnerships, mergers, and acquisitions are expected to shape the market further. The focus on sustainable and ethical sourcing of raw materials is likely to gain significant importance, impacting supply chains and product development. Future market growth will be fueled by advancements in delivery technologies, the development of novel antioxidant compounds with enhanced efficacy, and the expansion into new application areas. Furthermore, the increasing demand for personalized skincare solutions will drive the development of customized antioxidant products targeting specific skin conditions and consumer needs. The continuing trend towards clean beauty will drive demand for natural antioxidants specifically.
Cosmetic Antioxidants Industry Company Market Share
Cosmetic Antioxidants Industry Market Report: 2019-2033
This comprehensive report provides an in-depth analysis of the global cosmetic antioxidants market, offering invaluable insights for industry professionals, investors, and strategic decision-makers. The report covers the period 2019-2033, with a focus on the forecast period 2025-2033 and a base year of 2025. The market is segmented by source (natural, chemically derived), type (vitamins, polyphenols, enzymes, carotenoids, other types), and application (skin care, hair care, injectables, other applications). Key players analyzed include Koninklijke DSM, Lonza Group, Kemin Industries, Evonik Industries AG, Provital Group, Croda International Plc, BASF SE, Eastman Chemical Company, BTSA Biotecnologias Aplicadas, and Wacker Chemie AG (list not exhaustive). The total market value is projected to reach xx Million by 2033.
Cosmetic Antioxidants Industry Market Structure & Innovation Trends
The cosmetic antioxidants market exhibits a moderately concentrated structure, with a few large players holding significant market share. Koninklijke DSM and BASF SE are among the leading companies, estimated to collectively hold approximately xx% of the market share in 2025. Innovation is driven by consumer demand for natural and sustainable products, along with the need for enhanced efficacy and safety. Regulatory frameworks, particularly regarding the safety and labeling of cosmetic ingredients, significantly impact market dynamics. The industry sees increasing M&A activity, driven by companies seeking to expand their product portfolios and geographic reach. Recent deals have involved companies acquiring smaller, specialized firms with innovative technologies or strong regional presences. The average M&A deal value in the last 5 years has been approximately xx Million.
- Market Concentration: Moderately concentrated, with top players holding xx% market share (2025).
- Innovation Drivers: Consumer demand for natural and sustainable ingredients, enhanced efficacy, safety regulations.
- Regulatory Frameworks: Stringent regulations influence product development and labeling.
- Product Substitutes: Limited direct substitutes, but alternative preservation methods pose some competitive pressure.
- End-User Demographics: Primarily driven by the growing demand for anti-aging and skincare products among millennials and Gen Z.
- M&A Activity: Significant M&A activity, with an average deal value of xx Million over the past five years.
Cosmetic Antioxidants Industry Market Dynamics & Trends
The global cosmetic antioxidants market is experiencing robust growth, projected to register a CAGR of xx% during the forecast period (2025-2033). Several factors fuel this expansion, including the rising consumer awareness of skincare benefits, the increasing popularity of natural and organic cosmetics, and the growing demand for anti-aging products across various demographics. Technological advancements in extraction techniques and formulation technologies are enhancing the efficacy and stability of antioxidants. The market penetration of natural cosmetic antioxidants is steadily increasing, driven by consumer preference for eco-friendly and sustainable products. Competitive dynamics are shaped by continuous product innovation, strategic partnerships, and expansion into new markets. Market penetration for natural antioxidants is estimated at xx% in 2025, projected to reach xx% by 2033.
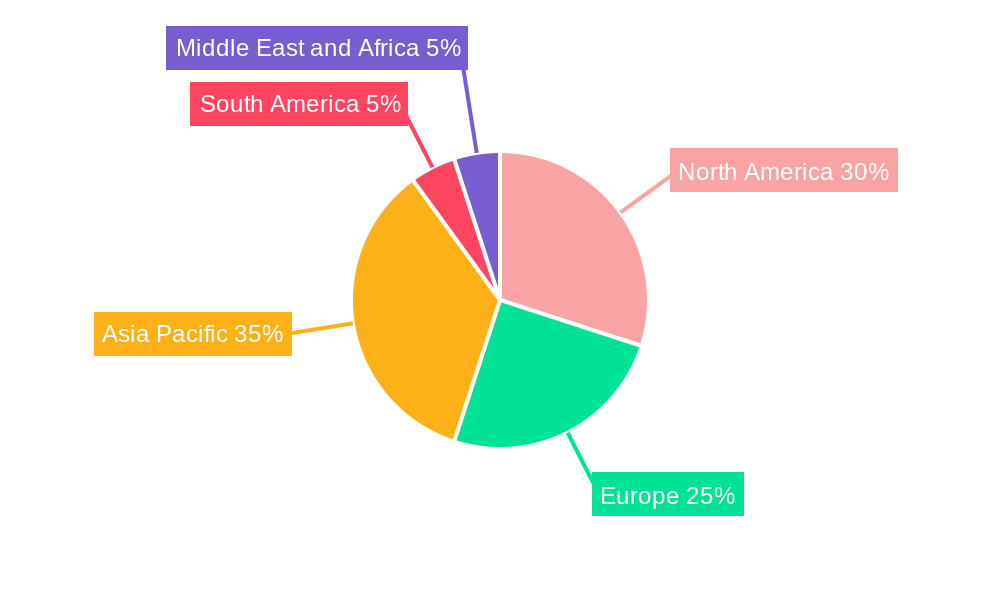
Dominant Regions & Segments in Cosmetic Antioxidants Industry
North America is currently the leading region in the cosmetic antioxidants market, driven by high consumer spending on personal care products, stringent regulatory standards, and a strong presence of major industry players. Within segments, the skin care application dominates, accounting for approximately xx% of the market in 2025, followed by hair care. Natural sources currently hold the largest market share among antioxidant sources, but chemically derived antioxidants maintain a significant presence, driven by cost-effectiveness and high availability. Vitamins and polyphenols are the most widely used types of antioxidants.
- Key Drivers in North America: High disposable incomes, strong consumer demand for skincare products, presence of key industry players.
- Skincare Application Dominance: Driven by increasing awareness of skin health and anti-aging benefits.
- Natural Source Preference: Growing consumer preference for sustainable and eco-friendly products.
- Vitamins and Polyphenols Leading Types: High efficacy and wide availability drive market share.
Cosmetic Antioxidants Industry Product Innovations
Recent innovations focus on developing more effective and stable antioxidant formulations with enhanced bioavailability and improved skin penetration. Nanotechnology plays a crucial role in improving the delivery systems of these antioxidants. The market is also seeing a surge in eco-friendly and sustainably sourced ingredients, including those certified organic or ethically sourced. These innovations cater to the rising consumer demand for sustainable and environmentally conscious products. Emphasis is on multifunctional antioxidants that offer multiple benefits, addressing several skin concerns simultaneously.
Report Scope & Segmentation Analysis
The report provides a comprehensive segmentation of the cosmetic antioxidants market by source (natural and chemically derived), type (vitamins, polyphenols, enzymes, carotenoids, and other types), and application (skincare, hair care, injectables, and other applications). Each segment's growth projections, market sizes for 2025 and 2033, and competitive dynamics are analyzed in detail. The skincare application segment is projected to maintain its dominance throughout the forecast period, with a significant CAGR of xx%. The natural sources segment is expected to witness faster growth compared to the chemically derived segment.
Key Drivers of Cosmetic Antioxidants Industry Growth
The cosmetic antioxidants market's growth is fueled by several key factors. The rising consumer awareness of the benefits of antioxidants in skincare and haircare is a primary driver. The increasing demand for natural and organic cosmetic products, coupled with advancements in extraction technologies and formulation techniques, is further accelerating market expansion. Stringent regulatory frameworks promoting the safety and efficacy of cosmetic ingredients also shape market growth. The growing aging population globally increases the demand for anti-aging products, boosting market expansion.
Challenges in the Cosmetic Antioxidants Industry Sector
The cosmetic antioxidants industry faces challenges, including fluctuating raw material prices and potential supply chain disruptions. Stringent regulatory compliance requirements necessitate significant investments in research and development and testing. Competitive pressure from both established players and new entrants necessitates continuous innovation and product differentiation to maintain market share. The market also experiences challenges in ensuring the authenticity and traceability of natural ingredients.
Emerging Opportunities in Cosmetic Antioxidants Industry
Emerging opportunities exist in developing novel antioxidant formulations with enhanced efficacy and stability. The growing demand for personalized skincare and cosmetic products presents opportunities for tailoring antioxidant formulations to specific skin types and concerns. Expanding into emerging markets with a growing consumer base and increasing disposable incomes offers significant potential. Utilizing sustainable and ethically sourced ingredients to cater to the increasing environmental awareness among consumers represents a significant opportunity.
Leading Players in the Cosmetic Antioxidants Industry Market
- Koninklijke DSM
- Lonza Group
- Kemin Industries
- Evonik Industries AG
- Provital Group
- Croda International Plc
- BASF SE
- Eastman Chemical Company
- BTSA Biotecnologias Aplicadas
- Wacker Chemie AG
Key Developments in Cosmetic Antioxidants Industry
- October 2023: BASF's Care Chemicals division invests in a new plant to produce emollient specialties for skin and sun protection products. This signifies a significant commitment to expanding its portfolio in the skincare sector.
- June 2023: DKSH signs an exclusive distribution agreement with Bitop for cosmetics ingredients in Australia, New Zealand, Malaysia, and Singapore. This expands Bitop's market reach and strengthens its distribution network in the Asia-Pacific region.
Future Outlook for Cosmetic Antioxidants Industry Market
The cosmetic antioxidants market is poised for continued growth, driven by evolving consumer preferences, technological advancements, and a rising demand for effective and sustainable skincare solutions. The focus on natural and sustainable ingredients, along with innovation in delivery systems and personalized formulations, will continue to shape the industry landscape. Strategic acquisitions and partnerships will also play a key role in determining market leadership and overall growth. The market is projected to witness a significant expansion, with substantial growth opportunities in various segments and regions.
Cosmetic Antioxidants Industry Segmentation
-
1. Source
- 1.1. Natural
- 1.2. Chemically Derived
-
2. Type
- 2.1. Vitamins
- 2.2. Polyphenols
- 2.3. Enzymes
- 2.4. Carotenoids
- 2.5. Other Ty
-
3. Application
- 3.1. Skin Care
- 3.2. Hair Care
- 3.3. Injectables
- 3.4. Other Applications (Makeup and Body care)
Cosmetic Antioxidants Industry Segmentation By Geography
-
1. Asia Pacific
- 1.1. China
- 1.2. India
- 1.3. Japan
- 1.4. South Korea
- 1.5. Rest of Asia Pacific
-
2. North America
- 2.1. United States
- 2.2. Canada
- 2.3. Mexico
-
3. Europe
- 3.1. Germany
- 3.2. United Kingdom
- 3.3. Italy
- 3.4. France
- 3.5. Rest of Europe
-
4. South America
- 4.1. Brazil
- 4.2. Argentina
- 4.3. Rest of South America
-
5. Middle East and Africa
- 5.1. Saudi Arabia
- 5.2. South Africa
- 5.3. Rest of Middle East and Africa
Cosmetic Antioxidants Industry Regional Market Share
Geographic Coverage of Cosmetic Antioxidants Industry
Cosmetic Antioxidants Industry REPORT HIGHLIGHTS
| Aspects | Details |
|---|---|
| Study Period | 2020-2034 |
| Base Year | 2025 |
| Estimated Year | 2026 |
| Forecast Period | 2026-2034 |
| Historical Period | 2020-2025 |
| Growth Rate | CAGR of 5.95% from 2020-2034 |
| Segmentation |
|
Table of Contents
- 1. Introduction
- 1.1. Research Scope
- 1.2. Market Segmentation
- 1.3. Research Objective
- 1.4. Definitions and Assumptions
- 2. Executive Summary
- 2.1. Market Snapshot
- 3. Market Dynamics
- 3.1. Market Drivers
- 3.2. Market Restrains
- 3.3. Market Trends
- 3.4. Market Opportunities
- 4. Market Factor Analysis
- 4.1. Porters Five Forces
- 4.1.1. Bargaining Power of Suppliers
- 4.1.2. Bargaining Power of Buyers
- 4.1.3. Threat of New Entrants
- 4.1.4. Threat of Substitutes
- 4.1.5. Competitive Rivalry
- 4.2. PESTEL analysis
- 4.3. BCG Analysis
- 4.3.1. Stars (High Growth, High Market Share)
- 4.3.2. Cash Cows (Low Growth, High Market Share)
- 4.3.3. Question Mark (High Growth, Low Market Share)
- 4.3.4. Dogs (Low Growth, Low Market Share)
- 4.4. Ansoff Matrix Analysis
- 4.5. Supply Chain Analysis
- 4.6. Regulatory Landscape
- 4.7. Current Market Potential and Opportunity Assessment (TAM–SAM–SOM Framework)
- 4.8. PRI Analyst Note
- 4.1. Porters Five Forces
- 5. Market Analysis, Insights and Forecast 2021-2033
- 5.1. Market Analysis, Insights and Forecast - by Source
- 5.1.1. Natural
- 5.1.2. Chemically Derived
- 5.2. Market Analysis, Insights and Forecast - by Type
- 5.2.1. Vitamins
- 5.2.2. Polyphenols
- 5.2.3. Enzymes
- 5.2.4. Carotenoids
- 5.2.5. Other Ty
- 5.3. Market Analysis, Insights and Forecast - by Application
- 5.3.1. Skin Care
- 5.3.2. Hair Care
- 5.3.3. Injectables
- 5.3.4. Other Applications (Makeup and Body care)
- 5.4. Market Analysis, Insights and Forecast - by Region
- 5.4.1. Asia Pacific
- 5.4.2. North America
- 5.4.3. Europe
- 5.4.4. South America
- 5.4.5. Middle East and Africa
- 5.1. Market Analysis, Insights and Forecast - by Source
- 6. Global Cosmetic Antioxidants Industry Analysis, Insights and Forecast, 2021-2033
- 6.1. Market Analysis, Insights and Forecast - by Source
- 6.1.1. Natural
- 6.1.2. Chemically Derived
- 6.2. Market Analysis, Insights and Forecast - by Type
- 6.2.1. Vitamins
- 6.2.2. Polyphenols
- 6.2.3. Enzymes
- 6.2.4. Carotenoids
- 6.2.5. Other Ty
- 6.3. Market Analysis, Insights and Forecast - by Application
- 6.3.1. Skin Care
- 6.3.2. Hair Care
- 6.3.3. Injectables
- 6.3.4. Other Applications (Makeup and Body care)
- 6.1. Market Analysis, Insights and Forecast - by Source
- 7. Asia Pacific Cosmetic Antioxidants Industry Analysis, Insights and Forecast, 2020-2032
- 7.1. Market Analysis, Insights and Forecast - by Source
- 7.1.1. Natural
- 7.1.2. Chemically Derived
- 7.2. Market Analysis, Insights and Forecast - by Type
- 7.2.1. Vitamins
- 7.2.2. Polyphenols
- 7.2.3. Enzymes
- 7.2.4. Carotenoids
- 7.2.5. Other Ty
- 7.3. Market Analysis, Insights and Forecast - by Application
- 7.3.1. Skin Care
- 7.3.2. Hair Care
- 7.3.3. Injectables
- 7.3.4. Other Applications (Makeup and Body care)
- 7.1. Market Analysis, Insights and Forecast - by Source
- 8. North America Cosmetic Antioxidants Industry Analysis, Insights and Forecast, 2020-2032
- 8.1. Market Analysis, Insights and Forecast - by Source
- 8.1.1. Natural
- 8.1.2. Chemically Derived
- 8.2. Market Analysis, Insights and Forecast - by Type
- 8.2.1. Vitamins
- 8.2.2. Polyphenols
- 8.2.3. Enzymes
- 8.2.4. Carotenoids
- 8.2.5. Other Ty
- 8.3. Market Analysis, Insights and Forecast - by Application
- 8.3.1. Skin Care
- 8.3.2. Hair Care
- 8.3.3. Injectables
- 8.3.4. Other Applications (Makeup and Body care)
- 8.1. Market Analysis, Insights and Forecast - by Source
- 9. Europe Cosmetic Antioxidants Industry Analysis, Insights and Forecast, 2020-2032
- 9.1. Market Analysis, Insights and Forecast - by Source
- 9.1.1. Natural
- 9.1.2. Chemically Derived
- 9.2. Market Analysis, Insights and Forecast - by Type
- 9.2.1. Vitamins
- 9.2.2. Polyphenols
- 9.2.3. Enzymes
- 9.2.4. Carotenoids
- 9.2.5. Other Ty
- 9.3. Market Analysis, Insights and Forecast - by Application
- 9.3.1. Skin Care
- 9.3.2. Hair Care
- 9.3.3. Injectables
- 9.3.4. Other Applications (Makeup and Body care)
- 9.1. Market Analysis, Insights and Forecast - by Source
- 10. South America Cosmetic Antioxidants Industry Analysis, Insights and Forecast, 2020-2032
- 10.1. Market Analysis, Insights and Forecast - by Source
- 10.1.1. Natural
- 10.1.2. Chemically Derived
- 10.2. Market Analysis, Insights and Forecast - by Type
- 10.2.1. Vitamins
- 10.2.2. Polyphenols
- 10.2.3. Enzymes
- 10.2.4. Carotenoids
- 10.2.5. Other Ty
- 10.3. Market Analysis, Insights and Forecast - by Application
- 10.3.1. Skin Care
- 10.3.2. Hair Care
- 10.3.3. Injectables
- 10.3.4. Other Applications (Makeup and Body care)
- 10.1. Market Analysis, Insights and Forecast - by Source
- 11. Middle East and Africa Cosmetic Antioxidants Industry Analysis, Insights and Forecast, 2020-2032
- 11.1. Market Analysis, Insights and Forecast - by Source
- 11.1.1. Natural
- 11.1.2. Chemically Derived
- 11.2. Market Analysis, Insights and Forecast - by Type
- 11.2.1. Vitamins
- 11.2.2. Polyphenols
- 11.2.3. Enzymes
- 11.2.4. Carotenoids
- 11.2.5. Other Ty
- 11.3. Market Analysis, Insights and Forecast - by Application
- 11.3.1. Skin Care
- 11.3.2. Hair Care
- 11.3.3. Injectables
- 11.3.4. Other Applications (Makeup and Body care)
- 11.1. Market Analysis, Insights and Forecast - by Source
- 12. Competitive Analysis
- 12.1. Company Profiles
- 12.1.1 Koninklijke DSM
- 12.1.1.1. Company Overview
- 12.1.1.2. Products
- 12.1.1.3. Company Financials
- 12.1.1.4. SWOT Analysis
- 12.1.2 Lonza Group
- 12.1.2.1. Company Overview
- 12.1.2.2. Products
- 12.1.2.3. Company Financials
- 12.1.2.4. SWOT Analysis
- 12.1.3 Kemin Industries
- 12.1.3.1. Company Overview
- 12.1.3.2. Products
- 12.1.3.3. Company Financials
- 12.1.3.4. SWOT Analysis
- 12.1.4 Evonik Industries AG
- 12.1.4.1. Company Overview
- 12.1.4.2. Products
- 12.1.4.3. Company Financials
- 12.1.4.4. SWOT Analysis
- 12.1.5 Provital Group
- 12.1.5.1. Company Overview
- 12.1.5.2. Products
- 12.1.5.3. Company Financials
- 12.1.5.4. SWOT Analysis
- 12.1.6 Croda International Plc
- 12.1.6.1. Company Overview
- 12.1.6.2. Products
- 12.1.6.3. Company Financials
- 12.1.6.4. SWOT Analysis
- 12.1.7 BASF SE
- 12.1.7.1. Company Overview
- 12.1.7.2. Products
- 12.1.7.3. Company Financials
- 12.1.7.4. SWOT Analysis
- 12.1.8 Eastman Chemical Company
- 12.1.8.1. Company Overview
- 12.1.8.2. Products
- 12.1.8.3. Company Financials
- 12.1.8.4. SWOT Analysis
- 12.1.9 BTSA Biotecnologias Aplicadas
- 12.1.9.1. Company Overview
- 12.1.9.2. Products
- 12.1.9.3. Company Financials
- 12.1.9.4. SWOT Analysis
- 12.1.10 Wacker Chemie AG*List Not Exhaustive
- 12.1.10.1. Company Overview
- 12.1.10.2. Products
- 12.1.10.3. Company Financials
- 12.1.10.4. SWOT Analysis
- 12.1.1 Koninklijke DSM
- 12.2. Market Entropy
- 12.2.1 Company's Key Areas Served
- 12.2.2 Recent Developments
- 12.3. Company Market Share Analysis 2025
- 12.3.1 Top 5 Companies Market Share Analysis
- 12.3.2 Top 3 Companies Market Share Analysis
- 12.4. List of Potential Customers
- 13. Research Methodology
List of Figures
- Figure 1: Global Cosmetic Antioxidants Industry Revenue Breakdown (Million, %) by Region 2025 & 2033
- Figure 2: Asia Pacific Cosmetic Antioxidants Industry Revenue (Million), by Source 2025 & 2033
- Figure 3: Asia Pacific Cosmetic Antioxidants Industry Revenue Share (%), by Source 2025 & 2033
- Figure 4: Asia Pacific Cosmetic Antioxidants Industry Revenue (Million), by Type 2025 & 2033
- Figure 5: Asia Pacific Cosmetic Antioxidants Industry Revenue Share (%), by Type 2025 & 2033
- Figure 6: Asia Pacific Cosmetic Antioxidants Industry Revenue (Million), by Application 2025 & 2033
- Figure 7: Asia Pacific Cosmetic Antioxidants Industry Revenue Share (%), by Application 2025 & 2033
- Figure 8: Asia Pacific Cosmetic Antioxidants Industry Revenue (Million), by Country 2025 & 2033
- Figure 9: Asia Pacific Cosmetic Antioxidants Industry Revenue Share (%), by Country 2025 & 2033
- Figure 10: North America Cosmetic Antioxidants Industry Revenue (Million), by Source 2025 & 2033
- Figure 11: North America Cosmetic Antioxidants Industry Revenue Share (%), by Source 2025 & 2033
- Figure 12: North America Cosmetic Antioxidants Industry Revenue (Million), by Type 2025 & 2033
- Figure 13: North America Cosmetic Antioxidants Industry Revenue Share (%), by Type 2025 & 2033
- Figure 14: North America Cosmetic Antioxidants Industry Revenue (Million), by Application 2025 & 2033
- Figure 15: North America Cosmetic Antioxidants Industry Revenue Share (%), by Application 2025 & 2033
- Figure 16: North America Cosmetic Antioxidants Industry Revenue (Million), by Country 2025 & 2033
- Figure 17: North America Cosmetic Antioxidants Industry Revenue Share (%), by Country 2025 & 2033
- Figure 18: Europe Cosmetic Antioxidants Industry Revenue (Million), by Source 2025 & 2033
- Figure 19: Europe Cosmetic Antioxidants Industry Revenue Share (%), by Source 2025 & 2033
- Figure 20: Europe Cosmetic Antioxidants Industry Revenue (Million), by Type 2025 & 2033
- Figure 21: Europe Cosmetic Antioxidants Industry Revenue Share (%), by Type 2025 & 2033
- Figure 22: Europe Cosmetic Antioxidants Industry Revenue (Million), by Application 2025 & 2033
- Figure 23: Europe Cosmetic Antioxidants Industry Revenue Share (%), by Application 2025 & 2033
- Figure 24: Europe Cosmetic Antioxidants Industry Revenue (Million), by Country 2025 & 2033
- Figure 25: Europe Cosmetic Antioxidants Industry Revenue Share (%), by Country 2025 & 2033
- Figure 26: South America Cosmetic Antioxidants Industry Revenue (Million), by Source 2025 & 2033
- Figure 27: South America Cosmetic Antioxidants Industry Revenue Share (%), by Source 2025 & 2033
- Figure 28: South America Cosmetic Antioxidants Industry Revenue (Million), by Type 2025 & 2033
- Figure 29: South America Cosmetic Antioxidants Industry Revenue Share (%), by Type 2025 & 2033
- Figure 30: South America Cosmetic Antioxidants Industry Revenue (Million), by Application 2025 & 2033
- Figure 31: South America Cosmetic Antioxidants Industry Revenue Share (%), by Application 2025 & 2033
- Figure 32: South America Cosmetic Antioxidants Industry Revenue (Million), by Country 2025 & 2033
- Figure 33: South America Cosmetic Antioxidants Industry Revenue Share (%), by Country 2025 & 2033
- Figure 34: Middle East and Africa Cosmetic Antioxidants Industry Revenue (Million), by Source 2025 & 2033
- Figure 35: Middle East and Africa Cosmetic Antioxidants Industry Revenue Share (%), by Source 2025 & 2033
- Figure 36: Middle East and Africa Cosmetic Antioxidants Industry Revenue (Million), by Type 2025 & 2033
- Figure 37: Middle East and Africa Cosmetic Antioxidants Industry Revenue Share (%), by Type 2025 & 2033
- Figure 38: Middle East and Africa Cosmetic Antioxidants Industry Revenue (Million), by Application 2025 & 2033
- Figure 39: Middle East and Africa Cosmetic Antioxidants Industry Revenue Share (%), by Application 2025 & 2033
- Figure 40: Middle East and Africa Cosmetic Antioxidants Industry Revenue (Million), by Country 2025 & 2033
- Figure 41: Middle East and Africa Cosmetic Antioxidants Industry Revenue Share (%), by Country 2025 & 2033
List of Tables
- Table 1: Global Cosmetic Antioxidants Industry Revenue Million Forecast, by Source 2020 & 2033
- Table 2: Global Cosmetic Antioxidants Industry Revenue Million Forecast, by Type 2020 & 2033
- Table 3: Global Cosmetic Antioxidants Industry Revenue Million Forecast, by Application 2020 & 2033
- Table 4: Global Cosmetic Antioxidants Industry Revenue Million Forecast, by Region 2020 & 2033
- Table 5: Global Cosmetic Antioxidants Industry Revenue Million Forecast, by Source 2020 & 2033
- Table 6: Global Cosmetic Antioxidants Industry Revenue Million Forecast, by Type 2020 & 2033
- Table 7: Global Cosmetic Antioxidants Industry Revenue Million Forecast, by Application 2020 & 2033
- Table 8: Global Cosmetic Antioxidants Industry Revenue Million Forecast, by Country 2020 & 2033
- Table 9: China Cosmetic Antioxidants Industry Revenue (Million) Forecast, by Application 2020 & 2033
- Table 10: India Cosmetic Antioxidants Industry Revenue (Million) Forecast, by Application 2020 & 2033
- Table 11: Japan Cosmetic Antioxidants Industry Revenue (Million) Forecast, by Application 2020 & 2033
- Table 12: South Korea Cosmetic Antioxidants Industry Revenue (Million) Forecast, by Application 2020 & 2033
- Table 13: Rest of Asia Pacific Cosmetic Antioxidants Industry Revenue (Million) Forecast, by Application 2020 & 2033
- Table 14: Global Cosmetic Antioxidants Industry Revenue Million Forecast, by Source 2020 & 2033
- Table 15: Global Cosmetic Antioxidants Industry Revenue Million Forecast, by Type 2020 & 2033
- Table 16: Global Cosmetic Antioxidants Industry Revenue Million Forecast, by Application 2020 & 2033
- Table 17: Global Cosmetic Antioxidants Industry Revenue Million Forecast, by Country 2020 & 2033
- Table 18: United States Cosmetic Antioxidants Industry Revenue (Million) Forecast, by Application 2020 & 2033
- Table 19: Canada Cosmetic Antioxidants Industry Revenue (Million) Forecast, by Application 2020 & 2033
- Table 20: Mexico Cosmetic Antioxidants Industry Revenue (Million) Forecast, by Application 2020 & 2033
- Table 21: Global Cosmetic Antioxidants Industry Revenue Million Forecast, by Source 2020 & 2033
- Table 22: Global Cosmetic Antioxidants Industry Revenue Million Forecast, by Type 2020 & 2033
- Table 23: Global Cosmetic Antioxidants Industry Revenue Million Forecast, by Application 2020 & 2033
- Table 24: Global Cosmetic Antioxidants Industry Revenue Million Forecast, by Country 2020 & 2033
- Table 25: Germany Cosmetic Antioxidants Industry Revenue (Million) Forecast, by Application 2020 & 2033
- Table 26: United Kingdom Cosmetic Antioxidants Industry Revenue (Million) Forecast, by Application 2020 & 2033
- Table 27: Italy Cosmetic Antioxidants Industry Revenue (Million) Forecast, by Application 2020 & 2033
- Table 28: France Cosmetic Antioxidants Industry Revenue (Million) Forecast, by Application 2020 & 2033
- Table 29: Rest of Europe Cosmetic Antioxidants Industry Revenue (Million) Forecast, by Application 2020 & 2033
- Table 30: Global Cosmetic Antioxidants Industry Revenue Million Forecast, by Source 2020 & 2033
- Table 31: Global Cosmetic Antioxidants Industry Revenue Million Forecast, by Type 2020 & 2033
- Table 32: Global Cosmetic Antioxidants Industry Revenue Million Forecast, by Application 2020 & 2033
- Table 33: Global Cosmetic Antioxidants Industry Revenue Million Forecast, by Country 2020 & 2033
- Table 34: Brazil Cosmetic Antioxidants Industry Revenue (Million) Forecast, by Application 2020 & 2033
- Table 35: Argentina Cosmetic Antioxidants Industry Revenue (Million) Forecast, by Application 2020 & 2033
- Table 36: Rest of South America Cosmetic Antioxidants Industry Revenue (Million) Forecast, by Application 2020 & 2033
- Table 37: Global Cosmetic Antioxidants Industry Revenue Million Forecast, by Source 2020 & 2033
- Table 38: Global Cosmetic Antioxidants Industry Revenue Million Forecast, by Type 2020 & 2033
- Table 39: Global Cosmetic Antioxidants Industry Revenue Million Forecast, by Application 2020 & 2033
- Table 40: Global Cosmetic Antioxidants Industry Revenue Million Forecast, by Country 2020 & 2033
- Table 41: Saudi Arabia Cosmetic Antioxidants Industry Revenue (Million) Forecast, by Application 2020 & 2033
- Table 42: South Africa Cosmetic Antioxidants Industry Revenue (Million) Forecast, by Application 2020 & 2033
- Table 43: Rest of Middle East and Africa Cosmetic Antioxidants Industry Revenue (Million) Forecast, by Application 2020 & 2033
Frequently Asked Questions
1. What is the projected Compound Annual Growth Rate (CAGR) of the Cosmetic Antioxidants Industry?
The projected CAGR is approximately 5.95%.
2. Which companies are prominent players in the Cosmetic Antioxidants Industry?
Key companies in the market include Koninklijke DSM, Lonza Group, Kemin Industries, Evonik Industries AG, Provital Group, Croda International Plc, BASF SE, Eastman Chemical Company, BTSA Biotecnologias Aplicadas, Wacker Chemie AG*List Not Exhaustive.
3. What are the main segments of the Cosmetic Antioxidants Industry?
The market segments include Source, Type, Application.
4. Can you provide details about the market size?
The market size is estimated to be USD 139.23 Million as of 2022.
5. What are some drivers contributing to market growth?
Rise in Online Purcahse of Cosmetics; Increasing Use of Beauty Products and Personal Care Products; Other Drivers.
6. What are the notable trends driving market growth?
Increasing Usage of Natural Antioxidants in Cosmetics Products.
7. Are there any restraints impacting market growth?
High Cost of Natural Antioxidants; Other Restraints.
8. Can you provide examples of recent developments in the market?
October 2023: BASF's Care Chemicals division is investing in a new plant to produce emollient specialties at its Düsseldorf site targeted for skin and sun protection products.
9. What pricing options are available for accessing the report?
Pricing options include single-user, multi-user, and enterprise licenses priced at USD 4750, USD 5250, and USD 8750 respectively.
10. Is the market size provided in terms of value or volume?
The market size is provided in terms of value, measured in Million.
11. Are there any specific market keywords associated with the report?
Yes, the market keyword associated with the report is "Cosmetic Antioxidants Industry," which aids in identifying and referencing the specific market segment covered.
12. How do I determine which pricing option suits my needs best?
The pricing options vary based on user requirements and access needs. Individual users may opt for single-user licenses, while businesses requiring broader access may choose multi-user or enterprise licenses for cost-effective access to the report.
13. Are there any additional resources or data provided in the Cosmetic Antioxidants Industry report?
While the report offers comprehensive insights, it's advisable to review the specific contents or supplementary materials provided to ascertain if additional resources or data are available.
14. How can I stay updated on further developments or reports in the Cosmetic Antioxidants Industry?
To stay informed about further developments, trends, and reports in the Cosmetic Antioxidants Industry, consider subscribing to industry newsletters, following relevant companies and organizations, or regularly checking reputable industry news sources and publications.
Methodology
Step 1 - Identification of Relevant Samples Size from Population Database


Step 2 - Approaches for Defining Global Market Size (Value, Volume* & Price*)

Note*: In applicable scenarios
Step 3 - Data Sources
Primary Research
- Web Analytics
- Survey Reports
- Research Institute
- Latest Research Reports
- Opinion Leaders
Secondary Research
- Annual Reports
- White Paper
- Latest Press Release
- Industry Association
- Paid Database
- Investor Presentations

Step 4 - Data Triangulation
Involves using different sources of information in order to increase the validity of a study
These sources are likely to be stakeholders in a program - participants, other researchers, program staff, other community members, and so on.
Then we put all data in single framework & apply various statistical tools to find out the dynamic on the market.
During the analysis stage, feedback from the stakeholder groups would be compared to determine areas of agreement as well as areas of divergence