

Key Insights
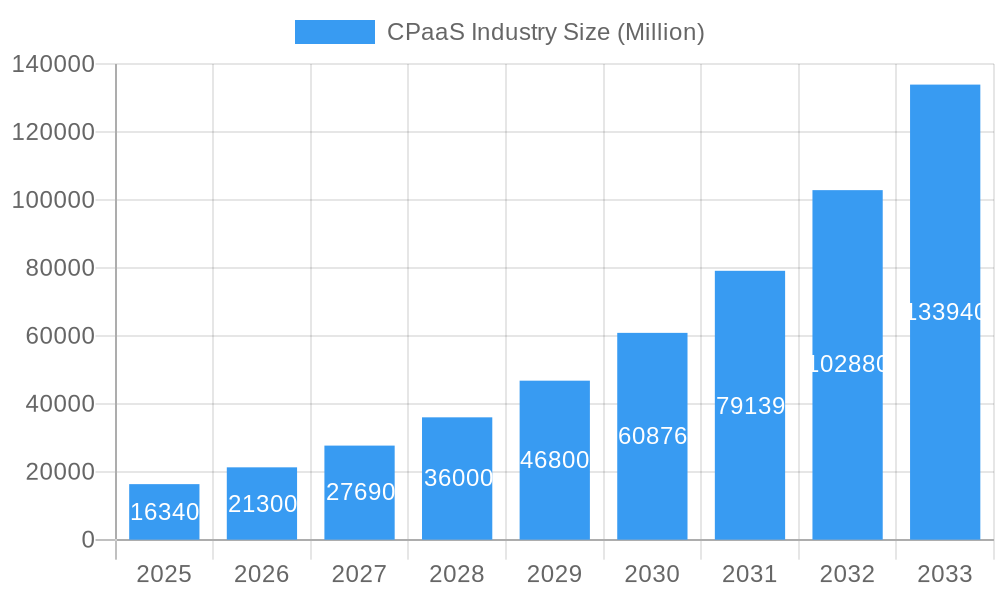
The CPaaS (Communications Platform as a Service) market is experiencing robust growth, projected to reach \$16.34 billion in 2025 and exhibiting a compound annual growth rate (CAGR) of 30.40% from 2025 to 2033. This expansion is fueled by several key factors. The increasing adoption of cloud-based communication solutions by businesses across various sectors, including IT and Telecom, BFSI (Banking, Financial Services, and Insurance), Retail and E-commerce, and Healthcare, is a major driver. Businesses are seeking scalable, flexible, and cost-effective communication solutions to enhance customer engagement, improve operational efficiency, and support digital transformation initiatives. The rising demand for omnichannel communication strategies, incorporating SMS, voice, video, and chat functionalities, further contributes to market growth. Furthermore, the growing integration of AI and machine learning capabilities within CPaaS platforms is enhancing functionalities like intelligent routing, automated responses, and sentiment analysis, attracting further investment and adoption. Competitive pressures among established players like Twilio, Vonage, and newer entrants are leading to continuous innovation and price optimization, making CPaaS accessible to a broader range of businesses.
CPaaS Industry Market Size (In Billion)
However, certain challenges exist. Security concerns surrounding data privacy and the integration of third-party APIs remain significant hurdles. The complexity of integrating CPaaS solutions with existing legacy systems can also hinder adoption, particularly for smaller businesses lacking the necessary technical expertise. Despite these restraints, the long-term outlook for the CPaaS market remains extremely positive. The continued expansion of digital channels and the growing need for seamless communication experiences will drive further growth, creating significant opportunities for both established players and emerging CPaaS providers. The market's segmentation across various end-user verticals indicates the broad applicability and adaptability of CPaaS solutions, signifying continued growth across diverse business landscapes.
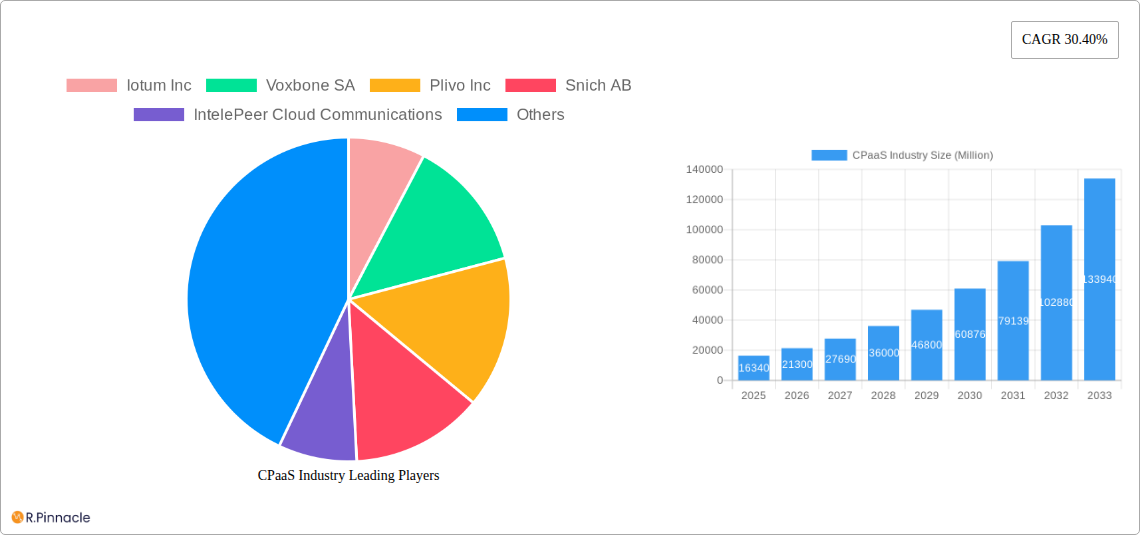
CPaaS Industry Company Market Share
CPaaS Industry Market Report: 2019-2033 Forecast
This comprehensive report provides an in-depth analysis of the CPaaS (Communications Platform as a Service) industry, offering actionable insights for industry professionals and investors. The report covers market structure, dynamics, dominant regions, product innovations, and leading players, projecting growth from 2019 to 2033. With a base year of 2025 and an estimated year of 2025, this report offers a detailed forecast from 2025 to 2033, leveraging data from the historical period of 2019-2024. The global CPaaS market is projected to reach xx Million by 2033.
CPaaS Industry Market Structure & Innovation Trends
The CPaaS market exhibits a moderately concentrated structure with several major players commanding significant market share. Twilio Inc. and Vonage Holdings Corp. hold a combined xx% market share in 2025, while other key players like Infobip Ltd. and MessageBird B.V. capture significant portions of the remaining market. The market is characterized by continuous innovation driven by the increasing demand for seamless communication solutions across diverse industries. Regulatory frameworks, varying by region, impact market access and compliance. Product substitutes, such as traditional on-premise PBX systems, face declining relevance due to CPaaS's cost-effectiveness and scalability. The end-user demographic spans across various sectors, with a notable concentration in IT & Telecom, BFSI, and Retail & E-commerce. M&A activities have been significant, with deal values exceeding xx Million in the past five years, indicating ongoing consolidation within the industry.
- Market Concentration: Highly concentrated with a few major players dominating.
- Innovation Drivers: Demand for seamless communication, technological advancements (AI, IoT integration).
- Regulatory Frameworks: Vary significantly across regions, impacting market entry and operation.
- Product Substitutes: Traditional PBX systems, facing reduced market share.
- M&A Activities: High deal volume, exceeding xx Million in total value over the past five years.
CPaaS Industry Market Dynamics & Trends
The CPaaS market is experiencing robust growth, with a projected Compound Annual Growth Rate (CAGR) of xx% during the forecast period (2025-2033). Key growth drivers include the rising adoption of cloud-based solutions, the increasing penetration of smartphones and mobile internet, and the growing demand for omnichannel communication strategies across industries. Technological disruptions, such as the integration of Artificial Intelligence (AI) and Internet of Things (IoT) devices, are further fueling market expansion. Consumer preferences for personalized and seamless communication experiences are driving the demand for advanced CPaaS functionalities. The competitive dynamics are intense, with companies vying for market share through strategic partnerships, product innovations, and aggressive pricing strategies. Market penetration is expected to reach xx% by 2033, driven by increased awareness and adoption across various verticals.
Dominant Regions & Segments in CPaaS Industry
North America currently dominates the CPaaS market, driven by high technological adoption, robust digital infrastructure, and a strong presence of major CPaaS providers.
- North America:
- Key Drivers: High technological adoption, well-developed digital infrastructure, large pool of tech-savvy consumers.
- Europe:
- Key Drivers: Growing adoption of cloud-based communication solutions, increasing digitalization across various sectors.
- Asia-Pacific:
- Key Drivers: Rapid economic growth, increasing smartphone penetration, and expanding internet connectivity.
Dominant End-User Verticals:
- IT and Telecom: Highest adoption due to reliance on communication technologies and internal business needs.
- BFSI: High demand for secure and reliable communication for customer service and transaction processing.
- Retail and E-commerce: Demand for personalized customer interactions and enhanced support channels.
- Healthcare: Growing adoption for telehealth applications, remote patient monitoring, and improved communication among healthcare professionals.
- Other End-User Verticals: Increasing adoption across various sectors (education, government, etc.)
CPaaS Industry Product Innovations
Recent product developments focus on enhanced security features, AI-powered chatbots for customer service automation, and integration with various messaging platforms (WhatsApp, Facebook Messenger, etc.). The market is witnessing a shift toward integrated platforms offering a comprehensive suite of communication tools, enhancing efficiency and cost-effectiveness for businesses. These innovations deliver competitive advantages through improved customer experience, operational efficiency, and reduced communication costs. Market fit is strong, particularly in industries with high communication volumes and a need for improved customer engagement.
Report Scope & Segmentation Analysis
This report segments the CPaaS market by end-user vertical: IT and Telecom, BFSI, Retail and E-commerce, Healthcare, and Other End-User Verticals. Each segment exhibits unique growth projections, market sizes, and competitive dynamics. The IT and Telecom segment is projected to maintain the largest market share throughout the forecast period, driven by the industry's inherent reliance on communication technologies. The BFSI and Retail & E-commerce segments are experiencing significant growth due to increasing demand for enhanced customer engagement and operational efficiency. The Healthcare segment is experiencing rapid growth fueled by the adoption of telehealth and remote patient monitoring solutions. The "Other End-User Verticals" segment shows consistent, moderate growth, reflecting a broad adoption across various industries.
Key Drivers of CPaaS Industry Growth
The CPaaS market's growth is propelled by several key factors:
- Technological Advancements: AI, IoT integration, and improved API functionalities are enhancing CPaaS capabilities.
- Economic Factors: Cost-effectiveness compared to traditional communication systems, increased ROI for businesses.
- Regulatory Changes: Government initiatives promoting digitalization and cloud adoption.
Challenges in the CPaaS Industry Sector
The CPaaS industry faces challenges such as:
- Regulatory Hurdles: Varying data privacy regulations across different regions increase compliance complexity.
- Supply Chain Issues: Global supply chain disruptions may impact the availability of hardware and software components.
- Competitive Pressure: Intense competition among major players requires continuous innovation and cost optimization.
Emerging Opportunities in CPaaS Industry
Emerging opportunities include:
- Expansion into new markets: Untapped potential in developing economies with growing internet penetration.
- Integration with emerging technologies: 5G, edge computing, and blockchain technology provide new avenues for innovation.
- Focus on niche applications: Specialized solutions for specific industries (e.g., healthcare, education).
Leading Players in the CPaaS Industry Market
- Iotum Inc
- Voxbone SA
- Plivo Inc
- Snich AB
- IntelePeer Cloud Communications
- Infobip Ltd
- Voxvalley Technologies
- Voximplant (Zingaya Inc)
- EnableX io (VCLOUDX PTE LTD)
- 8x8 Inc
- Twilio Inc
- Avaya Inc
- Vonage Holdings Corp
- MessageBird B.V.
- Bandwidth Inc (Bandwidth.com)
- Wazo Communication Inc
- Mitel Networks Corporation
- M800 Limited
- AT&T Inc
- Telestax
Key Developments in CPaaS Industry
- March 2022: Mitel launched subscription-based solutions across its flagship platforms (MiVoice 5000, MiVoice Business, MiVoice MX-ONE, and MiVoice Office 400), enhancing customer flexibility and access to cloud technologies.
- February 2022: Radisys Corporation launched the Radisys Engage Digital Platform (EDP), an open cloud communication platform enabling next-generation programmable communication services with conversational AI, video customer care, and Industry 5.0 applications.
Future Outlook for CPaaS Industry Market
The CPaaS market is poised for continued strong growth, driven by ongoing technological advancements, increasing digital transformation across industries, and the growing demand for enhanced communication experiences. Strategic opportunities lie in expanding into new markets, developing innovative solutions integrating emerging technologies, and focusing on niche applications to cater to specific industry needs. The market's future potential is substantial, promising significant growth and opportunities for established players and new entrants alike.
CPaaS Industry Segmentation
-
1. End-User Vertical
- 1.1. IT and Telecom
- 1.2. BFSI
- 1.3. Retail and E-commerce
- 1.4. Healthcare
- 1.5. Other End-User Verticals
CPaaS Industry Segmentation By Geography
- 1. North America
- 2. Europe
- 3. Asia Pacific
- 4. Rest of the World
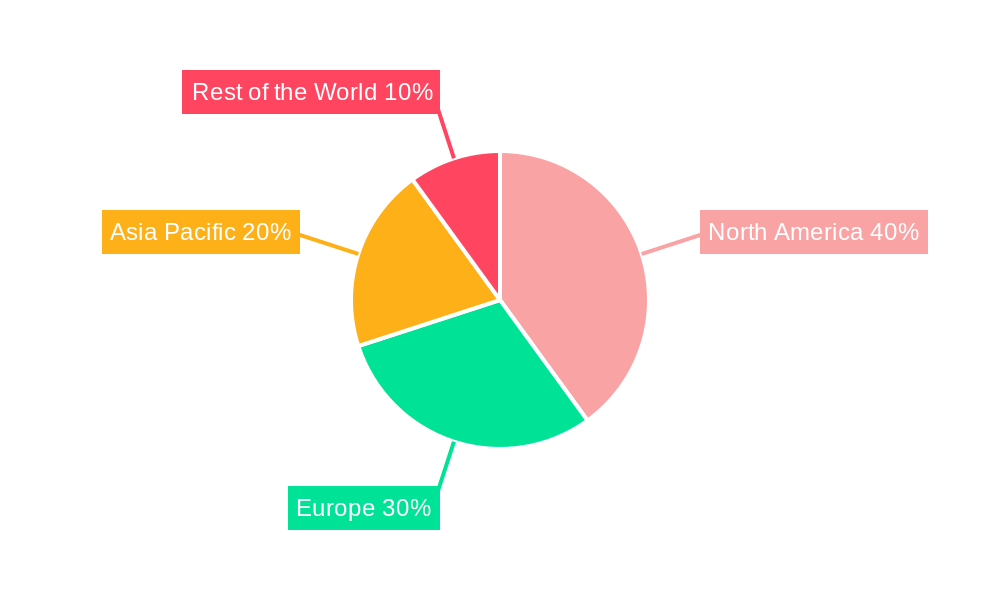
CPaaS Industry Regional Market Share
Geographic Coverage of CPaaS Industry
CPaaS Industry REPORT HIGHLIGHTS
| Aspects | Details |
|---|---|
| Study Period | 2020-2034 |
| Base Year | 2025 |
| Estimated Year | 2026 |
| Forecast Period | 2026-2034 |
| Historical Period | 2020-2025 |
| Growth Rate | CAGR of 30.40% from 2020-2034 |
| Segmentation |
|
Table of Contents
- 1. Introduction
- 1.1. Research Scope
- 1.2. Market Segmentation
- 1.3. Research Objective
- 1.4. Definitions and Assumptions
- 2. Executive Summary
- 2.1. Market Snapshot
- 3. Market Dynamics
- 3.1. Market Drivers
- 3.2. Market Restrains
- 3.3. Market Trends
- 3.4. Market Opportunities
- 4. Market Factor Analysis
- 4.1. Porters Five Forces
- 4.1.1. Bargaining Power of Suppliers
- 4.1.2. Bargaining Power of Buyers
- 4.1.3. Threat of New Entrants
- 4.1.4. Threat of Substitutes
- 4.1.5. Competitive Rivalry
- 4.2. PESTEL analysis
- 4.3. BCG Analysis
- 4.3.1. Stars (High Growth, High Market Share)
- 4.3.2. Cash Cows (Low Growth, High Market Share)
- 4.3.3. Question Mark (High Growth, Low Market Share)
- 4.3.4. Dogs (Low Growth, Low Market Share)
- 4.4. Ansoff Matrix Analysis
- 4.5. Supply Chain Analysis
- 4.6. Regulatory Landscape
- 4.7. Current Market Potential and Opportunity Assessment (TAM–SAM–SOM Framework)
- 4.8. PRI Analyst Note
- 4.1. Porters Five Forces
- 5. Market Analysis, Insights and Forecast 2021-2033
- 5.1. Market Analysis, Insights and Forecast - by End-User Vertical
- 5.1.1. IT and Telecom
- 5.1.2. BFSI
- 5.1.3. Retail and E-commerce
- 5.1.4. Healthcare
- 5.1.5. Other End-User Verticals
- 5.2. Market Analysis, Insights and Forecast - by Region
- 5.2.1. North America
- 5.2.2. Europe
- 5.2.3. Asia Pacific
- 5.2.4. Rest of the World
- 5.1. Market Analysis, Insights and Forecast - by End-User Vertical
- 6. Global CPaaS Industry Analysis, Insights and Forecast, 2021-2033
- 6.1. Market Analysis, Insights and Forecast - by End-User Vertical
- 6.1.1. IT and Telecom
- 6.1.2. BFSI
- 6.1.3. Retail and E-commerce
- 6.1.4. Healthcare
- 6.1.5. Other End-User Verticals
- 6.1. Market Analysis, Insights and Forecast - by End-User Vertical
- 7. North America CPaaS Industry Analysis, Insights and Forecast, 2020-2032
- 7.1. Market Analysis, Insights and Forecast - by End-User Vertical
- 7.1.1. IT and Telecom
- 7.1.2. BFSI
- 7.1.3. Retail and E-commerce
- 7.1.4. Healthcare
- 7.1.5. Other End-User Verticals
- 7.1. Market Analysis, Insights and Forecast - by End-User Vertical
- 8. Europe CPaaS Industry Analysis, Insights and Forecast, 2020-2032
- 8.1. Market Analysis, Insights and Forecast - by End-User Vertical
- 8.1.1. IT and Telecom
- 8.1.2. BFSI
- 8.1.3. Retail and E-commerce
- 8.1.4. Healthcare
- 8.1.5. Other End-User Verticals
- 8.1. Market Analysis, Insights and Forecast - by End-User Vertical
- 9. Asia Pacific CPaaS Industry Analysis, Insights and Forecast, 2020-2032
- 9.1. Market Analysis, Insights and Forecast - by End-User Vertical
- 9.1.1. IT and Telecom
- 9.1.2. BFSI
- 9.1.3. Retail and E-commerce
- 9.1.4. Healthcare
- 9.1.5. Other End-User Verticals
- 9.1. Market Analysis, Insights and Forecast - by End-User Vertical
- 10. Rest of the World CPaaS Industry Analysis, Insights and Forecast, 2020-2032
- 10.1. Market Analysis, Insights and Forecast - by End-User Vertical
- 10.1.1. IT and Telecom
- 10.1.2. BFSI
- 10.1.3. Retail and E-commerce
- 10.1.4. Healthcare
- 10.1.5. Other End-User Verticals
- 10.1. Market Analysis, Insights and Forecast - by End-User Vertical
- 11. Competitive Analysis
- 11.1. Company Profiles
- 11.1.1 Iotum Inc
- 11.1.1.1. Company Overview
- 11.1.1.2. Products
- 11.1.1.3. Company Financials
- 11.1.1.4. SWOT Analysis
- 11.1.2 Voxbone SA
- 11.1.2.1. Company Overview
- 11.1.2.2. Products
- 11.1.2.3. Company Financials
- 11.1.2.4. SWOT Analysis
- 11.1.3 Plivo Inc
- 11.1.3.1. Company Overview
- 11.1.3.2. Products
- 11.1.3.3. Company Financials
- 11.1.3.4. SWOT Analysis
- 11.1.4 Snich AB
- 11.1.4.1. Company Overview
- 11.1.4.2. Products
- 11.1.4.3. Company Financials
- 11.1.4.4. SWOT Analysis
- 11.1.5 IntelePeer Cloud Communications
- 11.1.5.1. Company Overview
- 11.1.5.2. Products
- 11.1.5.3. Company Financials
- 11.1.5.4. SWOT Analysis
- 11.1.6 Infobip Ltd
- 11.1.6.1. Company Overview
- 11.1.6.2. Products
- 11.1.6.3. Company Financials
- 11.1.6.4. SWOT Analysis
- 11.1.7 Voxvalley Technologies
- 11.1.7.1. Company Overview
- 11.1.7.2. Products
- 11.1.7.3. Company Financials
- 11.1.7.4. SWOT Analysis
- 11.1.8 Voximplant (Zingaya Inc )
- 11.1.8.1. Company Overview
- 11.1.8.2. Products
- 11.1.8.3. Company Financials
- 11.1.8.4. SWOT Analysis
- 11.1.9 EnableX io (VCLOUDX PTE LTD)*List Not Exhaustive
- 11.1.9.1. Company Overview
- 11.1.9.2. Products
- 11.1.9.3. Company Financials
- 11.1.9.4. SWOT Analysis
- 11.1.10 8x8 Inc
- 11.1.10.1. Company Overview
- 11.1.10.2. Products
- 11.1.10.3. Company Financials
- 11.1.10.4. SWOT Analysis
- 11.1.11 Twilio Inc
- 11.1.11.1. Company Overview
- 11.1.11.2. Products
- 11.1.11.3. Company Financials
- 11.1.11.4. SWOT Analysis
- 11.1.12 Avaya Inc
- 11.1.12.1. Company Overview
- 11.1.12.2. Products
- 11.1.12.3. Company Financials
- 11.1.12.4. SWOT Analysis
- 11.1.13 Vonage Holdings Corp
- 11.1.13.1. Company Overview
- 11.1.13.2. Products
- 11.1.13.3. Company Financials
- 11.1.13.4. SWOT Analysis
- 11.1.14 MessageBird B V
- 11.1.14.1. Company Overview
- 11.1.14.2. Products
- 11.1.14.3. Company Financials
- 11.1.14.4. SWOT Analysis
- 11.1.15 Bandwidth Inc (Bandwidth com)
- 11.1.15.1. Company Overview
- 11.1.15.2. Products
- 11.1.15.3. Company Financials
- 11.1.15.4. SWOT Analysis
- 11.1.16 Wazo Communication Inc
- 11.1.16.1. Company Overview
- 11.1.16.2. Products
- 11.1.16.3. Company Financials
- 11.1.16.4. SWOT Analysis
- 11.1.17 Mitel Networks Corporation
- 11.1.17.1. Company Overview
- 11.1.17.2. Products
- 11.1.17.3. Company Financials
- 11.1.17.4. SWOT Analysis
- 11.1.18 M800 Limited
- 11.1.18.1. Company Overview
- 11.1.18.2. Products
- 11.1.18.3. Company Financials
- 11.1.18.4. SWOT Analysis
- 11.1.19 AT&T Inc
- 11.1.19.1. Company Overview
- 11.1.19.2. Products
- 11.1.19.3. Company Financials
- 11.1.19.4. SWOT Analysis
- 11.1.20 Telestax
- 11.1.20.1. Company Overview
- 11.1.20.2. Products
- 11.1.20.3. Company Financials
- 11.1.20.4. SWOT Analysis
- 11.1.1 Iotum Inc
- 11.2. Market Entropy
- 11.2.1 Company's Key Areas Served
- 11.2.2 Recent Developments
- 11.3. Company Market Share Analysis 2025
- 11.3.1 Top 5 Companies Market Share Analysis
- 11.3.2 Top 3 Companies Market Share Analysis
- 11.4. List of Potential Customers
- 12. Research Methodology
List of Figures
- Figure 1: Global CPaaS Industry Revenue Breakdown (Million, %) by Region 2025 & 2033
- Figure 2: North America CPaaS Industry Revenue (Million), by End-User Vertical 2025 & 2033
- Figure 3: North America CPaaS Industry Revenue Share (%), by End-User Vertical 2025 & 2033
- Figure 4: North America CPaaS Industry Revenue (Million), by Country 2025 & 2033
- Figure 5: North America CPaaS Industry Revenue Share (%), by Country 2025 & 2033
- Figure 6: Europe CPaaS Industry Revenue (Million), by End-User Vertical 2025 & 2033
- Figure 7: Europe CPaaS Industry Revenue Share (%), by End-User Vertical 2025 & 2033
- Figure 8: Europe CPaaS Industry Revenue (Million), by Country 2025 & 2033
- Figure 9: Europe CPaaS Industry Revenue Share (%), by Country 2025 & 2033
- Figure 10: Asia Pacific CPaaS Industry Revenue (Million), by End-User Vertical 2025 & 2033
- Figure 11: Asia Pacific CPaaS Industry Revenue Share (%), by End-User Vertical 2025 & 2033
- Figure 12: Asia Pacific CPaaS Industry Revenue (Million), by Country 2025 & 2033
- Figure 13: Asia Pacific CPaaS Industry Revenue Share (%), by Country 2025 & 2033
- Figure 14: Rest of the World CPaaS Industry Revenue (Million), by End-User Vertical 2025 & 2033
- Figure 15: Rest of the World CPaaS Industry Revenue Share (%), by End-User Vertical 2025 & 2033
- Figure 16: Rest of the World CPaaS Industry Revenue (Million), by Country 2025 & 2033
- Figure 17: Rest of the World CPaaS Industry Revenue Share (%), by Country 2025 & 2033
List of Tables
- Table 1: Global CPaaS Industry Revenue Million Forecast, by End-User Vertical 2020 & 2033
- Table 2: Global CPaaS Industry Revenue Million Forecast, by Region 2020 & 2033
- Table 3: Global CPaaS Industry Revenue Million Forecast, by End-User Vertical 2020 & 2033
- Table 4: Global CPaaS Industry Revenue Million Forecast, by Country 2020 & 2033
- Table 5: Global CPaaS Industry Revenue Million Forecast, by End-User Vertical 2020 & 2033
- Table 6: Global CPaaS Industry Revenue Million Forecast, by Country 2020 & 2033
- Table 7: Global CPaaS Industry Revenue Million Forecast, by End-User Vertical 2020 & 2033
- Table 8: Global CPaaS Industry Revenue Million Forecast, by Country 2020 & 2033
- Table 9: Global CPaaS Industry Revenue Million Forecast, by End-User Vertical 2020 & 2033
- Table 10: Global CPaaS Industry Revenue Million Forecast, by Country 2020 & 2033
Frequently Asked Questions
1. What is the projected Compound Annual Growth Rate (CAGR) of the CPaaS Industry?
The projected CAGR is approximately 30.40%.
2. Which companies are prominent players in the CPaaS Industry?
Key companies in the market include Iotum Inc, Voxbone SA, Plivo Inc, Snich AB, IntelePeer Cloud Communications, Infobip Ltd, Voxvalley Technologies, Voximplant (Zingaya Inc ), EnableX io (VCLOUDX PTE LTD)*List Not Exhaustive, 8x8 Inc, Twilio Inc, Avaya Inc, Vonage Holdings Corp, MessageBird B V, Bandwidth Inc (Bandwidth com), Wazo Communication Inc, Mitel Networks Corporation, M800 Limited, AT&T Inc, Telestax.
3. What are the main segments of the CPaaS Industry?
The market segments include End-User Vertical.
4. Can you provide details about the market size?
The market size is estimated to be USD 16.34 Million as of 2022.
5. What are some drivers contributing to market growth?
Growing Shift of Companies from Adjacent and Traditional Models; Growing Demand for Omnichannel Marketing.
6. What are the notable trends driving market growth?
Retail and E-commerce Industry to Drive the Market Growth.
7. Are there any restraints impacting market growth?
Implementation Challenges.
8. Can you provide examples of recent developments in the market?
March 2022: Mitel delcared the launch of subscription-based solutions across all flagship platforms in its universal portfolio, including MiVoice 5000, MiVoice Business, MiVoice MX-ONE, and MiVoice Office 400. These subscription models are anticipated to provide customers with the flexibility to access the latest cloud-based technologies and respond promptly to the ever-changing market needs and demands.
9. What pricing options are available for accessing the report?
Pricing options include single-user, multi-user, and enterprise licenses priced at USD 4750, USD 5250, and USD 8750 respectively.
10. Is the market size provided in terms of value or volume?
The market size is provided in terms of value, measured in Million.
11. Are there any specific market keywords associated with the report?
Yes, the market keyword associated with the report is "CPaaS Industry," which aids in identifying and referencing the specific market segment covered.
12. How do I determine which pricing option suits my needs best?
The pricing options vary based on user requirements and access needs. Individual users may opt for single-user licenses, while businesses requiring broader access may choose multi-user or enterprise licenses for cost-effective access to the report.
13. Are there any additional resources or data provided in the CPaaS Industry report?
While the report offers comprehensive insights, it's advisable to review the specific contents or supplementary materials provided to ascertain if additional resources or data are available.
14. How can I stay updated on further developments or reports in the CPaaS Industry?
To stay informed about further developments, trends, and reports in the CPaaS Industry, consider subscribing to industry newsletters, following relevant companies and organizations, or regularly checking reputable industry news sources and publications.
Methodology
Step 1 - Identification of Relevant Samples Size from Population Database


Step 2 - Approaches for Defining Global Market Size (Value, Volume* & Price*)

Note*: In applicable scenarios
Step 3 - Data Sources
Primary Research
- Web Analytics
- Survey Reports
- Research Institute
- Latest Research Reports
- Opinion Leaders
Secondary Research
- Annual Reports
- White Paper
- Latest Press Release
- Industry Association
- Paid Database
- Investor Presentations

Step 4 - Data Triangulation
Involves using different sources of information in order to increase the validity of a study
These sources are likely to be stakeholders in a program - participants, other researchers, program staff, other community members, and so on.
Then we put all data in single framework & apply various statistical tools to find out the dynamic on the market.
During the analysis stage, feedback from the stakeholder groups would be compared to determine areas of agreement as well as areas of divergence